0445
Simultaneous optimisation of MP2RAGE UNI and FLAWS brain images at 7T using Extended Phase Graph (EPG) Simulations1Division of Imaging Sciences and Biomedical Engineering, King's College London, London, United Kingdom, 2MR Research Collaborations, Siemens Healthcare Limited, Frimley, United Kingdom
Synopsis
The MP2RAGE sequence is typically used at 7T to produce UNI image with maximised contrast between WM-GM and GM-CSF while mitigating B1- field variability. It can also be optimised to obtain Fluid and White Matter Suppression (FLAWS) images but this is typically done separately. Here, the Extended Phase Graph formalism was used to optimise both FLAWS and UNI images at 7T within one acquisition while minimising B1+ sensitivity. Different combinations were tested in healthy subjects with 0.65mm isotropic resolution demonstrating that UNI and FLAWS images could be obtained together while largely maintaining image quality.
Introduction
The Magnetization Prepared Rapid Gradient Echo (MPRAGE)1 sequence is commonly used for T1-weighted imaging of the brain. The MP2RAGE2 sequence acquires two rapid gradient echoes that are combined in a ratio to produce an image (UNI) that is insensitive to receive B1 field variability; however, it is sensitive to variability in the transmit (B1+) field leading to regional changes in contrast and SNR. The UNI image is typically optimised analytically to maximise contrast between white matter (WM), grey matter (GM) and cerebrospinal fluid (CSF). Recently, MP2RAGE has also been optimised aiming to produce images with WM and CSF suppression at each inversion time, before taking the minimum intensity projection, to produce an image with dominant grey matter (GM) signal3,4. The resulting Fluid and White Matter Suppression (FLAWS)3,4 images have shown potential utility for clinical applications5. In this study we used the Extended Phase Graph (EPG)6-9 formalism, aiming to achieve both FLAWS and UNI MP2RAGE images at 7T within one acquisition while minimising B1+ sensitivity. Furthermore, we examined if this was compatible with shorter TRs that enable scan time reduction. Different parameter combinations were tested in four healthy subjects with 0.65mm isotropic resolution.Methods
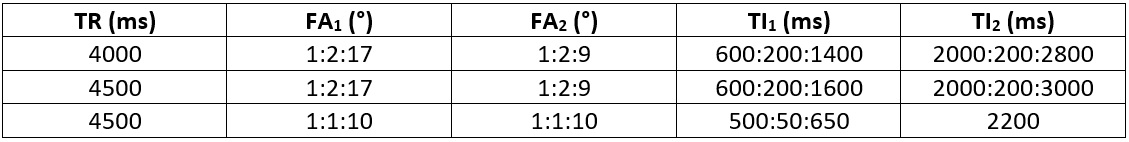
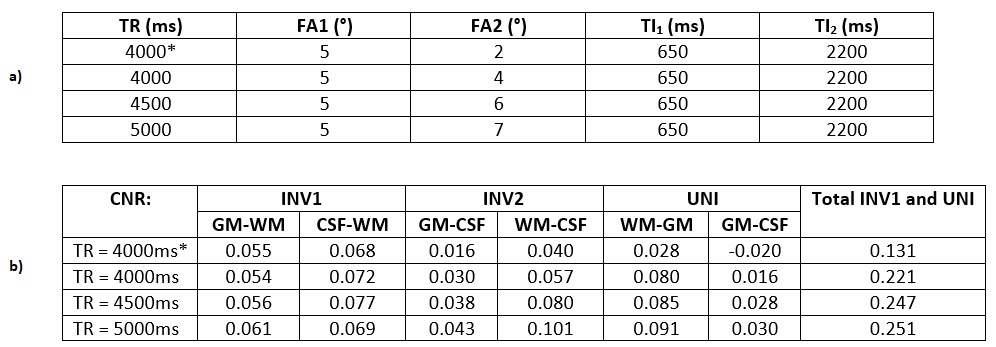
An EPG simulation for GRE sequences9 was modified for MP2RAGE. A B1+ range of 50% to 140% was used. T1 and T2 relaxation values, proton density (PD), echo spacing and number of slices were the inputs. The summary of the simulations is given in Table 1. PD values of 0.69/0.82/1; T1/T2 values of 1220ms/45.9ms, 2132ms/55ms, 3350ms/1000ms were used for WM, GM, and CSF, respectively2,10,11. Noise was modelled using independent Gaussian noise added to the simulation results 100,000 times at a constant level to have an SNR of ~20 in the second GRE image (this avoids inconsistencies in error propagation found in analytical solutions2 when signal intensities are similar at each inversion time). The optimisation targeted WM suppression in the first GRE image (INV1) and CSF suppression in the second GRE image (INV2) while maintaining contrast in the UNI image. For this purpose, the total CNR was defined by the sum of GM-WM and CSF-WM CNRs for the INV1 and WM-GM and GM-CSF CNRs for the UNI images.In vivo images were acquired with the optimised parameters as summarised in Table 2 using a MAGNETOM Terra (Siemens Healthcare, Erlangen, Germany) 7T system. Written consent was obtained from all subjects (31±2 y/o, 4m/1f). FLAWSmin images were obtained using the minimum intensity projection of the INV1 and INV2 magnitude images5. FLAWShco images were obtained using the expression (INV2-INV1)/(INV1+INV2) yielding images with similar contrast to the UNI image5. FLAWShc images were similarly obtained with opposite contrast to the FLAWShco images5. Images12 were coregistered and segmented using SPM1213 software package and MATLAB R2018a (The MathWorks, Natick, MA, USA). Contrast to Noise Ratios (CNRs) corrected for each TR were calculated based on the mean and standard deviation from each tissue class (estimated based on the segmentation at p>0.99).
Results
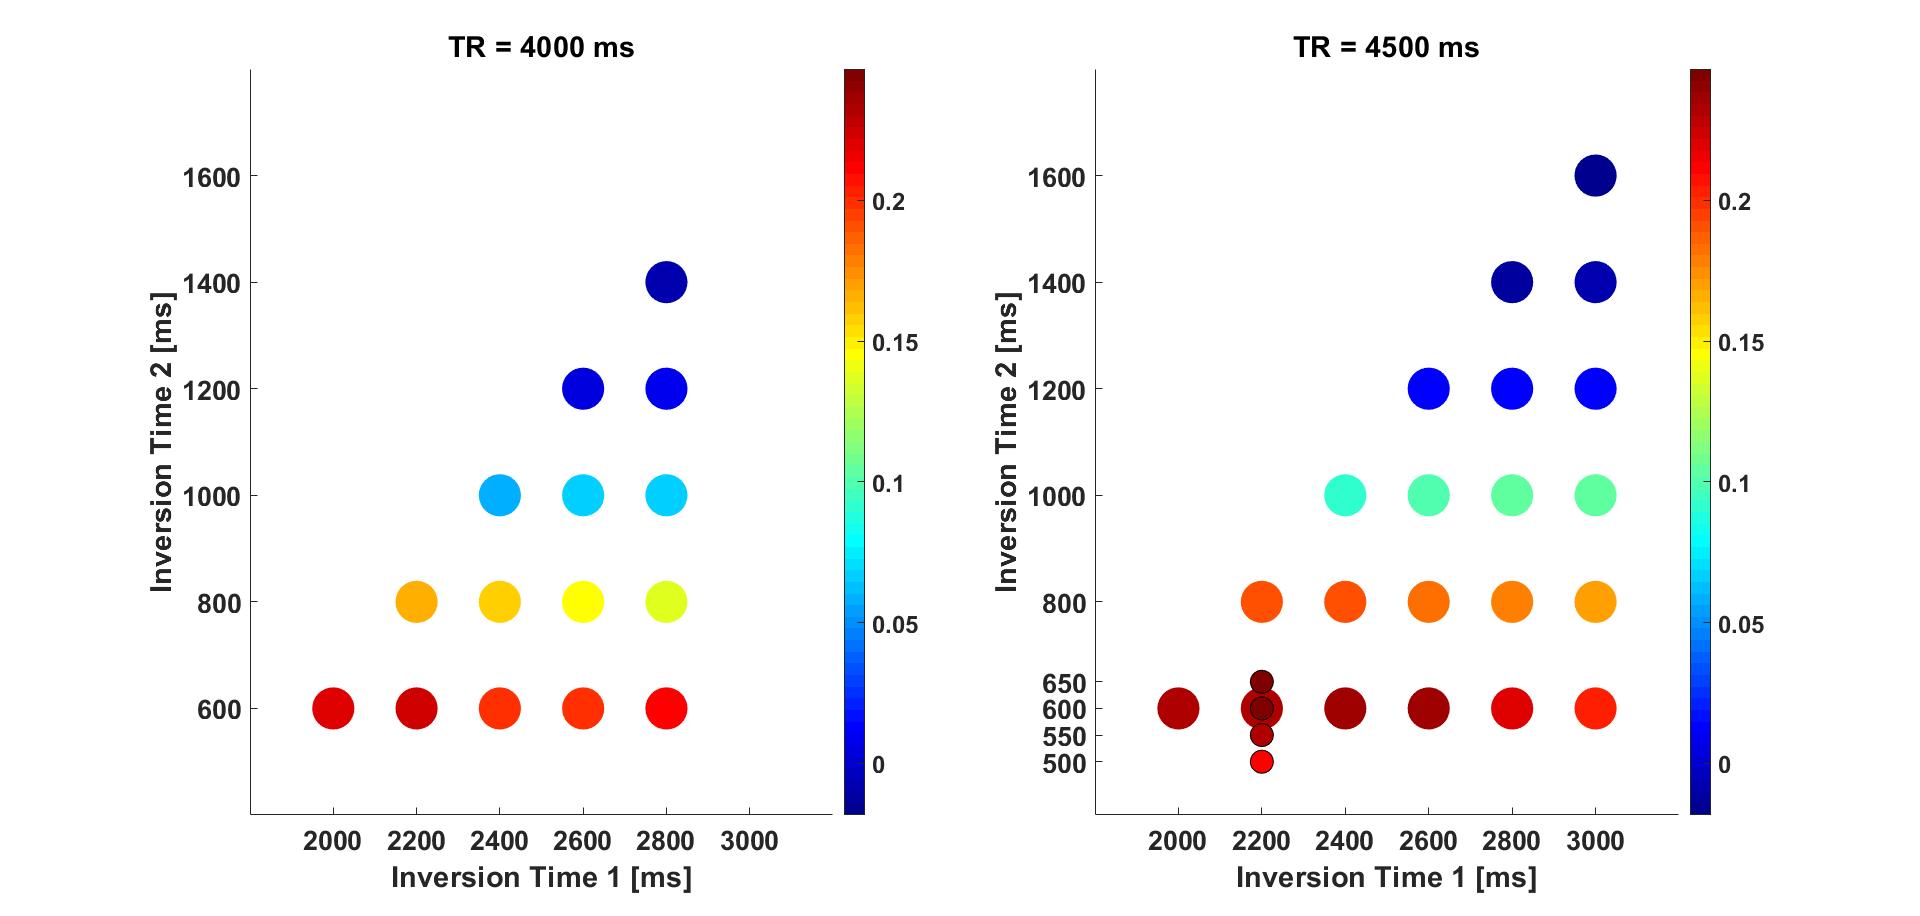
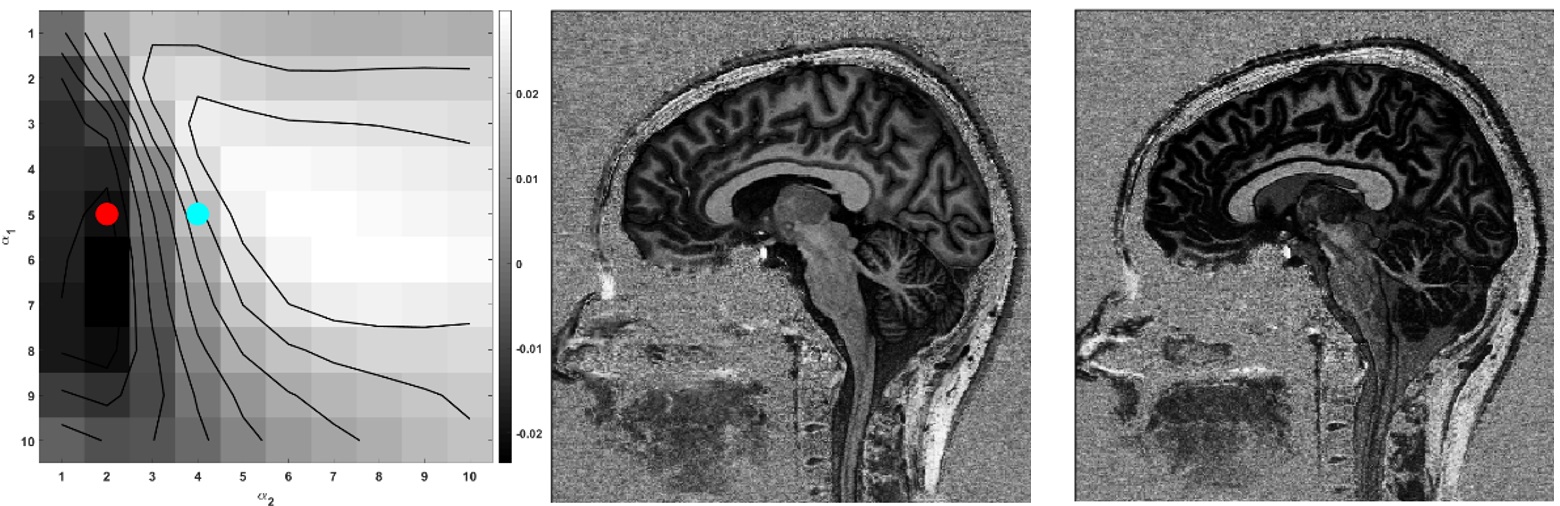
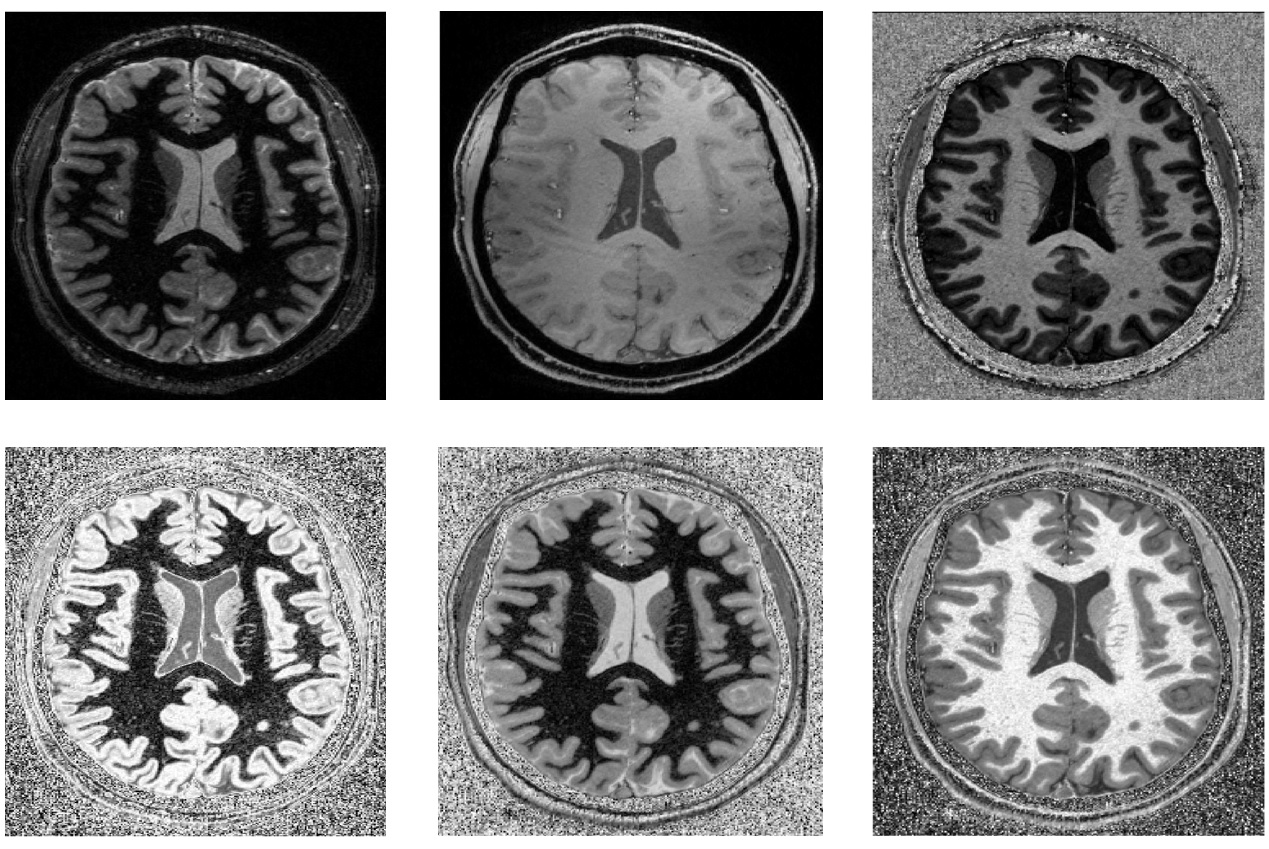
Figure 1 shows the total CNR from the UNI and the INV1 at different TRs and TIs. Each total CNR value represented by a coloured disk is the maximum found over the range of flip angles (FAs) tested. Additional simulations at TR=4500ms which examined more densely sampled TI1 times and FAs are shown with smaller disks. Based on this the TI1/TI2 combination of 650ms/2200ms was chosen for the in vivo scans because it gave the optimal contrast at TR=4000ms and would also be one of the best combinations for the other TRs with its short TI1. At TR=4000ms the optimal parameters were found to be FA1/FA2 = 5°/4°. Moreover, a suboptimal but highly similar parameter set where FA2 was reduced from 4° to 2° was chosen to establish face validity of the simulation results.As demonstrated in Figure 2, the simulations indicated that GM-CSF contrast would be reversed in the UNI image just by modifying FA2 from 4°(cyan dot) to 2°(red dot). Consistent with the simulation results in the UNI image CSF has higher signal than GM for this suboptimal image with FA1/FA2 = 5°/2°. Figure 3 demonstrates the high contrast FLAWS and UNI images with a modest penalty and limited sensitivity to transmit field non-uniformity at TR=4000ms from a representative subject.
Discussion and Conclusion
The FLAWS and UNI MP2RAGE images are normally optimised separately. In this study, EPG simulations were employed to optimise a single MP2RAGE acquisition to obtain FLAWS and UNI MP2RAGE images at 7T while reducing sensitivity to B1+. The optimal parameter sets were applied in healthy subjects resulting in high quality FLAWS and UNI MP2RAGE images even at shorter TRs confirmed by the early segmentation results in SPM (data not shown). The EPG simulations account for the T2 effects, which should improve accuracy at a cost of simulation time. A larger sample size and more detailed analysis are needed to confirm these results and verify which images (FLAWShc, FLAWShco, FLAWSmin and UNI images) provide contrast improvement and confer clinical utility. In conclusion, using the EPG formalism it was possible to systematically design image acquisition for different contrasts within a single scan while minimising the impact of B1+ inhomogeneities at 7T.Acknowledgements
The authors would like to acknowledge Martina F. Callaghan and David Thomas for valuable discussions.
This work was supported by GOSHCC Sparks Grant V4419, King's Health Partners and by core funding from the Wellcome/EPSRC Centre for Medical Engineering [WT203148/Z/16/Z].
References
1) Mugler, JP., Brookeman, J.R., 1990. Three-dimensional magnetization-prepared rapid gradient-echo imaging (3D MPRAGE). Magn. Reson. Med. 15, 152–157.
2) Marques JP, Kober T, Krueger G, van der Zwaag W, Van de Moortele P-F, Gruetter R. MP2RAGE, a self bias-field corrected sequence for improved segmentation and T1-mapping at high field. Neuroimage. 2010;49:1271-1281.
3) Tanner M, Gambarota G, Kober T, et al. Fluid and white matter suppression with the MP2RAGE sequence. J Magn Reson Imaging. 2012;35:1063-1070.
4) Beaumont J, Gambarota G, Saint-Jalmes H, et al. High-resolution multi-T1–weighted contrast and T1 mapping with low B1+ sensitivity using the fluid and white matter suppression (FLAWS) sequence at 7T. Magn Reson Med. 2020;00:1–15. https://doi.org/10.1002/mrm.28517
5) Chen X, Quan T, Kober T, Zhang G, Ren Z, Yu T, Piao Y, Chen N, Li K. Gray-matter-specific MR imaging improves detection of epileptogenic zones in focal cortical dysplasia: A new sequence called fluid and white matter suppression (FLAWS). Neuroimage: Clinical. 2018;20:388-397.
6) Hennig J. Echoes - how to generate, recognize, use or avoid them in MR-imaging sequences. Part I. Concepts Magn Reson 1991;3:125–143.
7) Hennig J. Echoes - how to generate, recognize, use or avoid them in MR-imaging sequences. Part II. Concepts Magn Reson 1991;3:179–192.
8) Weigel M. Extended phase graphs: dephasing, RF pulses, and echoes— pure and simple. J Magn Reson Imaging 2015;41:266–295.
9) Malik S. (2017, August 8). mriphysics/EPG-X: First public version (Version v1.0). Zenodo. http://doi.org/10.5281/zenodo.840023
10) Rooney WD, Johnson G, Li X, Cohen ER, Kim SG, Ugurbil K, Springer Jr, C.S., 2007. Magnetic field and tissue dependencies of human brain longitudinal 1H2O relaxation in vivo. Magn. Reson. Med. 57, 308–318.
11) Yacoub E, Duong TQ, van De Moortele P-F, Lindquist M, Adriany G, Kim S-G, Ugurbil K, Hu X. Spin-echo fMRI in humans using high spatial resolutions and high magnetic fields. Magn. Reson. Med. 2003;49(4):655–664.
12) Li X, Morgan PS, Ashburner J, Smith J, Rorden C. The first step for neuroimaging data analysis: DICOM to NIfTI conversion. J. Neurosci. Methods 2016;264:47-56.
13) Friston KJ, Ashburner J, Kiebel SJ, Nichols TE, Penny WD, editors. Statistical Parametric Mapping: The Analysis of Functional Brain Images. Academic Press, 2007.
Figures