0443
On quantification errors of R2* and PDFF mapping in trabecularized bone marrow induced by the static dephasing regime
Sophia Kronthaler1, Christof Boehm1, Kilian Weiss2, Marcus R. Makowski1, and Dimitrios C. Karampinos1
1Department of Diagnostic and Interventional Radiology, School of Medicine, Technical University of Munich, Munich, Germany, 2Philips Healthcare, Hamburg, Germany
1Department of Diagnostic and Interventional Radiology, School of Medicine, Technical University of Munich, Munich, Germany, 2Philips Healthcare, Hamburg, Germany
Synopsis
Chemical shift encoding-based (CSE) water-fat separation techniques are becoming more common in the study of bone marrow changes as they allow the simultaneous assessment of tissue fat-fraction and R2*. A typical acquisition strategy in CSE-MRI aims to minimize the first TE to increase SNR. However, the R2* decay in the presence of trabecular bone microstructure is known to be nontrivial due to the occurrence of the static dephasing regime. The present work investigates, with the help of UTE acquisitions, the quantification errors of R2* and PDFF maps in trabecularized bone marrow due to the presence of the static dephasing regime.
Introduction/Purpose
Chemical shift encoding-based (CSE) water-fat separation techniques are often used in various clinical settings to assess trabecularized bone quality as well as bone marrow quality. For example, the proton density fat fraction (PDFF) has been proposed as a biomarker for bone marrow fat content changes associated with bone matrix loss1,2. Further, it was previously shown that R2* measurements of the vertebra correlated with the bone mineral density3 and R2* was shown to be a biomarker for bone loss in osteoporosis4-6. As bone tissue is more diamagnetic than bone marrow, local field inhomogeneities are induced which reduce the transverse relaxation time7,8.To enable CSE-MRI multiple echoes have to be acquired at different TEs with an optimal echo spacing specifically tuned to the underlying water-fat model. A typical acquisition strategy aims to minimize the minimum TE to increase available SNR. However, the R2* decay in the presence of microstructure is known to be nontrivial. The signal follows a gaussian decay at short TEs (static dephasing regime) and an exponential decay at longer TEs (diffusion narrowing regime)9-12, as depicted in Figure 1. The characteristic echo time, that differentiates between the two regimes, is of the order of the shortest achievable echo times that are commonly used at clinical CSE-MRI setups. The purpose of this work was to investigate, with the help of UTE acquisitions, the quantification errors of R2* and PDFF maps in trabecularized bone regions due to the presence of the static dephasing regime.Methods
Cartesian multi-echo gradient-echo acquisitionScanning was performed on a 3T scanner (Ingenia, Philips Healthcare, Release 5.4, Best, The Netherlands) using a monopolar time-interleaved multi-echo gradient echo sequence13. A sagittal scan was acquired of the thoracolumbar spine of a patient diagnosed with prostate cancer and mainly osteoblastic bone metastases. Scan parameters were: 6 echoes with 3 echoes per interleave, TEmin=1.12ms, dTE=0.96ms, readout direction=anterior-posterior, FOV=219.6x219.6x79.2mm3 and an isotropic voxel size of 1.8x1.8x1.8mm3.
multi-TE UTE acquisition
A sagittal 3D-UTE relaxometry measurement of the ankle of a healthy volunteer was performed with a stack-of-stars center-out-radial acquisition12. Scan parameters were: TEs=[0.19 1.29 2.39 3.49 4.59 5.69 6.79]ms. orientation=sagittal, FA=5°, FOV=220x220x90mm3, SENSE R=2, voxel size=1.2x1.2x3mm3, TR=3.4 scan time=9.2min.
Additionally, a Cartesian high-resolution balanced-SSFP reference scan was acquired with 2 phase cycles, TE=2.6ms and voxel size=0.3x0.3x1.5mm3.
Chemical shift encoding-based water-fat separation
Water–fat maps for both multi-TE acquisitions were calculated using complex chemical shift encoding-based water-fat separation, assuming a common T2* for water and fat and a multi-peak fat model, tuned specifically to bone marrow14,15.
Results
Figure 2 shows 7 TEs acquired with a UTE acquisition and the resulting R2* maps including all TEs and including only the 5 later TEs (TE > 2.4ms). In regions with higher trabecular bone density, the difference maps showed higher quantification errors on PDFF and R2*.Figure 3 depicts the corresponding signal decay curves of the maps shown in Figure 2. In regions with low trabecular bone density, the fitted signal curve did not deviate significantly when shorter TEs were excluded from the processing. In regions with higher trabecular bone density, the measured signal was lower than the extrapolated signal from later TEs.
Figure 4 shows the spine of a patient with mainly osteoblastic bone metastases indicated by reduced fat fraction and elevated R2*-values. Especially in regions with a high trabecularization (T12 and L2) the signal at the first TE deviated from the fitting curve based on the later TEs.
Figure 5 summarizes the findings showed in Figure 2-4. In areas with higher trabecularization (ROI 2 in calcaneus, T12 and L2 in spine data) the resulting R2* was always larger when using only the later TEs compared to using all TEs. In the PDFF maps mostly higher values were observed with the modeling based on 5 TEs.
Discussion & Conclusion
R2* and PDFF bias increases in regions with higher trabecular bone density. Therefore, R2* is underestimated when using short minimum echo times in regions with high bone density. Such a finding in principle contradicts the expected behavior that at short TEs bone matrix signal becomes more significant and makes R2* longer. The present work based on UTE imaging measurements shows that the above behavior can be explained due to the occurrence of the static dephasing regime. When decreasing the minimum TE, the PDFF quantification errors were in general smaller than the R2* quantification errors. In conclusion, the occurrence of the static dephasing regime induces an R2* underestimation in trabecularized bone marrow regions when using chemical shift encoding-based water fat separation with a short minimum TE. If a TE larger than 2ms is used at 3T, we did not observe quantification errors, but if smaller TEs were used the static dephasing regime effect should be considered.Acknowledgements
The present work was supported by the European Research Council (grant agreement No 677661, ProFatMRI). This work reflects only the authors view and the EU is not responsible for any use that may be made of the information it contains. The authors also acknowledge research support from DAAD (Project number: 57514573) and Philips Healthcare.References
- Griffith JF, Yeung DK, Antonio GE, Lee FK, Hong AW, Wong SY, Lau EM, Leung PC. Vertebral bone mineral density, marrow perfusion, and fat content in healthy men and men with osteoporosis: dynamic contrast-enhanced MR imaging and MR spectroscopy. Radiology 2005;236(3):945-951.
- Karampinos DC, Ruschke S, Dieckmeyer M, Diefenbach M, Franz D, Gersing AS, Krug R, Baum T. Quantitative MRI and spectroscopy of bone marrow. J Magn Reson Imaging 2018;47(2):332-353.
- Gao Y, Wang O, Guan W, Wu X, Mao J, Wang X, Yu W, Nie M. Bone mineral density and trabecular bone score in patients with 21-hydroxylase deficiency after glucocorticoid treatment. Clin Endocrinol (Oxf) 2020.
- Kuhn JP, Hernando D, Meffert PJ, Reeder S, Hosten N, Laqua R, Steveling A, Ender S, Schroder H, Pillich DT. Proton-density fat fraction and simultaneous R2* estimation as an MRI tool for assessment of osteoporosis. Eur Radiol 2013;23(12):3432-3439.
- Majumdar S, Thomasson D, Shimakawa A, Genant HK. Quantitation of the susceptibility difference between trabecular bone and bone marrow: experimental studies. Magn Reson Med 1991;22(1):111-127.
- Wehrli FW, Ford JC, Attie M, Kressel HY, Kaplan FS. Trabecular structure: preliminary application of MR interferometry. Radiology 1991;179(3):615-621.
- Wehrli FW, Song HK, Saha PK, Wright AC. Quantitative MRI for the assessment of bone structure and function. NMR Biomed 2006;19(7):731-764.
- Wu HZ, Zhang XF, Han SM, Cao L, Wen JX, Wu WJ, Gao BL. Correlation of bone mineral density with MRI T2* values in quantitative analysis of lumbar osteoporosis. Arch Osteoporos 2020;15(1):18.
- Yablonskiy DA. Quantitation of intrinsic magnetic susceptibility-related effects in a tissue matrix. Phantom study. Magn Reson Med 1998;39(3):417-428.
- Yablonskiy DA, Haacke EM. Theory of NMR signal behavior in magnetically inhomogeneous tissues: the static dephasing regime. Magn Reson Med 1994;32(6):749-763.
- Storey P, Novikov DS. Signatures of microstructure in R2* decay: defining the limits of the weak field approximation. In Proceedings of the 28th Scientific Meeting of ISMRM, Virtual Conference, Abstract 3102 2020.
- Kronthaler S, Boehm C, Weidlich D, Diefenbach MN, Karampinos DC. Simultaneous imaging of trabecular and cortical bone by analyzing the multi-echo signal decay at UTEs and conventional TEs. In Proceedings of the 28th Scientific Meeting of ISMRM, Virtual Conference, Abstract 2767 2020.
- Ruschke S, Eggers H, Kooijman H, Diefenbach MN, Baum T, Haase A, Rummeny EJ, Hu HH, Karampinos DC. Correction of phase errors in quantitative water-fat imaging using a monopolar time-interleaved multi-echo gradient echo sequence. Magn Reson Med 2017;78(3):984-996.
- Diefenbach MN, Liu C, Karampinos DC. Generalized parameter estimation in multi-echo gradient-echo-based chemical species separation. Quant Imaging Med Surg 2020;10(3):554-567.
- Ren J, Dimitrov I, Sherry AD, Malloy CR. Composition of adipose tissue and marrow fat in humans by 1H NMR at 7 Tesla. J Lipid Res 2008;49(9):2055-2062.
- Boutry N, Cortet B, Dubois P, Marchandise X, Cotten A. Trabecular bone structure of the calcaneus: preliminary in vivo MR imaging assessment in men with osteoporosis. Radiology 2003;227(3):708-717.
Figures
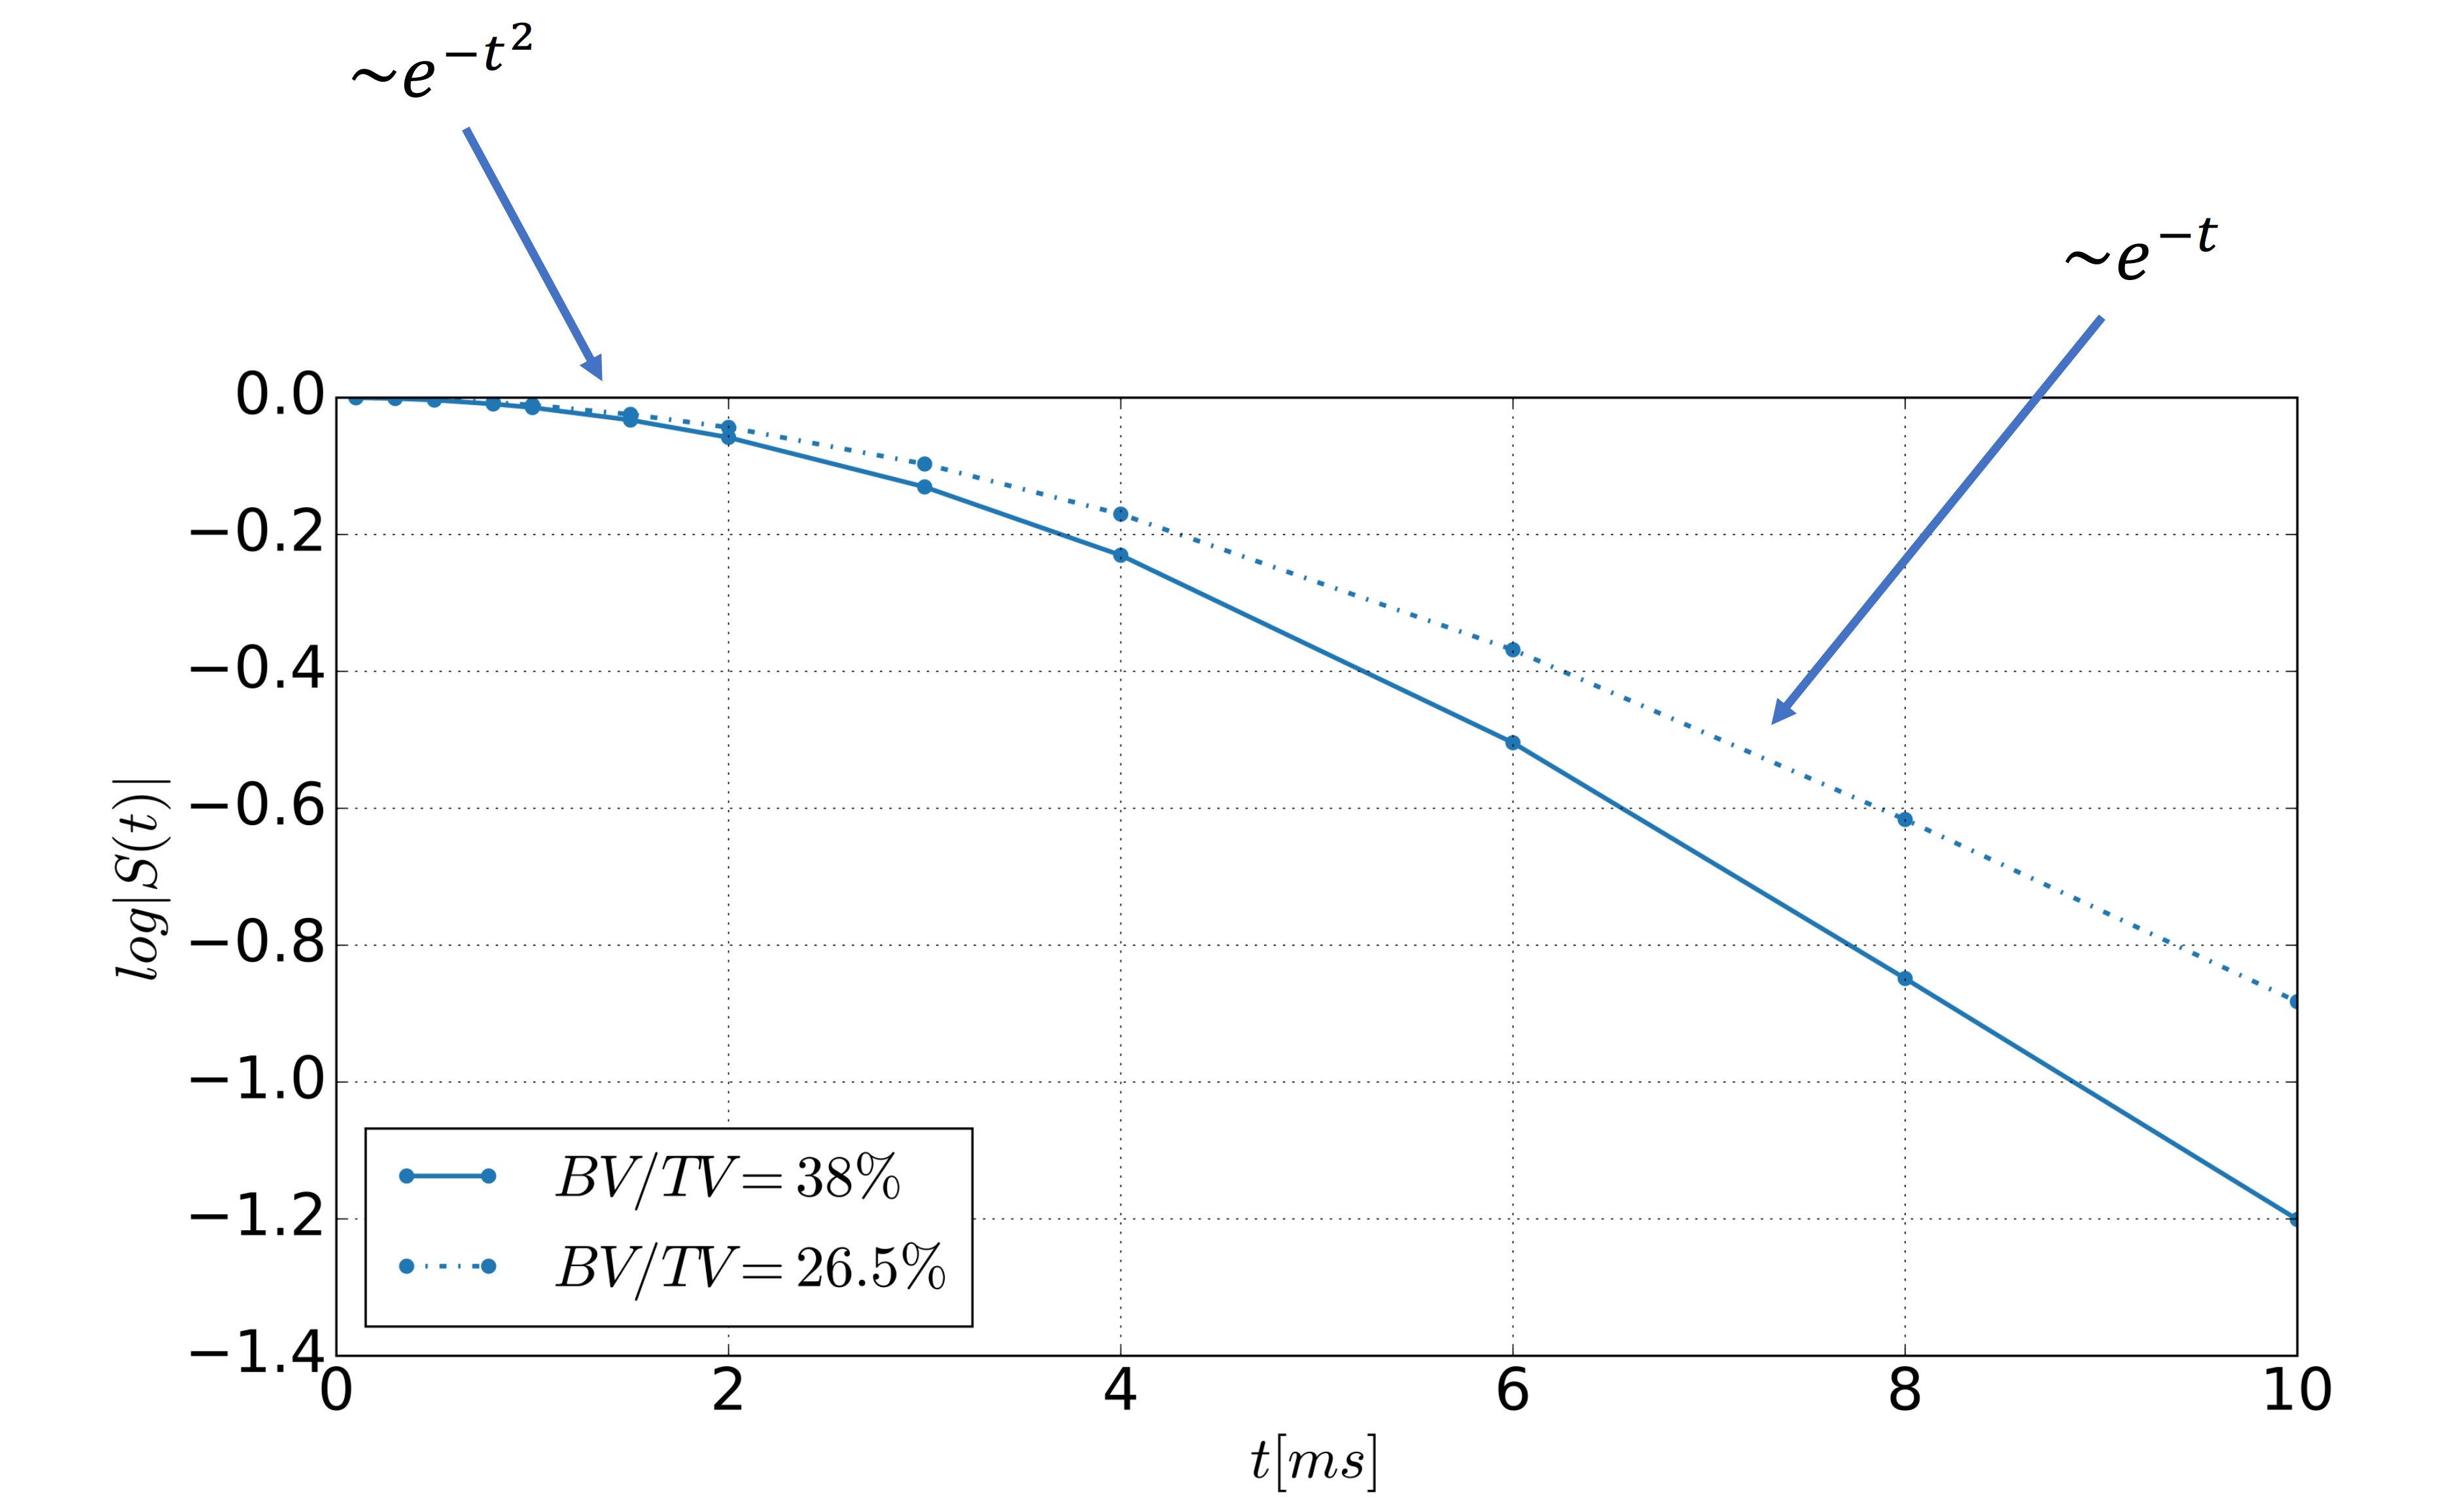
Figure 1: Illustration of the signal decay in the presence of magnetic microstructure. The shown curves are the results from bone cube simulations for two cases with different bone volume to total volume (BV/TV)12. The semilogarithmic plot depicts the quadratic signal decay for short echo times and the asymptotically linear signal decay for longer echo times. The characteristic echo time, that differentiates between the static and the diffusion regime, was dependent on the BV/TV.
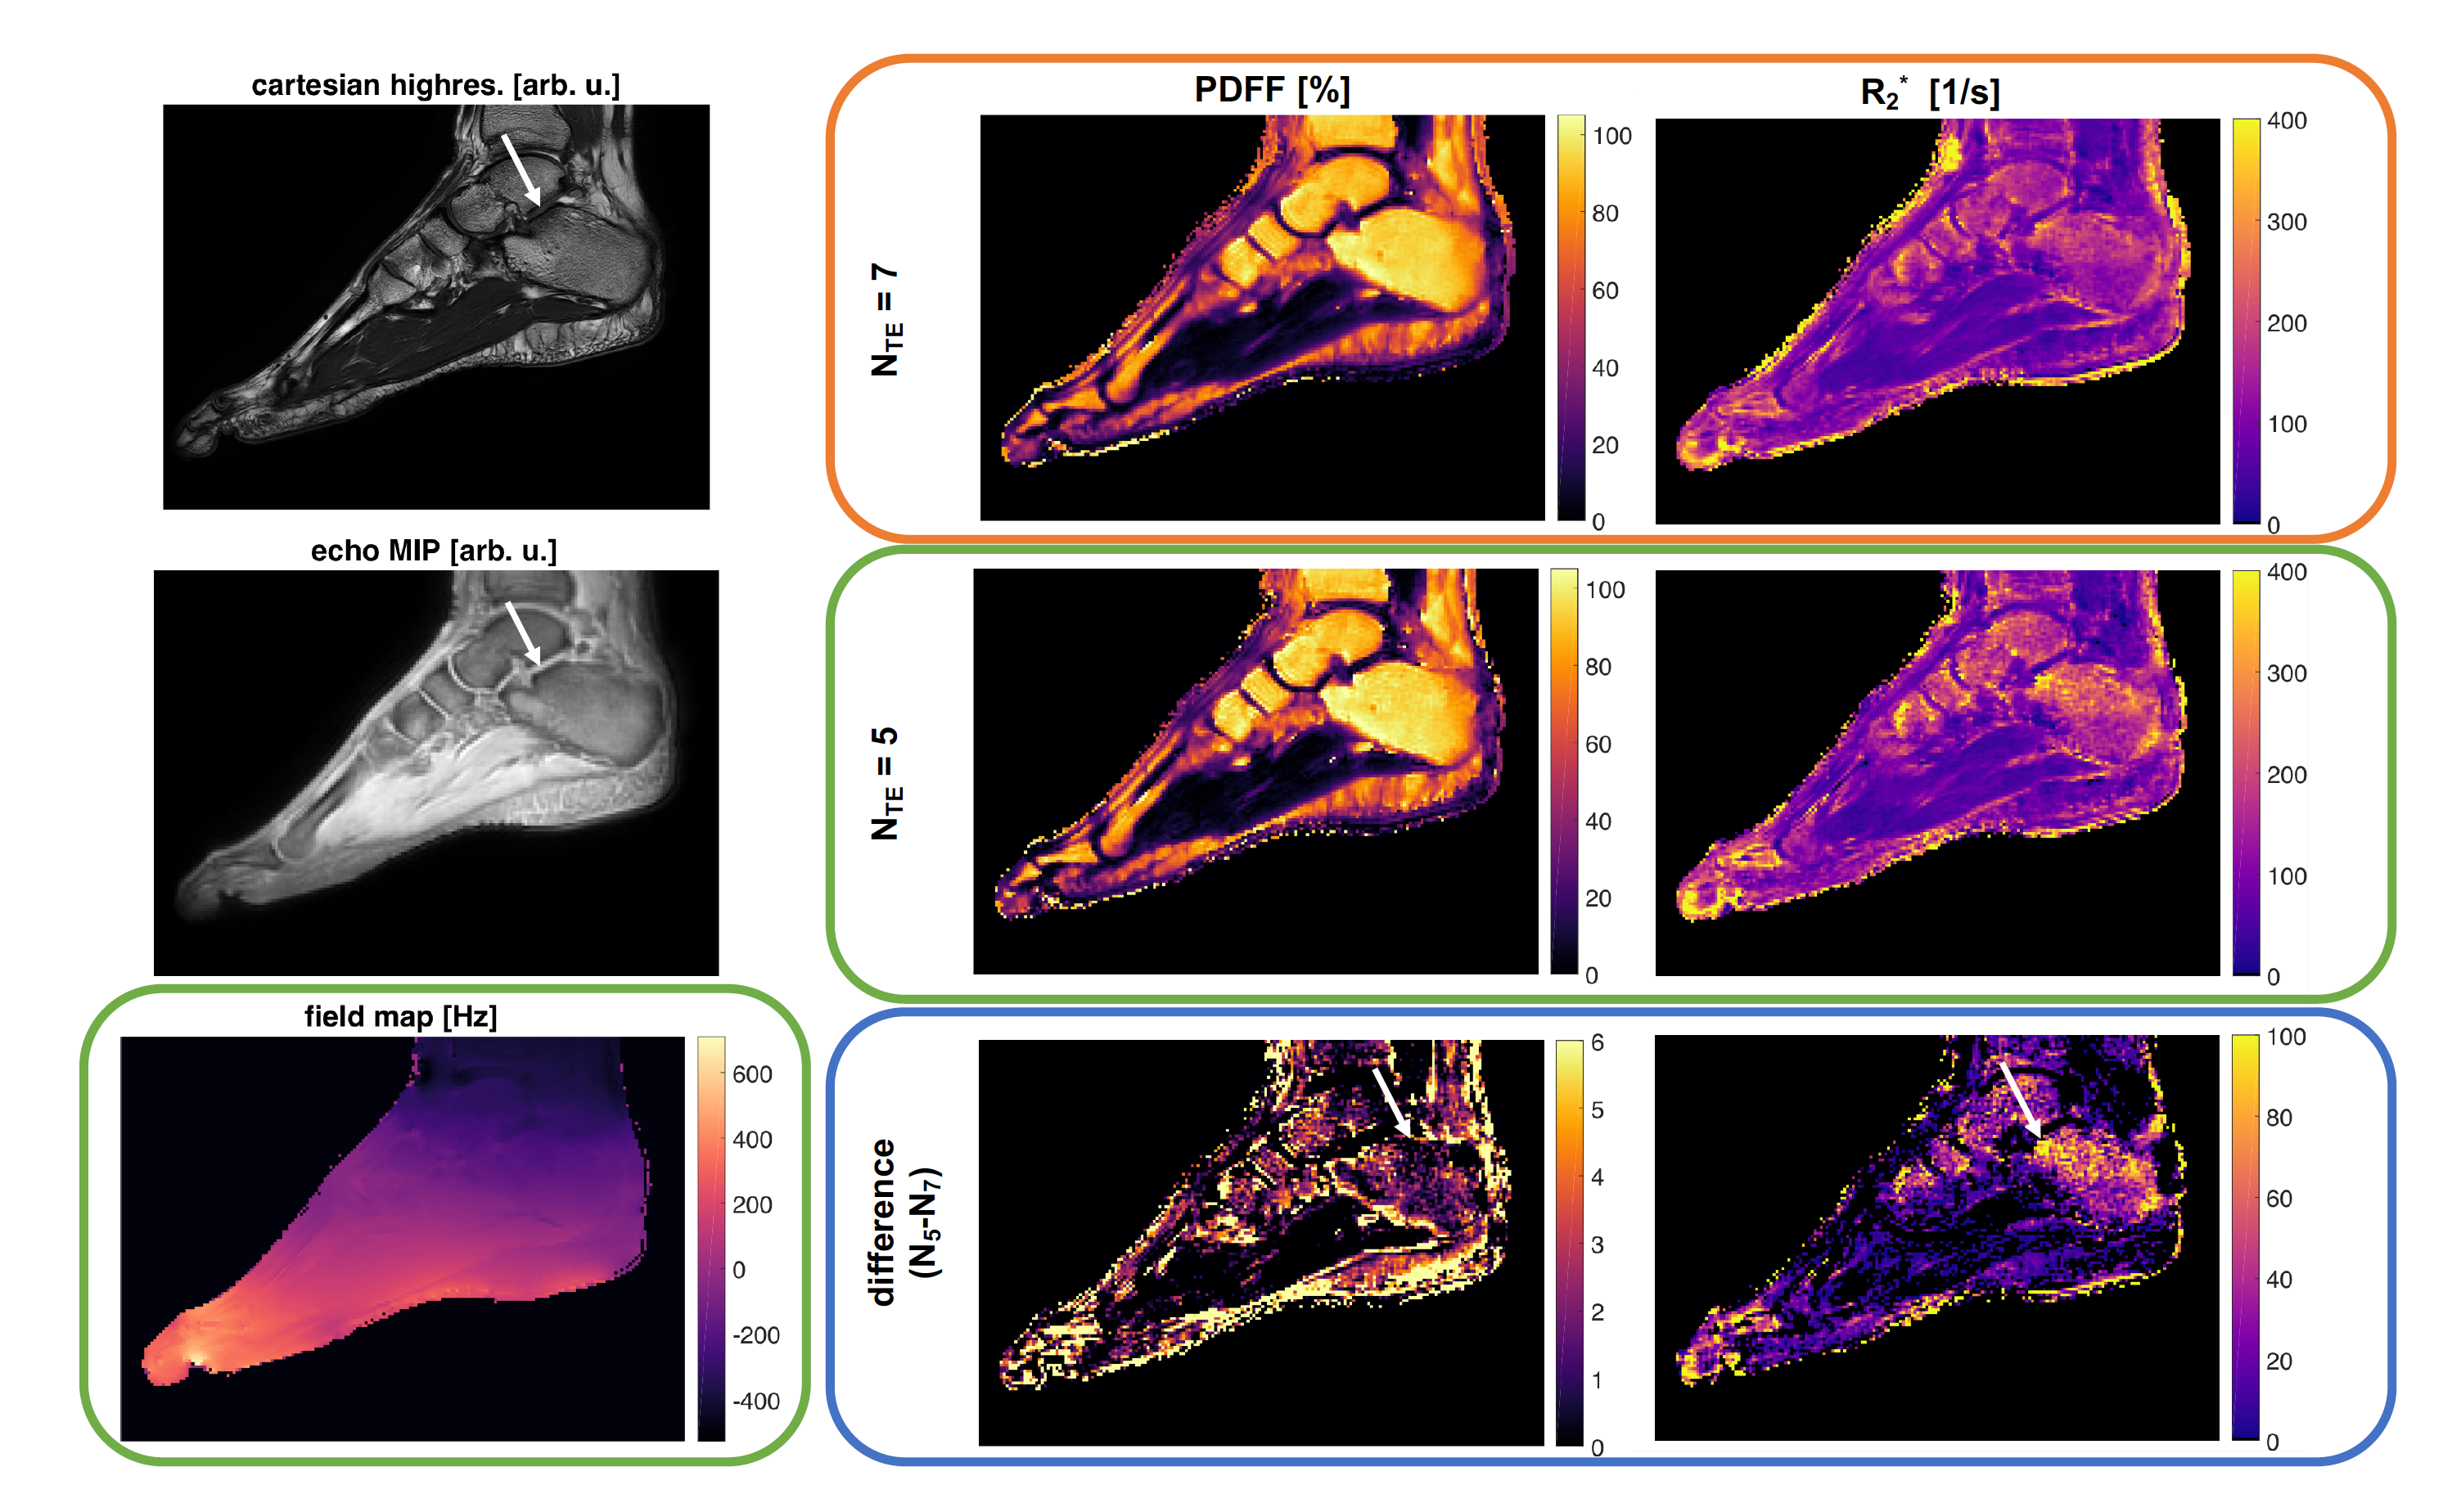
Figure 2: Upper left shows a Cartesian high resolution bFFE scan of the ankle in a healthy volunteer to visualize trabecularization of the bone. The remaining images originate from a 3D UTE stack-of-stars acquisition (middle left) processed with all available 7 TEs (orange block) and with the later 5 TEs (green block). In both cases the field map obtained from the 5TEs (lower left) was used for the initialization. The difference maps (blue block) showed higher PDFF and higher R2* values for regions with higher bone densities (indicated with white arrow).
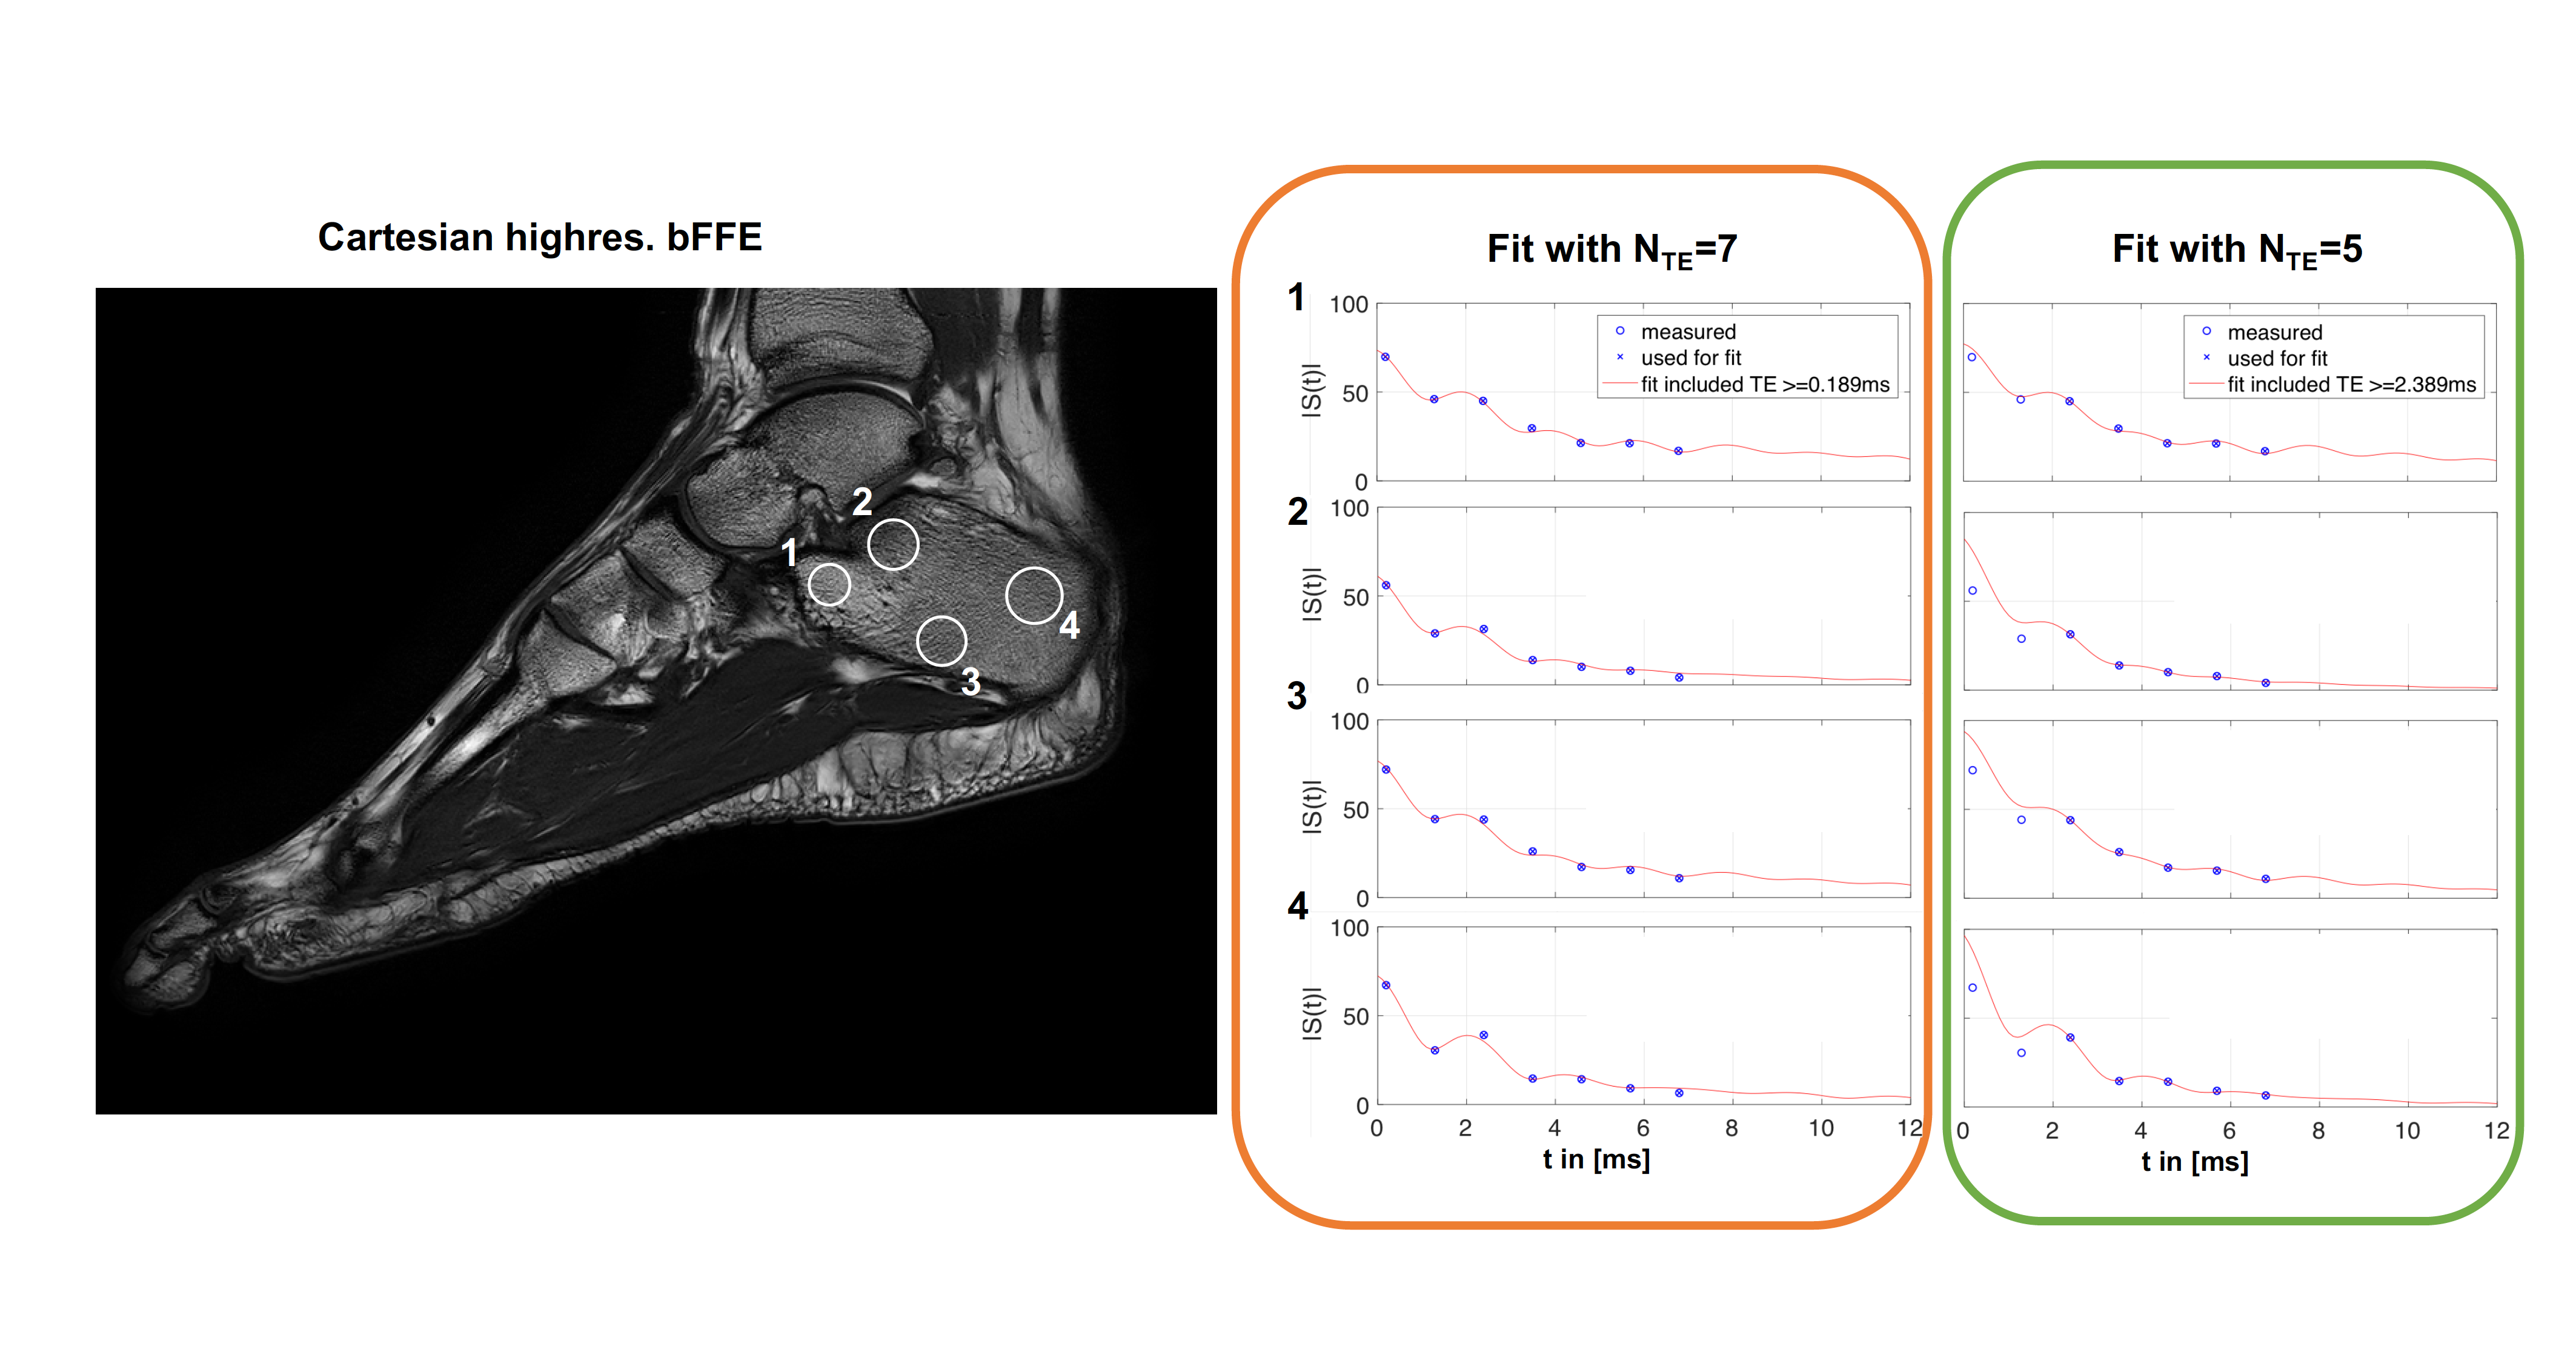
Figure 3: Signal decay for selected regions of the calcaneus (left). Middle column (red) shows the signal fitted with all TEs, the right column shows the fitting with the later 5 TEs (green). The cavum calcanei (ROI 1) has a high fat content16 and minor differences using different TE regimes were visible. In regions with high trabecularization (T12, L2) signal deviations at the first TE compared to the fitted curve based on later TEs were observed. In the tuber calcanei (ROI 3-4), characterized by lower fat content but also less trabecularized bone, the signal deviation was still visible.
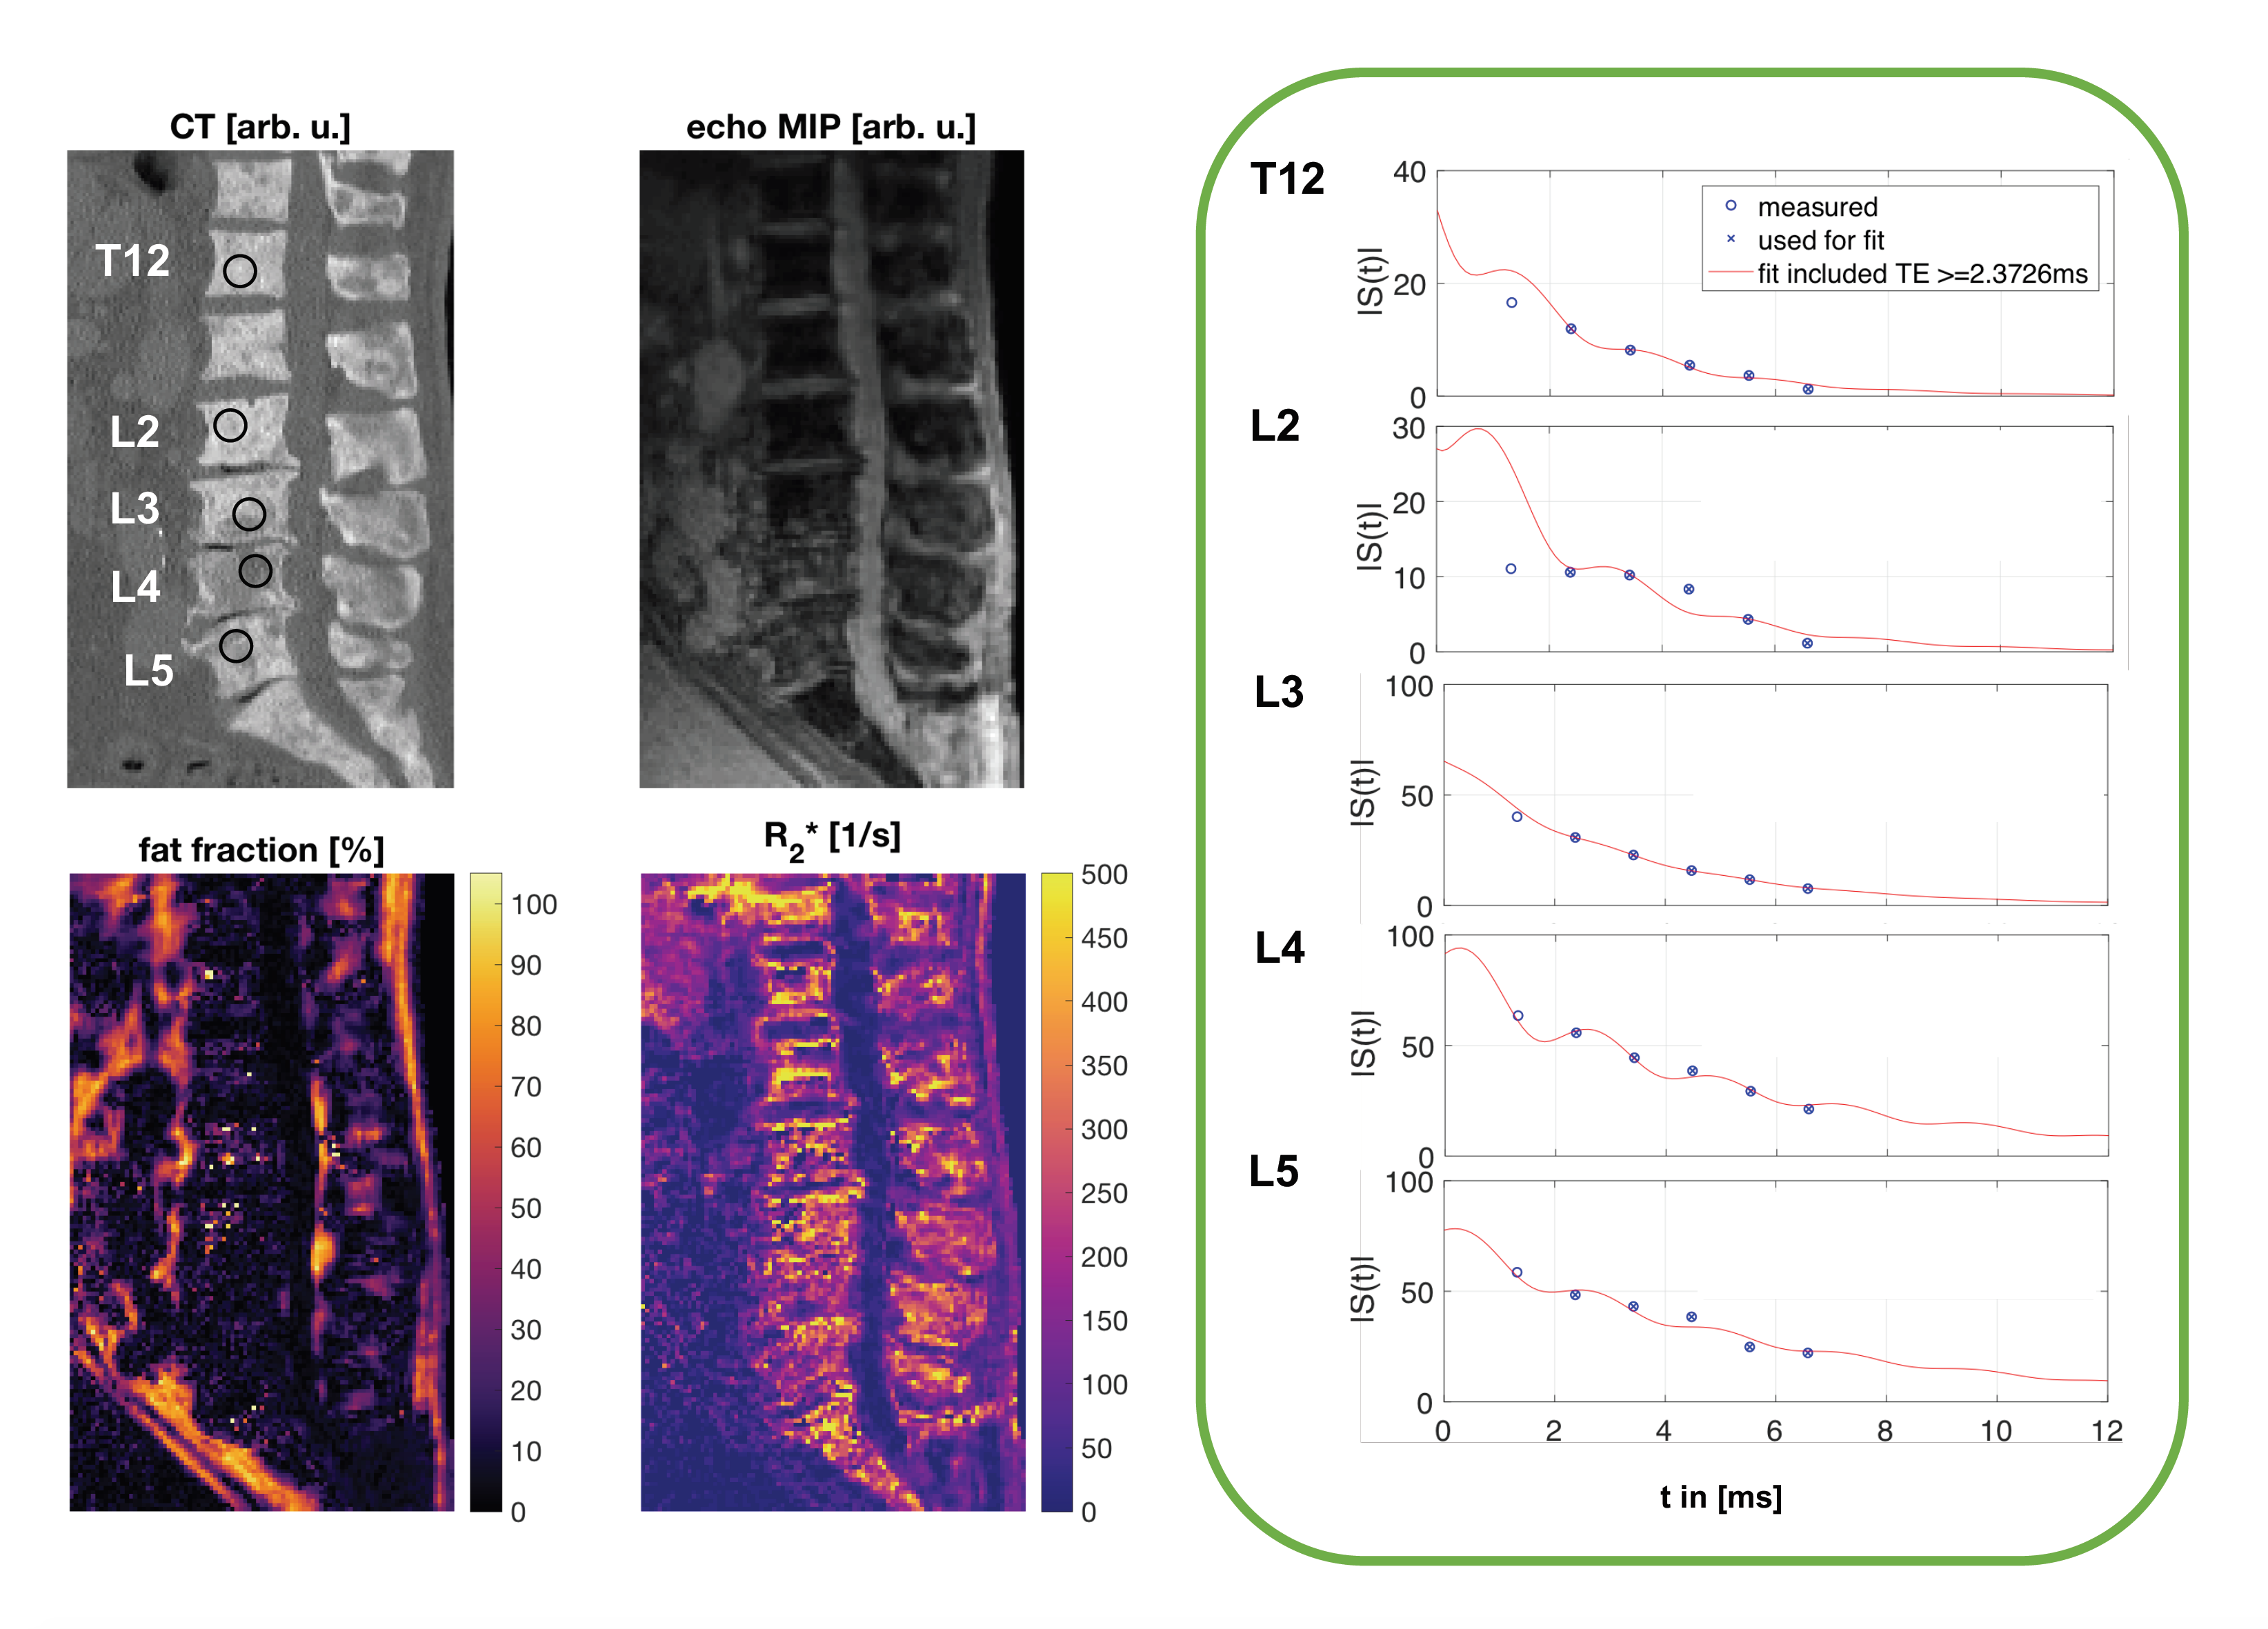
Figure 4: CT and Cartesian Dixon MR images of the thoracolumbar spine of a patient with mainly osteoblastic bone metastases. The fat fraction and the R2* map indicate pathological changes by showing significantly reduced fat fraction and elevated R2*-values, respectively. In the right column signal decay curves for regions within specific vertebras are shown. Regions with high trabecularization (T12 and L2) show strong deviations of the signal at the first TE compared to the fitting curve based on later TEs.
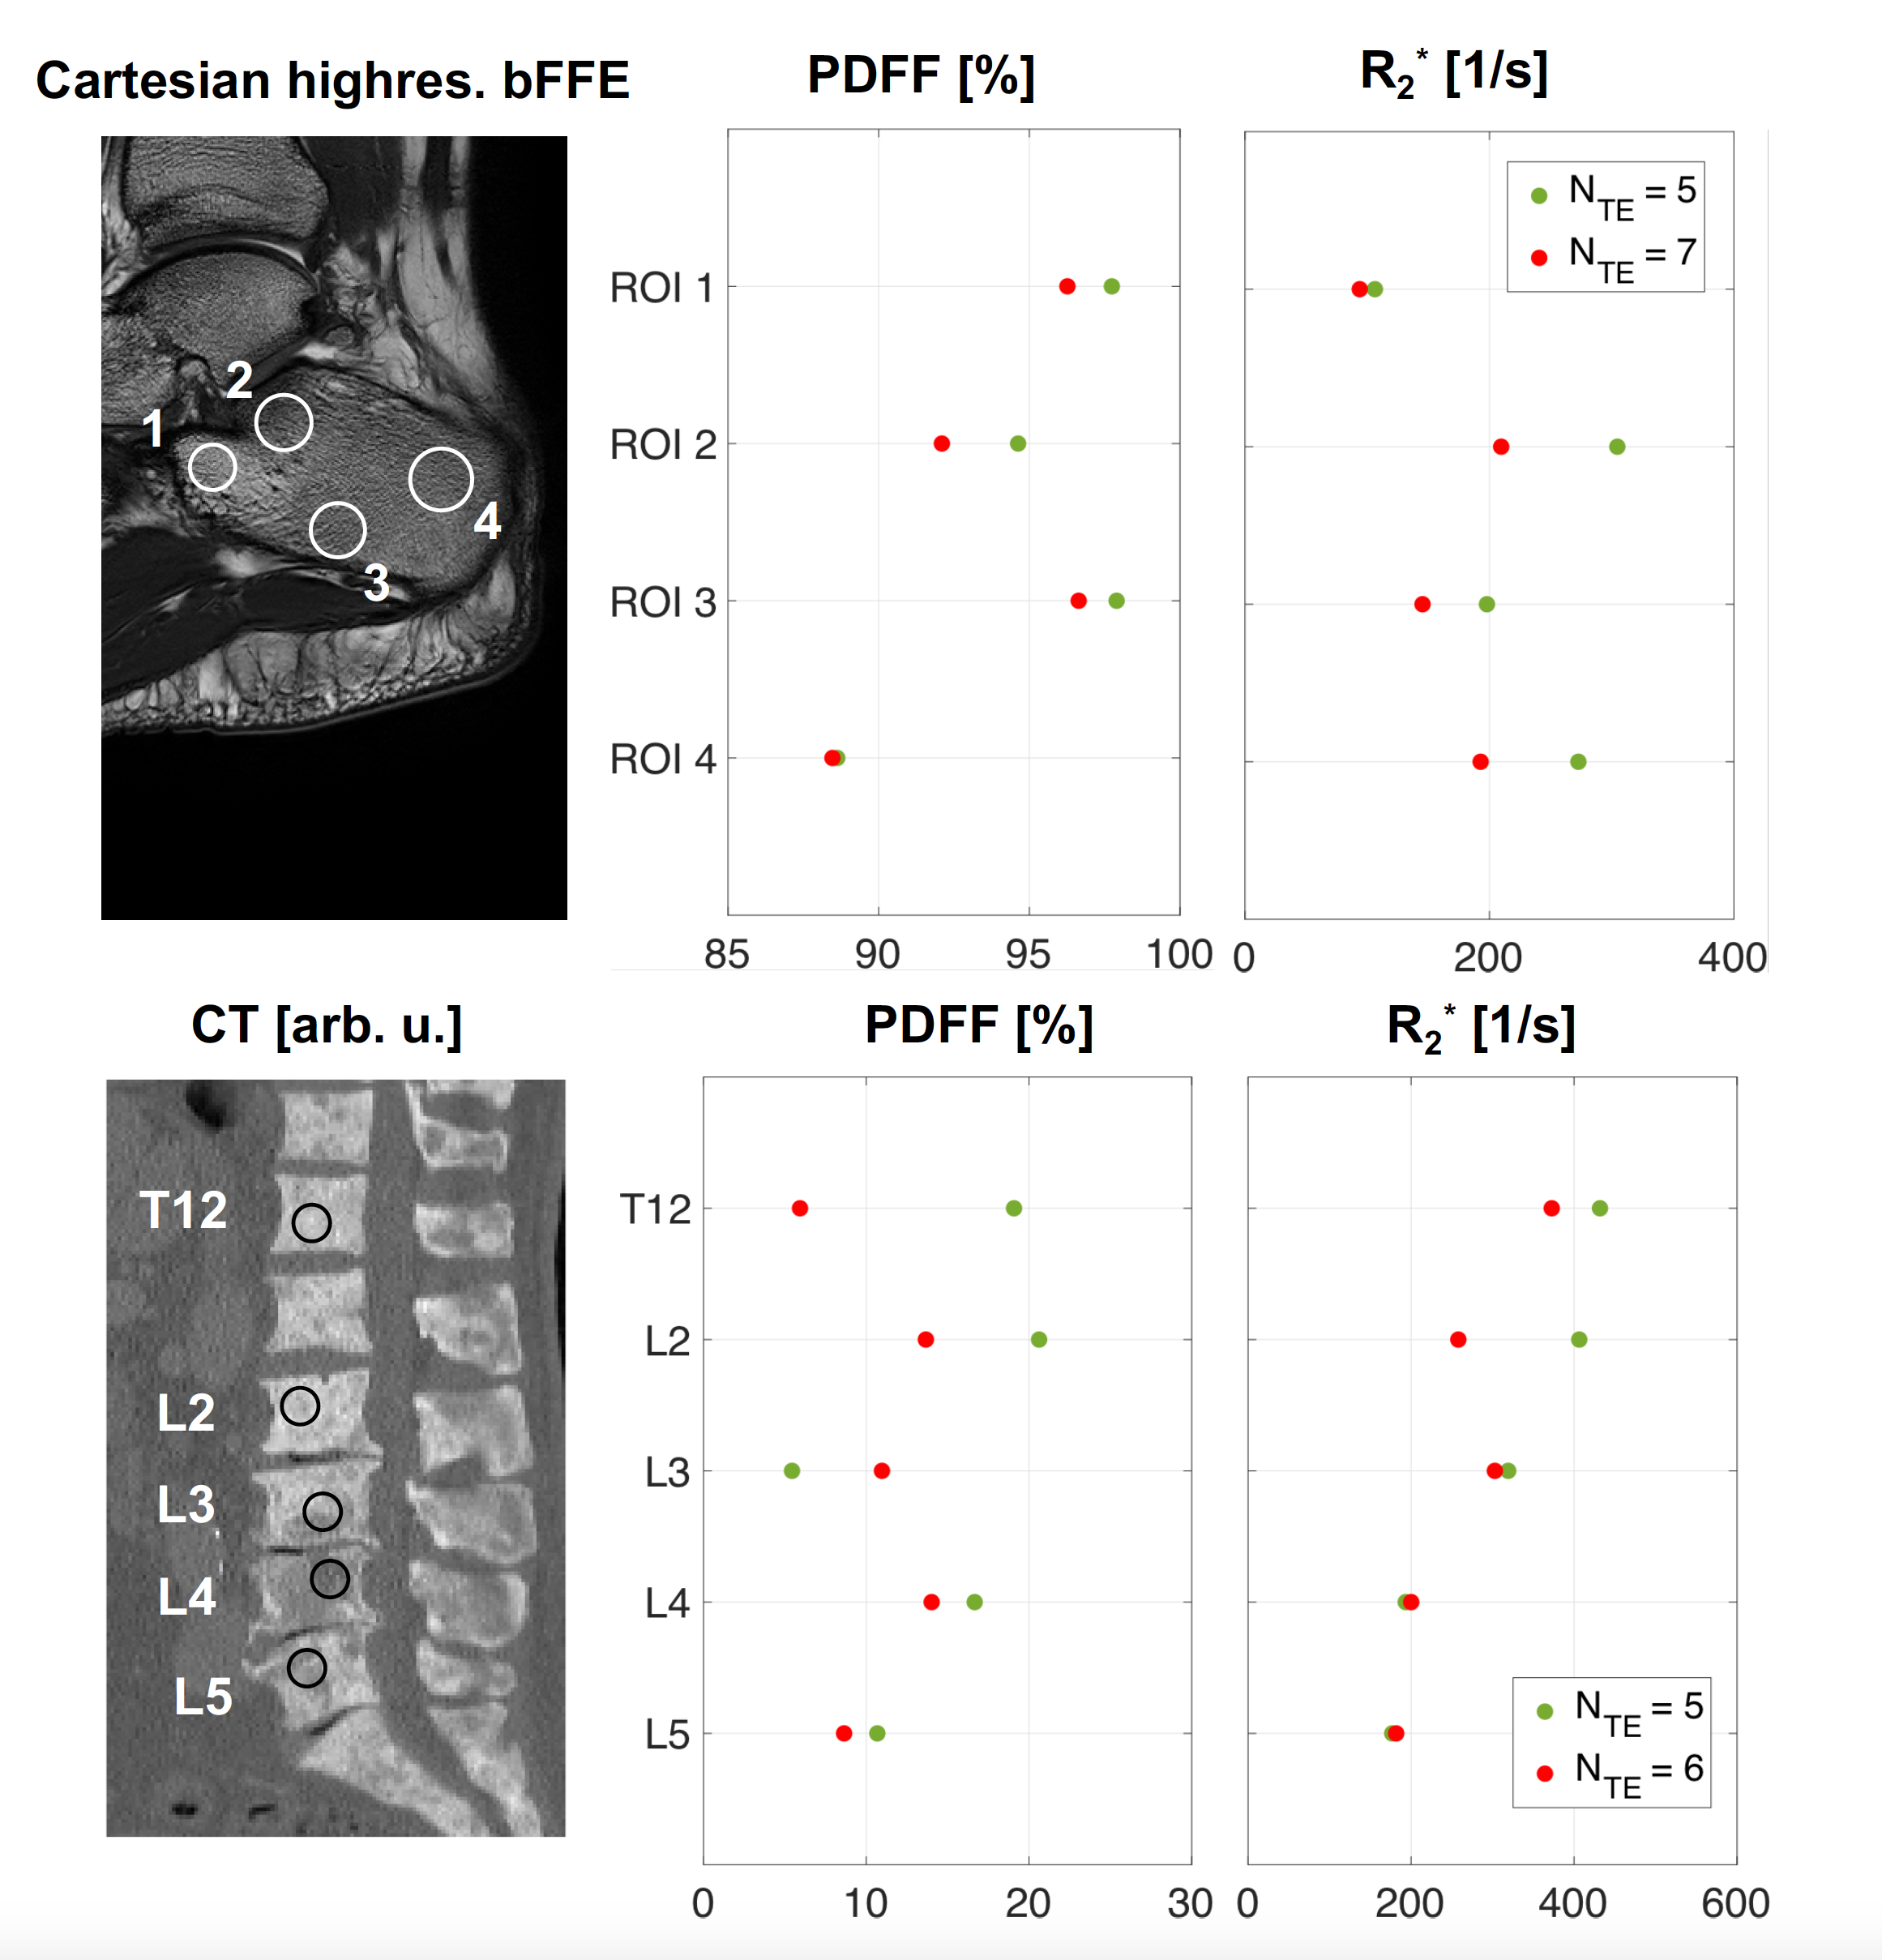
Figure 5: Summary of the ROI analysis in a healthy calcaneus (upper row) and the spine of a patient (bottom row). Mean PDFF values (middle column) and mean R2* values (right column) are shown. Data originating from the fit with all TEs are depicted in orange whereas the green dots depict the fit with the later 5 TEs. In areas with higher trabecularization (ROI 2 in calcaneus, T12 and L2 in spine), the R2* was always larger when using only the later TEs compared to all TEs. In the PDFF maps mostly higher values were observed when the modeling only included the later 5 TEs.