0435
CEST MRI of temporal changes of hematoma in Intracerebral Hemorrhage (ICH) mouse at 3T
Joseph H. C. Lai1, Jiaxin Liu2, Jianpan Huang1, Yang Liu1, Zilin Chen1, Peng Xiao1, Gilberto K. K. Leung2, and Kannie W. Y. Chan1,3,4
1Department of Biomedical Engineering, City University of Hong Kong, Hong Kong, Hong Kong, 2Division of Neurosurgery, Department of Surgery, Li Ka Shing Faculty of Medicine, The University of Hong Kong, Hong Kong, Hong Kong, 3Russell H. Morgan Department of Radiology and Radiological Science, Johns Hopkins University School of Medicine, Baltimore, MD, United States, 4City University of Hong Kong Shenzhen Research Institute, Shenzhen, China
1Department of Biomedical Engineering, City University of Hong Kong, Hong Kong, Hong Kong, 2Division of Neurosurgery, Department of Surgery, Li Ka Shing Faculty of Medicine, The University of Hong Kong, Hong Kong, Hong Kong, 3Russell H. Morgan Department of Radiology and Radiological Science, Johns Hopkins University School of Medicine, Baltimore, MD, United States, 4City University of Hong Kong Shenzhen Research Institute, Shenzhen, China
Synopsis
CEST MRI in hematoma could be challenging depending on the involvement of iron. This study examined the feasibility of CEST in monitoring ICH and its progression over two weeks. The AREX data supported that the iron-overloading pathology might not significantly attenuate CEST contrast as demonstrated both in vitro and in vivo at 3T. We observed the most significant decrease in rNOE (37%) and APT (47%) contrast in lesions were on day7 and day3, respectively, when compared to contralateral side. This could indicate neuropathologies related to lipid and amide, which could be valuable for ICH diagnosis and treatment planning at 3T.
Introduction
ICH, which is caused by the rupture of blood vessels in brain, is a devastating subtype of stroke.1 The ICH treatment remains challenging because of limited approaches to detect pathophysiological changes in brain.2 Monitoring the molecular changes in hematoma and its progression could provide essential information for diagnosis and therapy. CEST has been applied to study ischemic stroke, in particular to image the pH and to identify penumbra.3-5 ICH is a different animal model. A study has compared the APT signal between ischemic and hemorrhagic stroke.6 Yet, the underlying molecular changes remain to be identified. In this study, CEST was used to monitor the pathophysiological changes of an ICH mouse model over two weeks. Changes of APT and rNOE contrast were studied during hematoma progression. Since iron overload has been reported as a pathology of ICH,7 the CEST contrast might be affected in the presence of iron at 11.7T.8 Therefore, we also studied a set of iron-containing phantom to determine the iron level that will not attenuate the CEST contrast.Methods
Five male C57BL/6 mice (8 weeks, Jackson Laboratory) were acquired for the experiment. ICH induction procedures were modified from a reported protocol.9 0.3uL collagenase (Type IV-S, Sigma) was injected to 0.2mm anterior, 2mm lateral from the right, and 3.5mm below the bregma at a rate of 0.15uL/min under anesthetized by 2% isoflurane. The mice were scanned before, 1 day, 3 days, 7 days, and 14 days after ICH induction with a horizontal bore 3T Bruker BioSpec animal scanner (Bruker, Germany), equipped with 40-mm volume transceiver coil for data acquisition. Single slice CEST, T1 map and T2 map were acquired. An in-house developed continuous-wave (CW) CEST sequence was used.10 The imaging parameters were as follows: TR = 6000ms; TE = 6ms; FOV = 20×20mm; matrix = 96×96; thickness = 1.5mm; RARE factor = 32; B1 = 0.8μT and saturation time (tsat) = 3s. Frequency offsets of the Z-spectrum included ±15ppm, ±10ppm, ±9ppm, and distributed between ±8ppm with 0.25ppm step size. Four S0 images at 200ppm were also acquired for data processing. For T1 map, it was acquired using the built-in RARE sequence. For T2 map, it was acquired using the built-in multi-slice multi echo (MSME) sequence.A set of bovine serum albumin (BSA) phantom was designed to study the iron effect to CEST. 8 different concentrations of ferrous iron (Iron(II) sulfate heptahydrate, Sigma) were added to 10% BSA (Sigma). The phantom was scanned with the same sequences as the animal study.
All data were analyzed with a custom-written Matlab (R2018b; MathWorks) code. The APT and rNOE signal at 3.5ppm and -3.5ppm, respectively, were acquired by subtracting the Z-spectrum with the Lorentzian-fitted water signal. AREX signal was acquired by following a published method to correct the T1 relaxation effect.11,12
Results and Discussion
In order to study the paramagnetic iron effect to CEST, a phantom set was designed. From Figure 1A, we could see that the iron change was inversely proportional to both T1 and T2 values. Iron also had a suppression effect to CEST (Fig. 1B), which resembled the T2 changes. However, the change was insignificant at low iron content difference (below 1.25mM for rNOE and 2.5mM for APT). It has been reported that the hematomal iron raised about 0.4mM on day 3 and maximized at around 1.1mM on later time points.13 Since the change is within an acceptable range, both rNOE and APT should be able to give resonable sensitivity in ICH monitoring.Figure 2 showed the result of a representative mouse brain at specific time points. A hematoma could be seen on the caudate putamen after ICH induction. The rNOE signal of the hematoma dropped gradually with time as compare with the contralateral brain (Fig. 3A). The signal dropped around 17% on day 1 and reached a minimum on day 7, with around 37% difference. The signal loss in hematoma on day 14 was comparable with day 7.
The APT (Fig. 3B) had similar trend, where the hematomal signal decreased on day 1 and reached a minimum on day 3, with 30% and 47% reduction, respectively, as compare with contralateral brain. After that, the signal slightly raised till day 14. APT correlated with the pH 14 and amide proton signal.15 It is interesting to observe different trend in rNOE and APT over time in hematoma. Immunohistological study is underway to investigate the dominating contribution behind.
Conclusion
CEST has been applied to monitor the temporal changes of an ICH brain and revealed the underlying molecular changes of the hematoma. The significant drop of rNOE and APT contrast could indicate the underlying mechanism, which further investigation is underway including histology. According to our phantom and T2 maps, the iron content in the hematoma might not presence at a high level, which will not attenuate the CEST contrast at 3T.Acknowledgements
We are grateful to receive funding support from the Research Grants Council of Hong Kong [11102218], the City University of Hong Kong [7005210, 9680247, 9667198 and 6000660], and the National Natural Science Foundation of China [81871409].References
- Zhu W, Gao Y, Chang CF, Wan JR, Zhu SS, Wang J. Mouse models of intracerebral hemorrhage in ventricle, cortex, and hippocampus by injections of autologous blood or collagenase. PLoS One 2014;9:1–11 doi: 10.1371/journal.pone.0097423.
- Righy C, T. Bozza M, F. Oliveira M, A. Bozza F. Molecular, Cellular and Clinical Aspects of Intracerebral Hemorrhage: Are the Enemies Within? Curr. Neuropharmacol. 2015;14:392–402 doi: 10.2174/1570159x14666151230110058.
- Sun PZ, Zhou J, Sun W, Huang J, Zijl PCM Van. Detection of the ischemic penumbra using pH-weighted MRI. 2007:1129–1136 doi: 10.1038/sj.jcbfm.9600424.
- Zhao X, Wen Z, Huang F, et al. Saturation power dependence of amide proton transfer image contrasts in human brain tumors and strokes at 3 T. Magn. Reson. Med. 2011;66:1033–1041 doi: 10.1002/mrm.22891.
- Sun PZ, Murata Y, Lu J, Wang X, Lo EH, Sorensen AG. Relaxation-compensated fast multislice amide proton transfer (APT) imaging of acute ischemic stroke. Magn. Reson. Med. 2008;59:1175–1182 doi: 10.1002/mrm.21591.
- Wang M, Hong X, Chang CF, et al. Simultaneous detection and separation of hyperacute intracerebral hemorrhage and cerebral ischemia using amide proton transfer MRI. Magn. Reson. Med. 2015;74:42–50 doi: 10.1002/mrm.25690.
- Xiong XY, Wang J, Qian ZM, Yang QW. Iron and Intracerebral Hemorrhage: From Mechanism to Translation. Transl. Stroke Res. 2014;5:429–441 doi: 10.1007/s12975-013-0317-7.
- Gilad AA, Van Laarhoven HWM, Mcmahon MT, et al. Feasibility of concurrent dual contrast enhancement using CEST contrast agents and superparamagnetic iron oxide particles. Magn. Reson. Med. 2009;61:970–974 doi: 10.1002/mrm.21928.
- Li M, Li Z, Ren H, et al. Colony stimulating factor 1 receptor inhibition eliminates microglia and attenuates brain injury after intracerebral hemorrhage. J. Cereb. Blood Flow Metab. 2017;37:2383–2395 doi: 10.1177/0271678X16666551.
- Han X, Huang J, To AKW, et al. CEST MRI detectable liposomal hydrogels for multiparametric monitoring in the brain at 3T. Theranostics 2020 doi: 10.7150/thno.40146..
- Zaiss M, Windschuh J, Paech D, et al. Relaxation-compensated CEST-MRI of the human brain at 7T: Unbiased insight into NOE and amide signal changes in human glioblastoma. Neuroimage 2015;112:180–188 doi: 10.1016/j.neuroimage.2015.02.040.
- Huang J, Han X, Chen L, Xu X, Xu J, Chan KWY. Relayed nuclear Overhauser enhancement imaging with magnetization transfer contrast suppression at 3 T. Magn. Reson. Med. 2020:1–14 doi: 10.1002/mrm.28433.
- Wu J, Hua Y, Keep RF, Nakamura T, Hoff JT, Xi G. Iron and Iron-Handling Proteins in the Brain after Intracerebral Hemorrhage. Stroke 2003;34:2964–2969 doi: 10.1161/01.STR.0000103140.52838.45.
- Longo DL, Bartoli A, Consolino L, et al. In vivo imaging of tumor metabolism and acidosis by combining PET and MRI-CEST pH imaging. Cancer Res. 2016;76:6463–6470 doi: 10.1158/0008-5472.CAN-16-0825.
- Zhou J, Lal B, Wilson DA, Laterra J, Van Zijl PCM. Amide Proton Transfer (APT) Contrast for Imaging of Brain Tumors. Magn. Reson. Med. 2003;50:1120–1126 doi: 10.1002/mrm.10651.
Figures
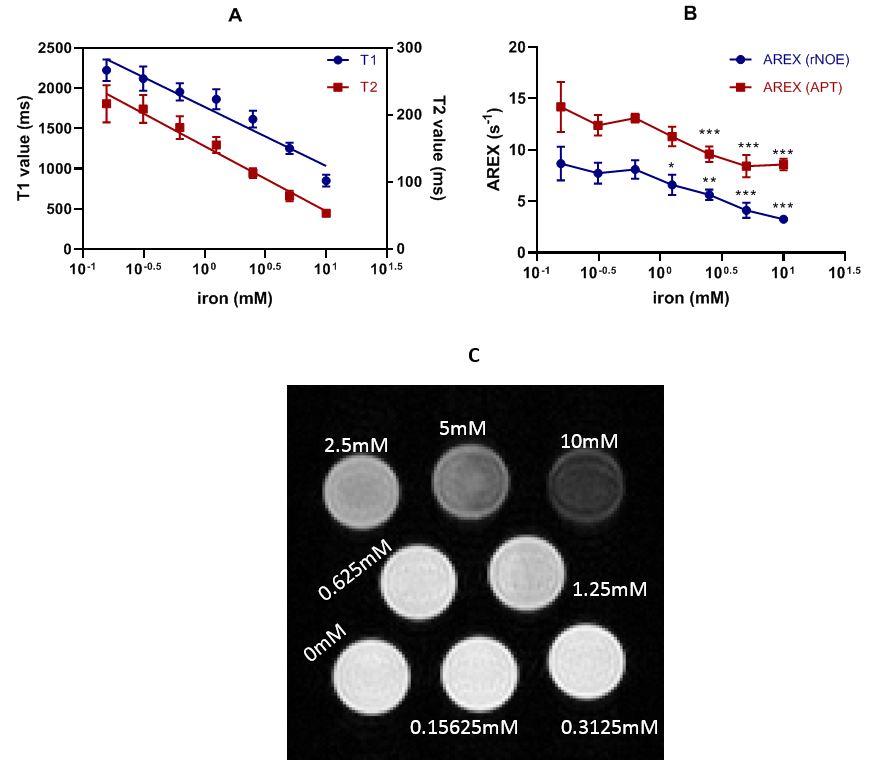
(A) T1 and T2
fitting with iron content (R2 for T1 = 0.9316, Y = -734.4*log X +
1769; R2 for T2 = 0.9792, Y = -96.96*log X + 153.6). (B) AREX value with iron content.
Two-way ANOVA was performed for statistical analysis as compare with the value
of 0.15625mM. *P<0.05, **P<0.01, ***P<0.001. (C) A reference T2-weighted image of the phantom. Values were taken
by averaging the pixels values of each tube.

MR images of an ICH mouse at different time points (From
left to right: before, day 1, day 3, day 7, day 14) Pixels values of the
ipsilateral and the contralateral brain were extracted from the regions within
the red and blue circles respectively. (A)
T2-weighted reference image, (B)
AREX(rNOE), (C) AREX(APT), (D) T1 map, (E) T2 map.
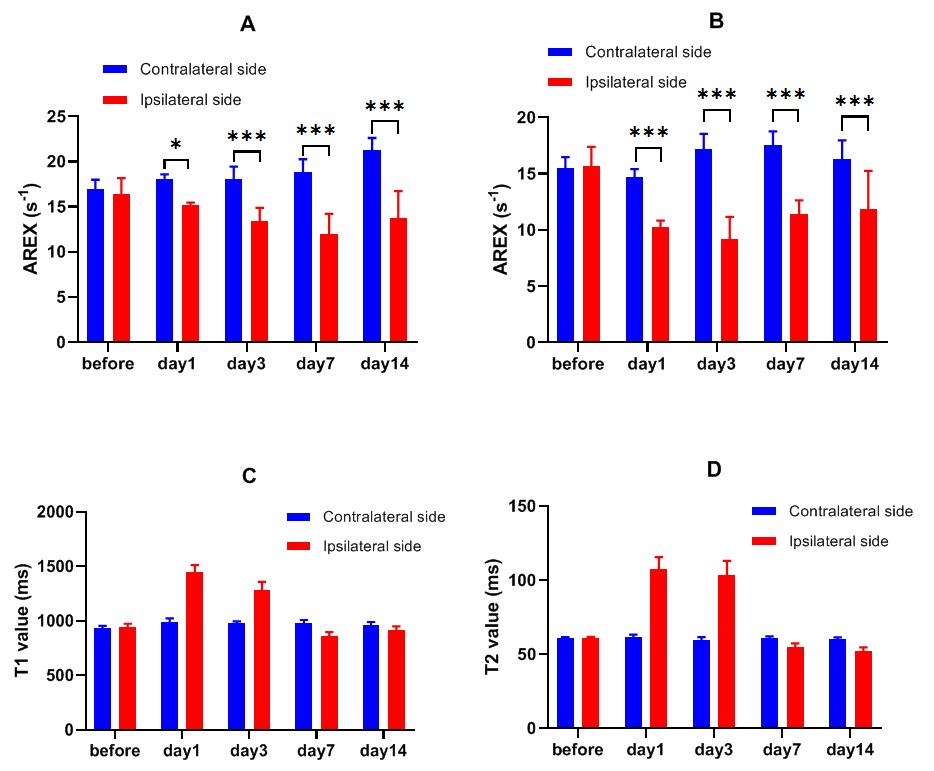
The average signal values between the ipsilateral and
contralateral side of 5 ICH mice. (A)
AREX(rNOE), (B) AREX(APT), (C) T1, (D) T2. Two-way ANOVA was performed for statistical analysis.
*P<0.05, ***P<0.001.