0431
Validation of MRI Measurements of Myelination Changes in an Absence Epilepsy Mouse Model1Bioengineering Department, Stanford University, Stanford, CA, United States, 2Neurology Department, Stanford University, Stanford, CA, United States, 3Radiology Department, Stanford University, Stanford, CA, United States
Synopsis
Maladaptive myelination may contribute to both the predisposition to seizures and cognitive impairment in diseases such as absence epilepsy. To support this hypothesis, we performed MRI microstructural measurements in ex vivo mouse brains from the Scn8amed+/- model of absence epilepsy and validated them against matching Electron Microscopy (EM) quantifications. Our MRI g-ratio results strongly agree with these measurements and both show a statistically significant decrease in g-ratio of the genu in seizure mice. Future work will look to continue the current analysis in longitudinal studies to probe the previously unknown effects of dynamic myelination on the progression of absence epilepsy.
Introduction
Absence epilepsy is a common form of generalized epilepsy, especially preponderant on pediatric populations, which causes seizures that entail brief lapses in awareness1. Even though the seizures may cease during adolescence, this disease is also associated with significant impairment of attention and learning in 30-40% of affected children.The discovery that neuronal activity regulates adaptive changes in myelination in the healthy brain2 leads to the intriguing hypothesis that maladaptive myelination might be interrelated with both the predisposition to seizures and cognitive impairment. To better understand the potential interplay between myelination and seizure activity and monitor the progression of absence epilepsy, we aim to develop non-invasive MRI methods that provide longitudinal in vivo assessment of myelination. Towards this goal, we have previously shown MRI white matter evaluations3 on ex vivo brains of a murine model of absence epilepsy (Scn8amed+/-)4 that support this hypothesis. Here, we extend this work with direct comparisons between MRI and Electron Microscopy (EM) in the same brain tissue.
Methods
We first scanned nine excised p50 mouse brains: 4 wildtype(WT) and 5 using a 7T Burker small bore animal scanner (BioSpec 70/30 USR, Gradient amplitude: 440 mT/m, Slew rate: 3440 T/m/s). Our protocol included:- Magnetization Transfer (MT): 2D FLASH images with MT pulses with equivalent flip angles of 1000° and 4000° were used with seven frequency offsets of 1000, 2000, 4000, 6000, 10000, 22000 and 30000 Hz.
- T1 images: RARE sequence with six different TRs of 600, 800, 1000, 1500, 2200 and 4000 ms.
- Diffusion: diffusion weighted EPI images encompassed into two shells (each of 36 diffusion directions) with b-values of 3000 and 6000 s/mm2.
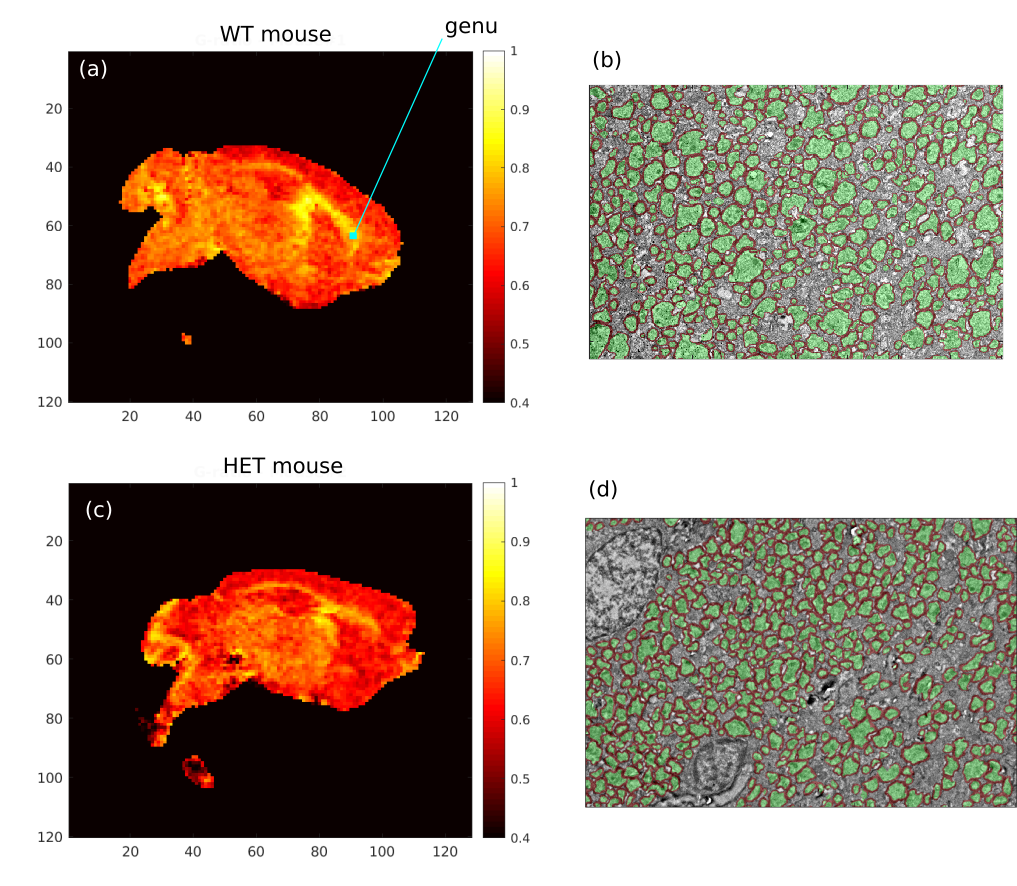
The MRI images were processed using the pipeline described in West et al.5,6. The Sled-Pike model7 was fitted using qMRlab8 to obtain Myelin Volume Fraction (MVF)5. NODDI9,10 was used to obtain the intra-neurite compartment fraction to estimate the Axon Volume Fraction (AVF)6. Finally, MVF and AVF were used to estimate the g-ratio (ratio of the inner diameter of the axon to the outer diameter encompassing the myelin sheath). For the comparisons, we defined a region of interest (ROI) in the genu of the corpus callosum (Fig. 1a).
The 4000x zoom EM images were manually processed by an expert to obtain g-ratios for approximately 200 axons per brain. The 1000x zoom EM images were segmented using the AxonDeepSeg neural network11 and then manually refined to obtain estimates of MVF and AVF.
Results and Discussion
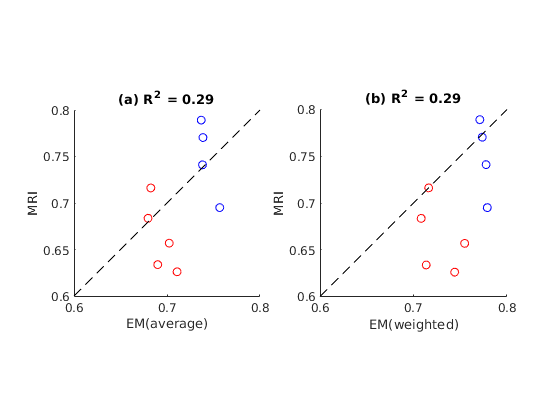
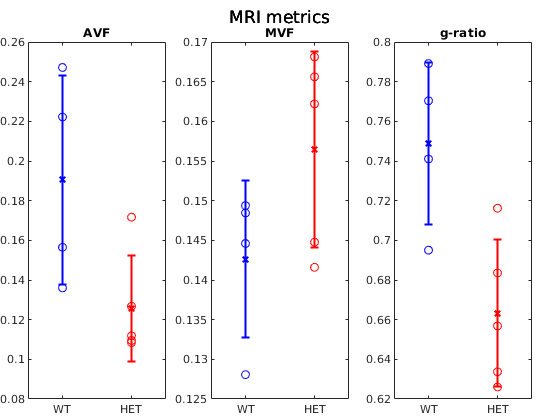
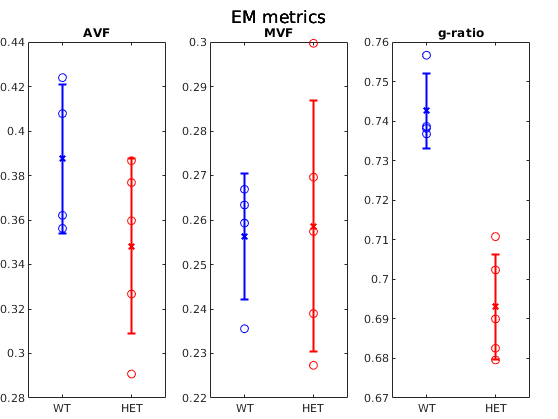
Figure 1 shows example g-ratio maps and EM images and segmentations for one WT mouse and one HET mouse. Figure 2 shows correlation plots between the MRI derived g-ratio and the arithmetic mean EM g-ratio (Fig.2a) as well as the average EM g-ratio weighted by axon area (Fig. 2b) The average EM g-ratio weighted by axon area has been reported to be more representative of what the MRI measurements are sensitive to 12, however, for our data it does not affect the correlation coefficient. Even though the estimated MVF measures have not yet undergone the slope calibrations recommended in previous works5,6,14, we notice an acceptable correlation between MRI and EM, with R2 values similar to prior literature6 as well as the ability to differentiate between the WT and HET groups.The group comparisons for the values of MVF, AVF and g-ratio in MRI and EM are shown in Figure 3 and Figure 4, respectively. MRI metrics suggest a decrease in axon volume fraction (WT: 0.19±0.05, HET:0.13±0.03) and a very slight increase in myelin volume fraction (WT: 0.14±0.01, HET: 0.16±0.01). On the other hand, EM presents a slight decrease in axon volume fraction (WT: 0.39±0.03, Het: 0.35±0.04) and almost no change in MVF. We note the although the absolute values do not agree between the MRI and EM, the ratios are still maintained. Both the MRI derived g-ratios ((WT:0.75±0.04, HET:0.66±0.04, Wilcoxon rank-sum test: p=0.03) and the EM g-ratios (WT:0.74±0.01, HET:0.69±0.01, Wilcoxon rank-sum test: p=0.02) show a statistically significant decrease in the HET mice, in accordance with previous results EM results in separate cohorts of rats and mice3.
Conclusion
We have presented MRI-derived microstructural metrics in the corpus callosum of control and absence epilepsy mouse models and have validated them against electron microscopy measurements. Both modalities showed similar trends and a statistically significant change in the g-ratio of HET mice. These data support the use of MRI for probing myelination changes and will enable the in vivo, whole brain, longitudinal mouse measurements needed to better understand the role of maladaptive myelination in epileptogenesis.Acknowledgements
The authors would like to acknowledge the help of Erpeng Dai in setting up the initial MRI protocol. This work has been supported by Stanford Interdisciplinary Graduate Fellowship affiliated with the Wu Tsai Neurosciences Institute, the Wu Tsai Neurosciences Program at Stanford and Stanford Radiological Sciences Lab Neuroseed Grants.
References
- Kessler, Sudha Kilaru, and Emily McGinnis. "A Practical Guide to Treatment of Childhood Absence Epilepsy." Pediatric Drugs 21.1 (2019): 15-24.
- Gibson, Erin M., et al. "Neuronal activity promotes oligodendrogenesis and adaptive myelination in the mammalian brain." Science 344.6183 (2014): 1252304.
- Chau Loo Kung, Gustavo et al. “White Matter Microstructural Changes in an Absence Epilepsy Mouse Model,” 2020 International Society for Magnetic Resonance in Medicine
- Makinson, Christopher D., et al. "Regulation of thalamic and cortical network synchrony by Scn8a." Neuron 93.5 (2017): 1165-1179.
- West, Kathryn L., et al. "Myelin volume fraction imaging with MRI." Neuroimage 182 (2018): 511-521.
- West, Kathryn L., et al. "Experimental studies of g-ratio MRI in ex vivo mouse brain." NeuroImage 167 (2018): 366-371.
- Sled, John G., and G. Bruce Pike. "Quantitative imaging of magnetization transfer exchange and relaxation properties in vivo using MRI." Magnetic Resonance in Medicine: An Official Journal of the International Society for Magnetic Resonance in Medicine 46.5 (2001): 923-931.
- Cabana, J.-F., Gu, Y., Boudreau, M., Levesque, I. R., Atchia, Y., Sled, J. G., Narayanan, S., Arnold, D. L., Pike, G. B., Cohen-Adad, J., Duval, T., Vuong, M.-T. and Stikov, N. (2016), Quantitative magnetization transfer imaging made easy with qMTLab: Software for data simulation, analysis, and visualization. Concepts Magn. Reson.
- Zhang, Hui, et al. "NODDI: practical in vivo neurite orientation dispersion and density imaging of the human brain." Neuroimage 61.4 (2012): 1000-1016.
- Daducci, Alessandro, et al. "Accelerated microstructure imaging via convex optimization (AMICO) from diffusion MRI data." Neuroimage 105 (2015): 32-44.
- Zaimi, A., Wabartha, M., Herman, V., Antonsanti, P.-L., Perone, C. S., & Cohen-Adad, J. (2018). AxonDeepSeg: automatic axon and myelin segmentation from microscopy data using convolutional neural networks. Scientific Reports, 8(1), 3816.
- West, Kathryn L., et al. "A revised model for estimating g-ratio from MRI." Neuroimage 125 (2016): 1155-1158.
Figures