0430
Polarity of BOLD fMRI as a function of balance between excitation and inhibition1Cener for Neuroscience Imaging Research (CNIR), Institute for Basic Science (IBS), Suwon 16419, Republic of Korea, Suwon, Korea, Republic of, 2Cener for Neuroscience Imaging Research (CNIR), Institute for Basic Science (IBS), Suwon 16419, Republic of Korea, Department of Biomedical Engineering, Sungkyunkwan University, Suwon, Korea, Suwon, Korea, Republic of
Synopsis
To investigate neural source of positive and negative BOLD signals, we modulated a balance of excitatory and inhibitory activity (EI) within the same somatosensory area to determine whether the polarity of evoked BOLD response is reversed. We measured BOLD fMRI at 15.2T and calcium photometry of ketamine/xylazine-anesthetized mice in response to frequency dependent whisker pad stimulation. At 4 Hz, positive BOLD and increased calcium activity were observed in the barrel cortex, whereas at 20 Hz stimulation, negative BOLD and decreased calcium activity were detected. This indicates that the BOLD polarity closely links to the EI balance.
Introduction
Being extensively studied, positive BOLD1 response (PBR) is known to originate through functional hyperaemia, which is due to an increased neural activity2,3. In contrast to this, negative BOLD response (NBR) has a diverse set of explanations and possible mechanisms, mainly depending on the way of manifestation. NBR may come as a result of: increased metabolism with insufficient vascular response4,5, reduction of neural activity that leads to decrease in CBF accompanied by decrease or increase in CBV6,7, blood flow redistribution with a decrease in CBV - ‘blood-steal8, in subcortical areas concurrent with increases in neuronal activity and decreases in CBV9, due to volume change in CSF10,11. To further investigate neural source of PBR and NBR, we propose to modulate a balance of excitatory and inhibitory activity (EI) within the same cortical area to determine whether the polarity of evoked BOLD response is reversed. We hypothesize that these properties, as well as polarity of response, can be controlled by frequency-dependent somatosensory paradigm.Methods
Naïve C57BL/6 mice were used to determine BOLD fMRI (N=3) and intracellular calcium changes (N=6) to somatosensory stimulation with an approved IACUC protocol. Mice were anesthetized by continuous infusion of ketamine-xylazine13 through IV administration. Mouse unilateral whisker electrical stimulation was delivered through electrodes placed on top of the skin, current intensity fixed to 0.5 mA with pulse width of 0.5 ms, and a number of different frequencies were applied by a pulse generator.- 15.2T (Bruker BioSpec, Billerica, MA, USA) MR scanner was used to obtain BOLD fMRI in response to whisker stimulation frequencies of 4 Hz and 20Hz[KSG3] . Parameters of fMRI studies[KSG4] 14 were: GE EPI, TR/TE = 1000/11.5 ms, matrix = 96 × 64, in-plane resolution = 188 × 188 μm2, slice thickness = 500 μm, 9 coronal slices without gap. Each fMRI trial consisted of a 40-s pre-stimulus, 20-s stimulus, and 60-s post-stimulus period.
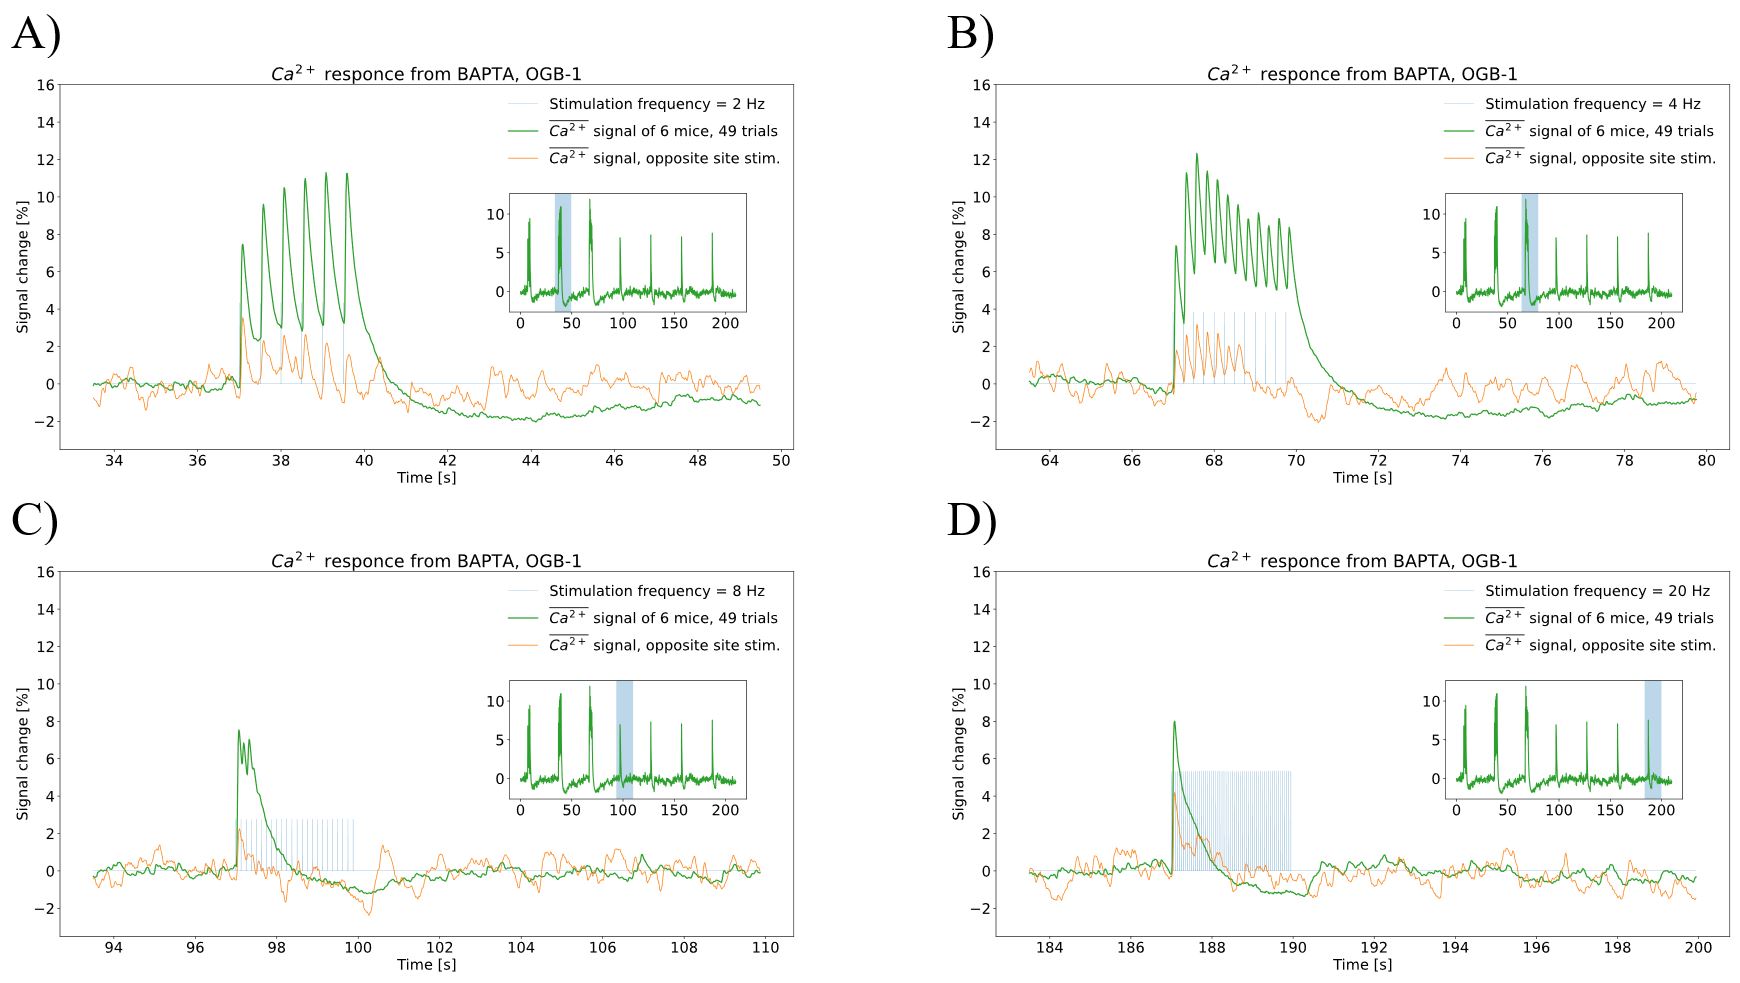
- To obtain dependency of net local neuronal activity to stimulation frequency change, a custom-made spectrally resolved fiber-photometer was used in combination with bulk loading of OGB BAPTA – 1 as calcium indicator. Calcium indicator was loaded into the left mouse barrel cortex using pump (calcium indicator dissolved in the 20% Pluronic F-127/DMSO to a concentration of 10 mM and injected with speed - 100 nl/min for 10 minutes, resulting in 1 μl total volume). Photometer utilizes 2 wavelengths (488 nm and 561 nm) for calcium reading and hemodynamic correction15. Stimulation was performed as a train of 7 equidistant 3 seconds blocks of stimulations with frequencies (1, 2, 4, 8, 10, 16, 20) Hz.
Results
We have obtained high-quality single-shot GE EPI images of mouse brain at an ultrahigh field of 15.2T (see background images of Fig. 1). During 4 Hz right-forepaw stimulation, positive BOLD responses (hot colour in Fig. 1, A) were observed in many somatosensory networked areas including the left (contralateral) barrel field (SSp-bfd), right barrel field, secondary somatosensory cortex, and thalamus. When a stimulation frequency increased to 20 Hz, PBR was changed to NPR in bilateral barrel fields (cold colour in Fig. 1, B). This frequency-dependent BOLD polarity change was consistently observed in all three animals. To quantify these changes, we determined Z-score values in the left (contralateral) and right (ipsilateral) barrel field. Eight data points from 3 animals (5 time points per animal) were plotted in Fig. 2. Mean magnitude of NBR is slightly less than that of PBR.To determine a potential source of NPR, we measured calcium response with correction of hemodynamic inference15. Average of 6 mice, 49 runs with 7 frequency stimulation is shown as insets in Fig. 3. During each 3-s stimulation period, evoked responses were observed (main plots). At a low frequency stimulation, calcium response to each contralateral (and ipsilateral) whisker stimulation pulse was clearly detected. that is not a case at a higher frequency due to calcium’s intrinsic property. Evoked calcium signals increase with respect to a frequency increase (Fig. 3, A-B), reaching its local maximum at 4 Hz. Further frequency increase results in an initial increase followed by a decrease below the pre-stimulus baseline (Fig. 3, C-D), which is likely due to neuronal inhibition. During 20 s stimulation used for fMRI studies, prolonged inhibition after the initial excitation will be dominant for 20 Hz stimulation, whereas prolonged excitation will be maintained during the entire stimulation period.
Discussion
We have successfully observed BOLD signals polarity change by modulating stimulation frequency. Calcium measurements support idea that neuronal origin of BOLD polarity closely links to EI balance and are in coherence with current understanding of NVC. At low frequency stimulation, excitation is dominant, while at high frequency stimulation, inhibition is dominant as seen in Fig. 3. An important question is how to induce inhibi-tion by high frequency stimulation. We do speculate that excitatory neuronal activity by whisker stimulation has much longer recovery time than fast spiking inhibitory activity. Consequently, excitatory activity is sustained for prolonged low frequency stimulation. However, at high frequency, the excitatory activity is adapted, whereas inhibitory neuronal activity is sustained. Consequently, the excitatory activity is suppressed below the pre-stimulus baseline at a later time. This hypothesis should be investigated by measuring cell-type specific calcium activity in the future.Acknowledgements
This work was supported by the Institute of Basic Science (IBS-R015-D1)References
- Ogawa S, Menon RS, Tank DW, et al. Functional brain mapping by blood oxygenation level-dependent contrast magnetic resonance imaging. A comparison of signal characteristics with a biophysical model. Biophys J. 1993;64(3):803-812
- Iadecola C. The neurovascular unit coming of age: a journey through neurovascular coupling in health and disease. Neuron 2017;96:17–42
- Hillman E.M.C. Coupling mechanism and significance of the BOLD signal: a status report. Annu. Rev. Neurosci. 2014;37:161–181
- Nagaoka, T., Zhao, F., Wang, P., Harel, N., Kennan, R. P., Ogawa, S., et al., Increases in oxygen consumption without cerebral blood volume change during visual stimulation under hypotension condition. J. Cereb. Blood Flow Metab. 2006;26:1043–1051
- Schridde, U., Khubchandani, M., Motelow, J. E., Sanganahalli, B. G., Hyder, F., and Blumenfeld, H. Negative BOLD with large increases in neuronal activity. Cereb. Cortex 2008;18:1814–1827
- Shmuel, A., Augath, M., Oeltermann, A., and Logothetis, N.K. Negative functional MRI response correlates with decreases in neuronal activity in monkey visual area V1. Nat. Neurosci. 2006;9: 569–577
- Devor, A., Hillman, E. M., Tian, P., Waeber, C., Teng, I. C., et al. Stimulus-induced changes in blood flow and 2-deoxyglucose uptake dissociate in ipsilateral somatosensory cortex. J. Neurosci. 2008;28:14347–14357
- Harel, N., Lee, S. P., Nagaoka, T., Kim, D.S., and Kim, S.G. Origin of negative blood oxygenation level-dependent fMRI signals. J. Cereb. Blood Flow Metab. 2002;22:908–917
- Shih, Y. Y., Chen, C. C., Shyu, B. C., Lin, Z. J., Chiang, Y. C., Jaw, F. S., et al. A new scenario for negative functional magnetic resonance imaging signals: endogenous neurotransmission. J. Neurosci. 2009;29:3036–3044
- Bianciardi, M., Fukunaga, M., van Gelderen, P., de Zwart, J. A., and Duyn, J. H. Negative BOLD-fMRI signals in large cerebral veins. J. Cereb. Blood Flow Metab. 2011;31:401–412
- Thomas, B. P., Liu, P., Aslan,S., King, K. S., van Osch, M. J., and Lu, H. Physiologic underpinnings of negative BOLD cerebrovascular reactivity in brain ventricles. Neuroimage 2013;83:505–512
- Ross W, et al. Spatially congruent negative BOLD responses to different stimuli do not summate in visual cortex, NeuroImage 2020;218
- H.J. Shim, et al. Mouse fMRI under ketamine and xylazine anesthesia: robust contralateral somatosensory cortex activation in response to forepaw stimulation. Neuroimage, 177; 2018:30-44
- W. B. Jung, H. J. Shim, S. G. Kim, Mouse BOLD fMRI at ultrahigh field detects somatosensory networks including thalamic nuclei. NeuroImage, 2019;195:203-214
- Hillman EM, Devor A, Bouchard MB, Dunn AK, Krauss GW, Skoch J, Bacskai BJ, Dale AM, Boas DA. Depth-resolved optical imaging and microscopy of vascular compartment dynamics during somatosensory stimulation. Neuroimage 2007;35:89–104
Figures
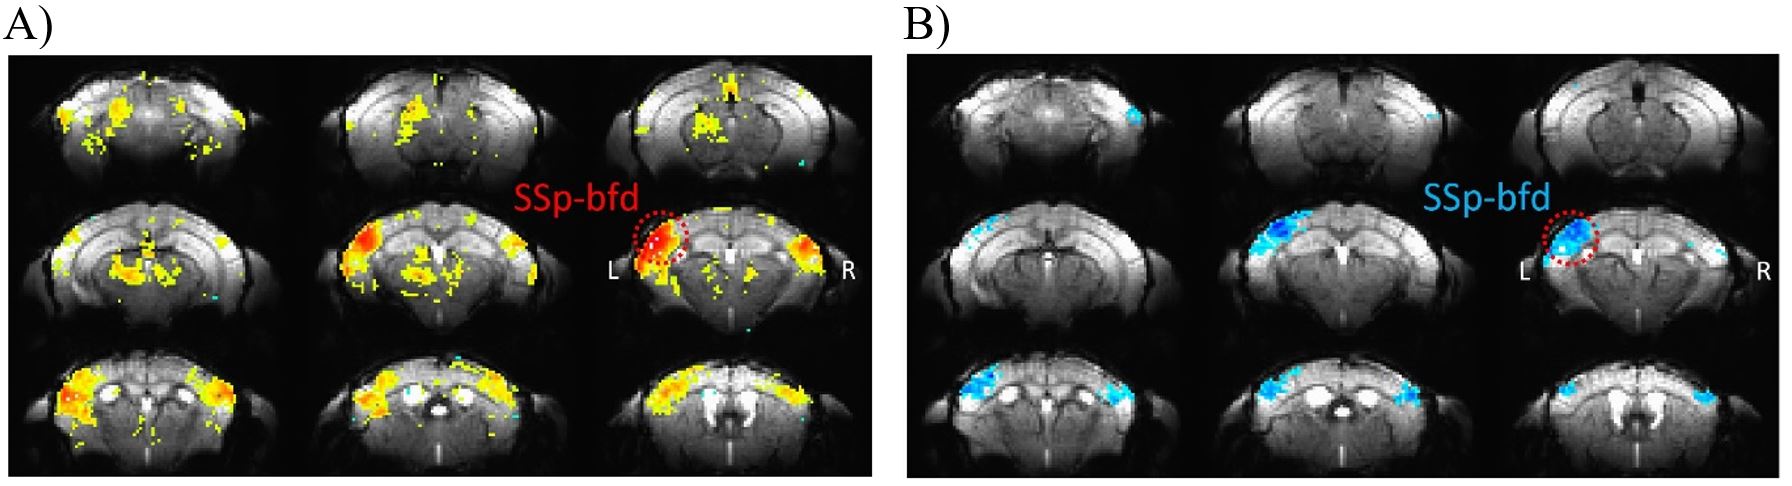
Figure 1. Evoked functional changes to a set of 2 different stimulation frequencies. Main response area is marked with red circle and located in primary somatosensory area, barrel field (SSp-bfd).
A) Areas in the mice brain show positive functional changes to 4 Hz stimulation frequency.
B) Areas in the mice brain show negative functional changes to 20 Hz stimulation frequency.
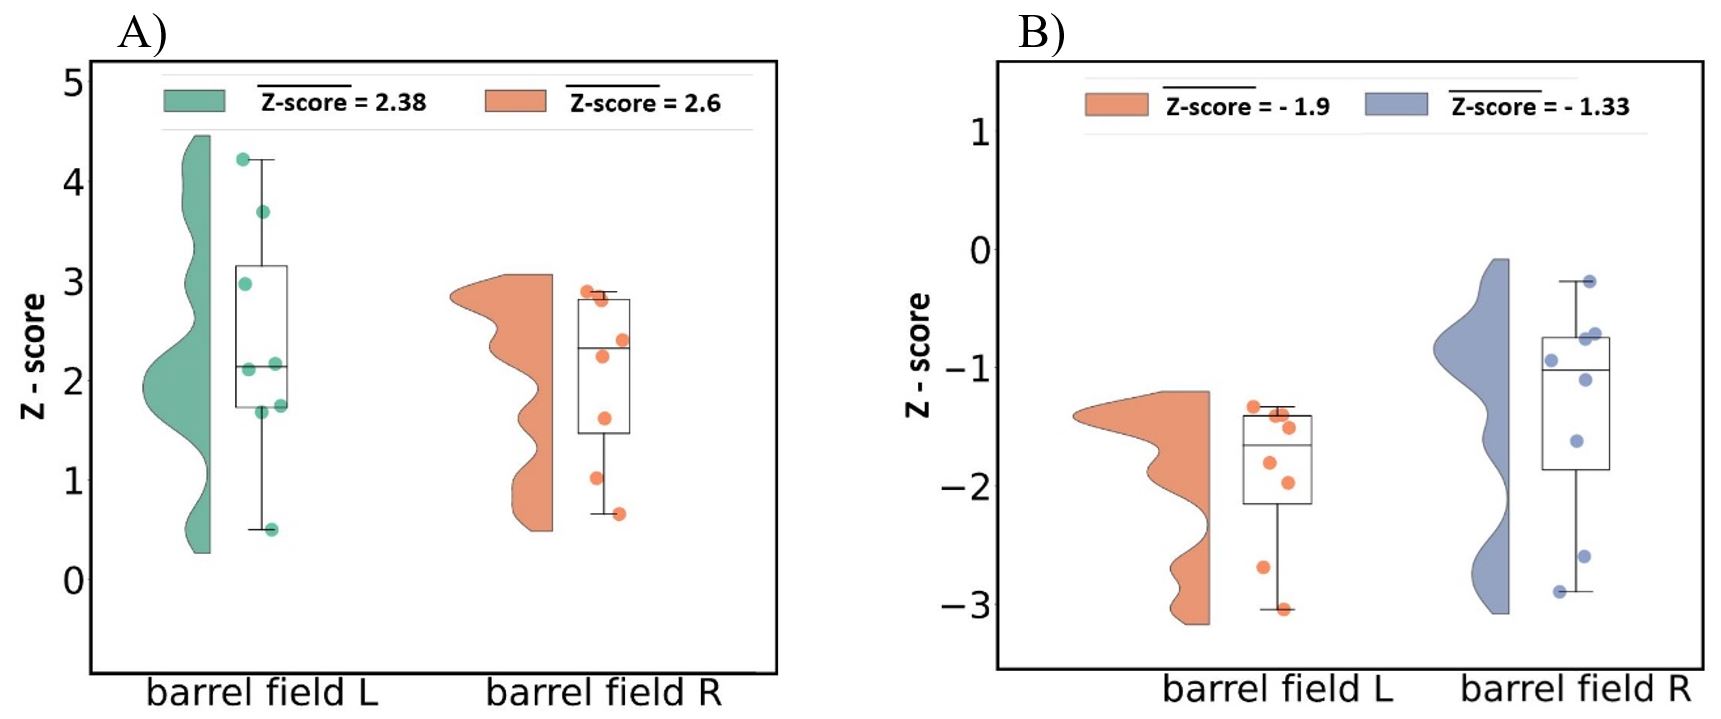
Figure 2. Averaged Z-score of left and right barrel field areas signal, obtained from fMRI measurements of 3 mice, 8 blocks with 5 trials each (40 trials per mouse).
A) Data represents stimulation frequency – 4 Hz
B) Stimulation frequency – 20 Hz