0428
Grey matter atrophy measured in-vivo with 9.4T MRI in the cuprizone mouse model of demyelination1Department of Radiology, University of Calgary, Calgary, AB, Canada, 2Hotchkiss Brain Institute, University of Calgary, Calgary, AB, Canada, 3Department of Clinical Neurosciences, University of Calgary, Calgary, AB, Canada, 4Experimental Imaging Center Cumming School of Medicine, University of Calgary, Calgary, AB, Canada
Synopsis
Grey matter atrophy is a marker of progressive disability in multiple sclerosis (MS). To better study atrophy in MS, mouse models that display grey matter loss are needed. A possible candidate is the cuprizone mouse model, which exhibits demyelination, gliosis, and axonal injury. We used high-resolution MRI (37.5x37.5x250μm3) and atlas-based volumetrics to measure volumes of 62 structures in the brains of cuprizone mice following acute (6-weeks) and chronic (12-weeks) demyelination. We found no atrophy associated with acute demyelination but identified atrophy in 7 regions following chronic demyelination including the corpus callosum, internal capsule, striatum, and thalamus.
Introduction
Grey matter (GM) atrophy plays a prominent role in multiple sclerosis (MS) having been associated with disease progression1, physical symptoms2, and cognitive impairment3. As a result, it is important to better understand the pathology behind atrophy to identify therapeutic targets. Current anti-inflammatory therapies have shown little effect at reducing atrophy4 suggesting that in addition to inflammation, other aspects of MS pathology, such as demyelination may play an important role. One potential way to study the association between demyelination and atrophy is the cuprizone mouse model. Cuprizone is an established model of chemically induced demyelination resulting in oligodendrocyte cell death, significant demyelination of the white and grey matter, gliosis, and axonal injury5. As a result, it is possible that this model exhibits GM atrophy as well. We used high-resolution magnetic resonance imaging (MRI), a Bruker cryoprobe, and atlas-based regional volumetric analysis to measure atrophy in the brains of cuprizone mice.Methods
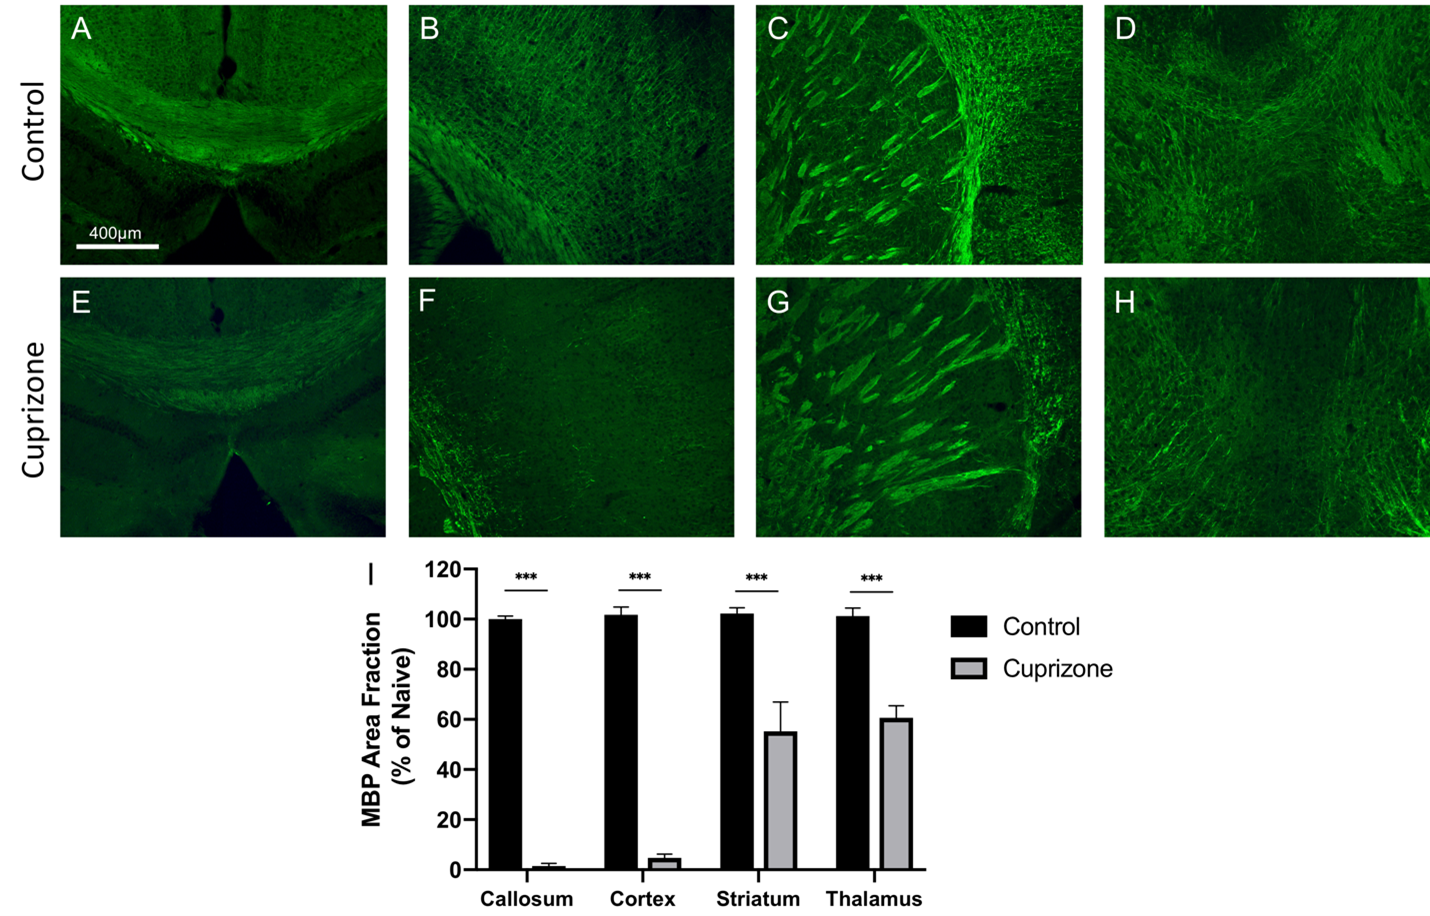
Cuprizone was induced in male C57BL/6 mice via feeding mice a diet of standard rodent pellets ground up and combined with 0.2% cuprizone. Mice were fed cuprizone for 6 or 12 weeks to induce acute or chronic demyelination, respectively. Control mice were fed with cuprizone-free standard rodent pellets. Mice were imaged after 6 or 12 weeks (n=9 acute control, 9 acute cuprizone, 9 chronic control, 9 chronic cuprizone). Imaging was conducted using a 9.4T MRI with a helium cooled Bruker cryoprobe using a FLASH sequence (TR/TE/α=2000ms/6.5ms/60o voxel=37.5-x-37.5-x-250μm3, acquisition time 38 minutes). Using the NiftyReg software, an averaged brain atlas6 was registered to each dataset and the volumes of each registered atlas brain region was determined. Segmented images were compared alongside the original MRI images with a synchronized cursor to ensure that boundaries of the brain and major anatomical regions are properly aligned. Statistics were performed using an ANCOVA test with body weight as a covariate. The false discovery rate method (FDR=10%) was used to correct for running multiple ANCOVA tests. Following imaging mice were sacrificed and brains were extracted for histology. Corpus callosum, cortex, thalamus, and striatum regions were stained with myelin basic protein at measure myelin levels. Myelin levels were quantified in ImageJ and described as percent area of immunoreactivity. Statistics were performed using a Student's t-test.Results
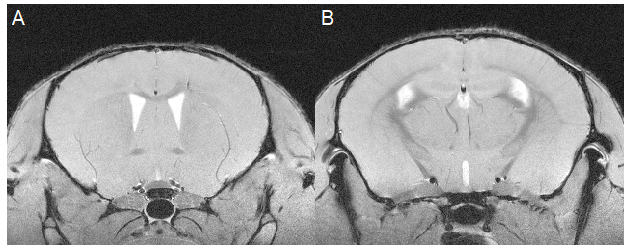
Similar to previous studies, cuprizone mice displayed regional demyelination in the corpus callosum following a rostro-caudal pattern (Figure 1). Cuprizone mice following an acute 6-week diet had no significant difference in total brain volume compared to controls (Figure 2). Regionally, the corpus callosum, inferior and superior colliculus were trending smaller in cuprizone mice but were not significantly different after correcting for multiple comparisons. Following a chronic 12-week diet, cuprizone mice had smaller volumes for 7 out of the 62 measured regions. The 7 structures were comprised of 4 GM and 3 WM structures. These regions include the corpus callosum, thalamus, striatum, internal capsule, stria terminalis, inferior colliculus, and globus pallidus. No volume loss was seen in the cortex (Figure 3, Table 1). Myelin staining demonstrated that cuprizone mice feature severe GM demyelination at both acute (not shown) and chronic (Figure 4) time points. Demyelination was seen in the corpus callosum, cortex, and deep GM regions.Discussion
We measured a significant loss of volume after chronic demyelination in white matter regions including the corpus callosum, internal capsule, and stria terminalis. This loss of volume could be due in part to demyelination as studies have shown that the myelin sheath occupies 25-30% of white matter volume7. Volume loss could also be the result of significant axonal injury and eventual degeneration as seen in other studies following chronic demyelination8, 9. We also identified subcortical GM atrophy in regions including the thalamus, striatum, and globus pallidus, which are also affected in MS patients10-13. Subcortical regions like the thalamus are extensively connected to other areas of the brain and as such are susceptible to retrograde neurodegeneration due to axonal loss in other regions like the cortex and corpus callosum. It is surprising that the cerebral cortex showed no evidence of atrophy despite having near complete levels of demyelination throughout the entire cortex. This could suggest that demyelination alone is not enough to drive cortical atrophy. In MS, other factors, such as adaptive inflammation from the autoimmune response may be needed to cause atrophy in addition to demyelination.Conclusion
By combining a cryoprobe with 9.4T MRI, we were able to obtain a nominal resolution of 37.5x37.5x250 μm3 in 38 minutes. We found that chronic demyelination in the cuprizone model results in subcortical and white matter atrophy. This atrophy appears to be associated with severe demyelination, though other mechanisms are involved, as regions including the cortex showed severe demyelination without atrophy. Future work will investigate neuronal and axonal densities in affected regions to determine if volume loss is the result of neurodegeneration similar to MS.Acknowledgements
This work was funded by the Alberta Innovates-Health Solutions Collaborative Research and Innovative Opportunities Team program, the Brain Canada Foundation, the Canada Foundation for Innovation (Project 4933), and the National Sciences and Engineering Research Council, Canada (RGPIN-2015-06517).References
1. Simon JH. Brain and spinal cord atrophy in multiple sclerosis: role as a surrogate measure of disease progression. CNS Drugs. 2001;15(6):427-36.
2. Bakshi R, Benedict RHB, Bermel RA, Jacobs L. Regional Brain Atrophy Is Associated With Physical Disability in Multiple Sclerosis: Semiquantitative Magnetic Resonance Imaging and Relationship to Clinical Findings. Journal of Neuroimaging. 2001;11(2):129-36.
3. Calabrese M, Agosta F, Rinaldi F, Mattisi I, Grossi P, Favaretto A, et al. Cortical lesions and atrophy associated with cognitive impairment in relapsing-remitting multiple sclerosis. Arch Neurol. 2009;66(9):1144-50.
4. Beck ES, Reich DS. Brain atrophy in multiple sclerosis: How deep must we go? Ann Neurol. 2018;83(2):208-9.
5. Praet J, Guglielmetti C, Berneman Z, Van der Linden A, Ponsaerts P. Cellular and molecular neuropathology of the cuprizone mouse model: Clinical relevance for multiple sclerosis. Neuroscience & Biobehavioral Reviews. 2014;47:485-505.
6. Dorr AE, Lerch JP, Spring S, Kabani N, Henkelman RM. High resolution three-dimensional brain atlas using an average magnetic resonance image of 40 adult C57Bl/6J mice. Neuroimage. 2008;42(1):60-9.
7. Duval T, Stikov N, Cohen-Adad J. Modeling white matter microstructure. Funct Neurol. 2016;31(4):217-28.
8. Irvine KA, Blakemore WF. Age increases axon loss associated with primary demyelination in cuprizone-induced demyelination in C57BL/6 mice. J Neuroimmunol. 2006;175(1-2):69-76.
9. Mason JL, Langaman C, Morell P, Suzuki K, Matsushima GK. Episodic demyelination and subsequent remyelination within the murine central nervous system: changes in axonal calibre. Neuropathol Appl Neurobiol. 2001;27(1):50-8.
10. Batista S, Zivadinov R, Hoogs M, Bergsland N, Heininen-Brown M, Dwyer MG, et al. Basal ganglia, thalamus and neocortical atrophy predicting slowed cognitive processing in multiple sclerosis. J Neurol. 2012;259(1):139-46.
11. Houtchens MK, Benedict RH, Killiany R, Sharma J, Jaisani Z, Singh B, et al. Thalamic atrophy and cognition in multiple sclerosis. Neurology. 2007;69(12):1213-23.
12. Bermel RA, Innus MD, Tjoa CW, Bakshi R. Selective caudate atrophy in multiple sclerosis: a 3D MRI parcellation study. Neuroreport. 2003;14.
13. Tao G, Datta S, He R, Nelson F, Wolinsky JS, Narayana PA. Deep gray matter atrophy in multiple sclerosis: a tensor based morphometry. J Neurol Sci. 2009;282.
Figures