0427
Viral-CEST: Exploiting AAV capsids as endogenous CEST agents for tracking of viral cell transduction1Department of Bioengineering, University of California, Berkeley, Berkeley, CA, United States
Synopsis
Viral vectors, including adeno-associated viruses (AAV), are increasingly used for therapies that utilize somatic cell gene editing. Validation of successful delivery of gene editing machinery requires biopsy, which is a fundamental barrier to development of gene therapy. Research into chemical exchange saturation transfer (CEST)-MRI contrast agents has yielded numerous targeted and pH sensitive exogenous agents for diagnostic purposes. In this study we demonstrated that CEST-MRI can detect the abundant serine, threonine, and lysine residues on AAV capsid surfaces across serotypes that are responsible for targeted receptor binding; further that transduction of cells by AAV2 can be detected by CEST.
Introduction
Several methods for in vivo gene editing have been explored over the last 20 years, however over the last 3 years the adoption of AAV has been widespread for either direct gene editing or as a delivery vehicle for gene editing machinery such as novel CRISPR/cas complexes. Unlike other viri (e.g. lentivirus, herpes simplex), the dozen AAV serotypes currently available have varying degrees of organ specificity and do not provoke a severe immune response. While early use of AAV vectors was stymied by poor transduction, novel engineering AAV variants have recently demonstrated an order of magnitude greater transduction efficiency in target organs. Despite this progress, confirmation of AAV delivery and successful transduction of target cells still requires invasive biopsy and expensive biochemical assays. In parallel, CEST-MRI has emerged as a powerful non-invasive molecular imaging modality capable of detecting bioactive molecules. Recently we demonstrated the ability to quantify myocardial gene delivery using AAV9 and a genetically encoded CEST-MR reporter peptide (1). Based on similarities between this peptide and AAV capsid proteins (2) we examined whether AAV viral particles generate CEST contrast in solution and when undergoing endosomal transport.Methods
NMR CEST was performed on an 800MHz Bruker vertical spectrometer. CEST preparation utilized a 5 second continuous wave Gaussian shaped pulse, followed by a free induction decay acquisition at water resonance. Z-spectra were acquired by incrementing the CEST offsets from -5ppm to +5ppm in steps of 0.2ppm for peak saturation powers ranging from 3μT to 9μT in steps of 0.3μT. The repetition time between acquisitions was 30s to allow for full T1 relaxation. Z-spectra were B0 corrected when necessary and CEST contrast was quantified via MTR asymmetry. All NMR samples were diluted in 1x PBS. AAV vectors of serotypes 1-9 were acquired from Vector Biolabs (Malvern, PA), diluted to densities of 5.23e8 viral genomes/mL, and pH balanced to 6.0 using HCl. AAV2 was used for more in depth experiments with serial dilutions of concentration and pH changes to 7.5. Next, HEK-293T cells were transduced with AAV2 viral medium. After allowing 1hr for viral binding, viral medium was replaced and cells were incubated at 37°C to allow for viral internalization. Cells were collected immediately and after 3 hours and endosomes were isolated from cell lysate using a PEG based isolation reagent. Following isolation, the endosome pellet was resuspended in 1X PBS (pH 6.0) for NMR experiments. Endosomal viral titer was quantified using qPCR with primers targeting for AAV ITR.Results
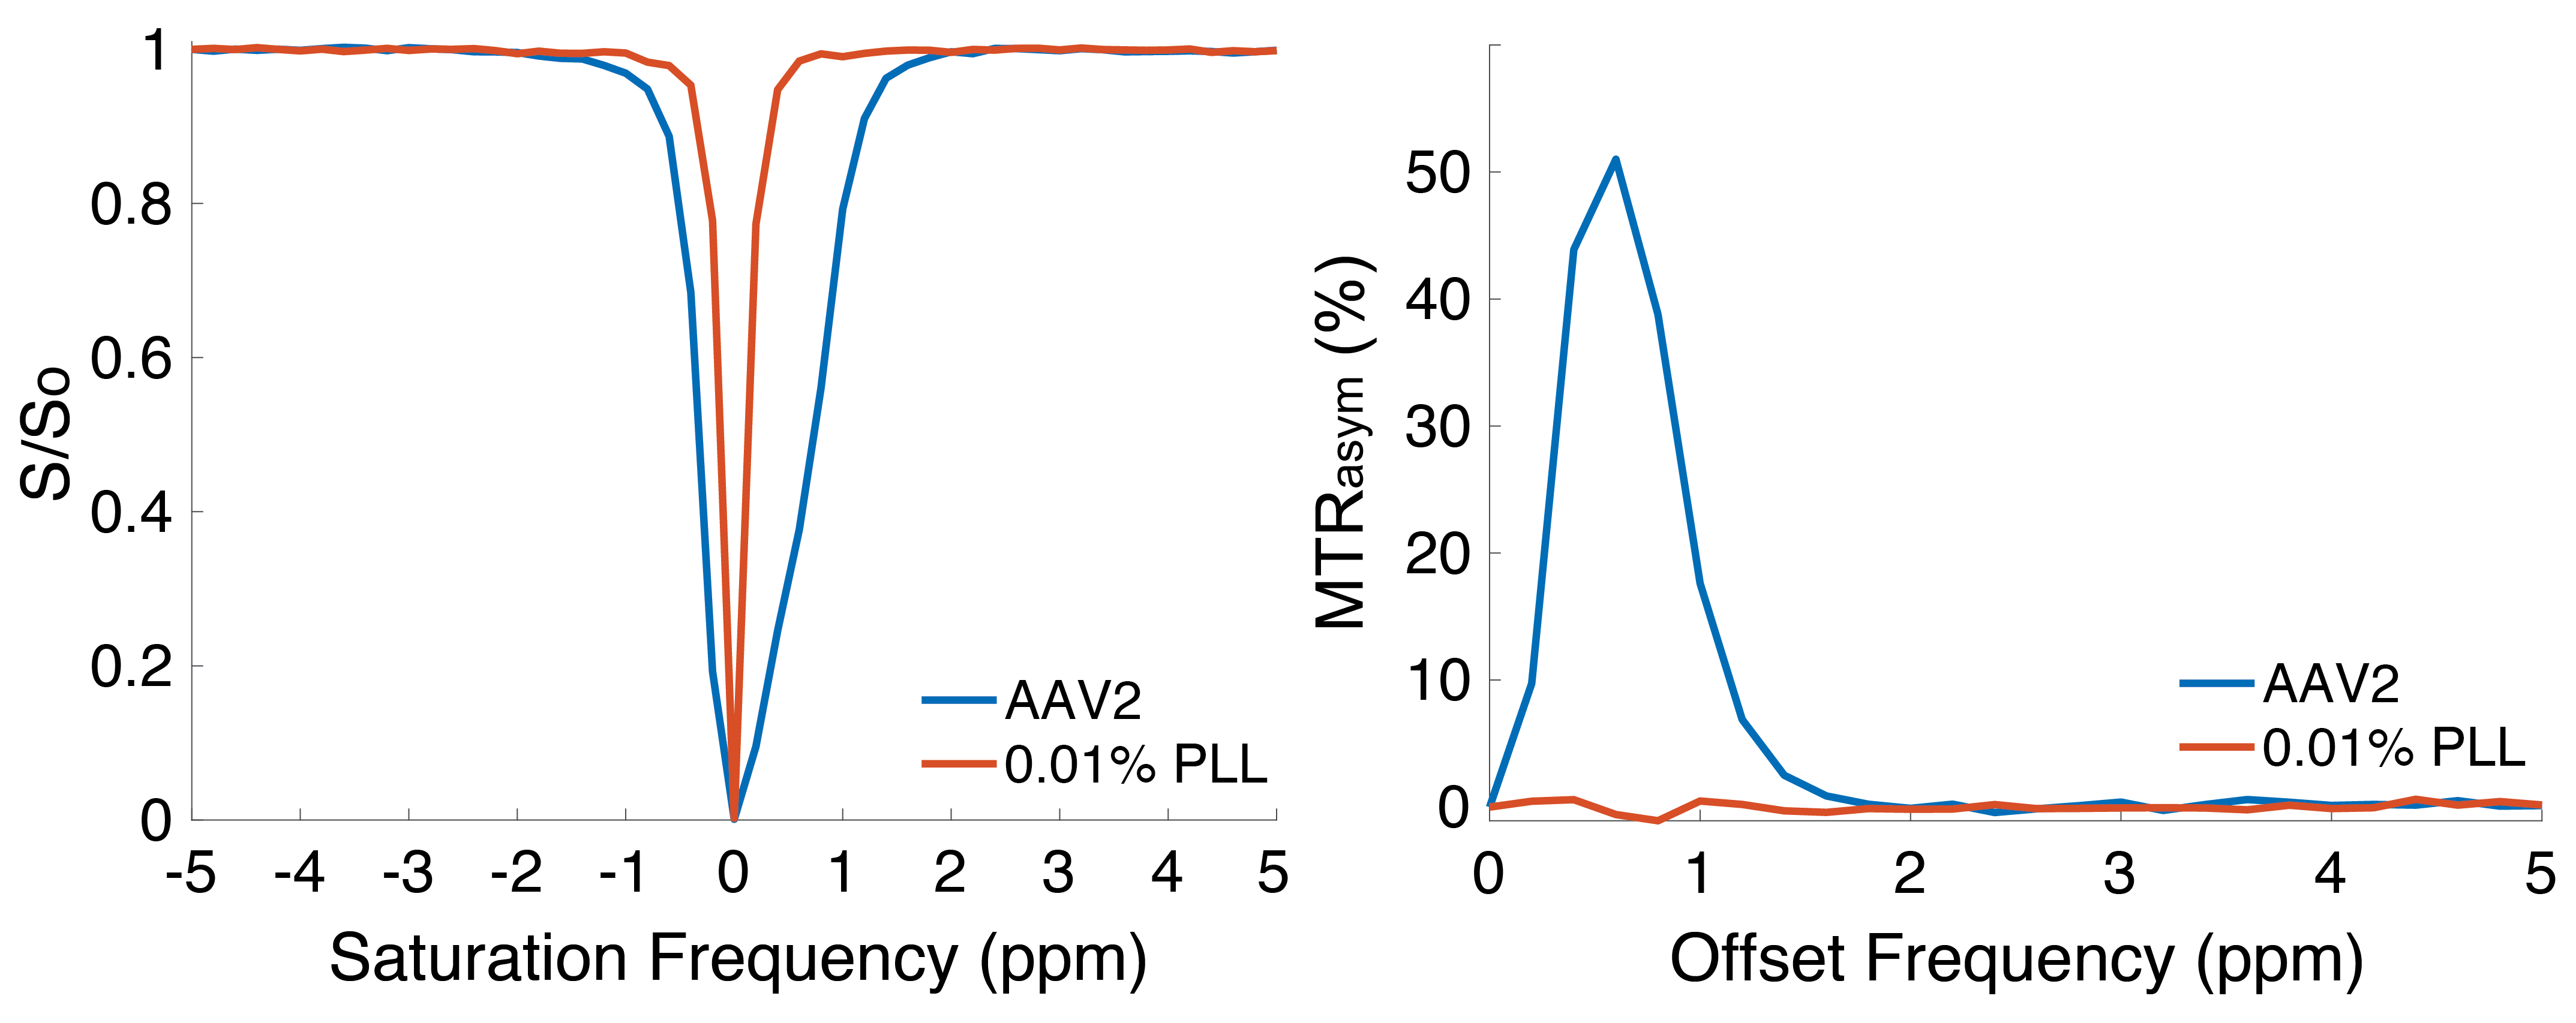
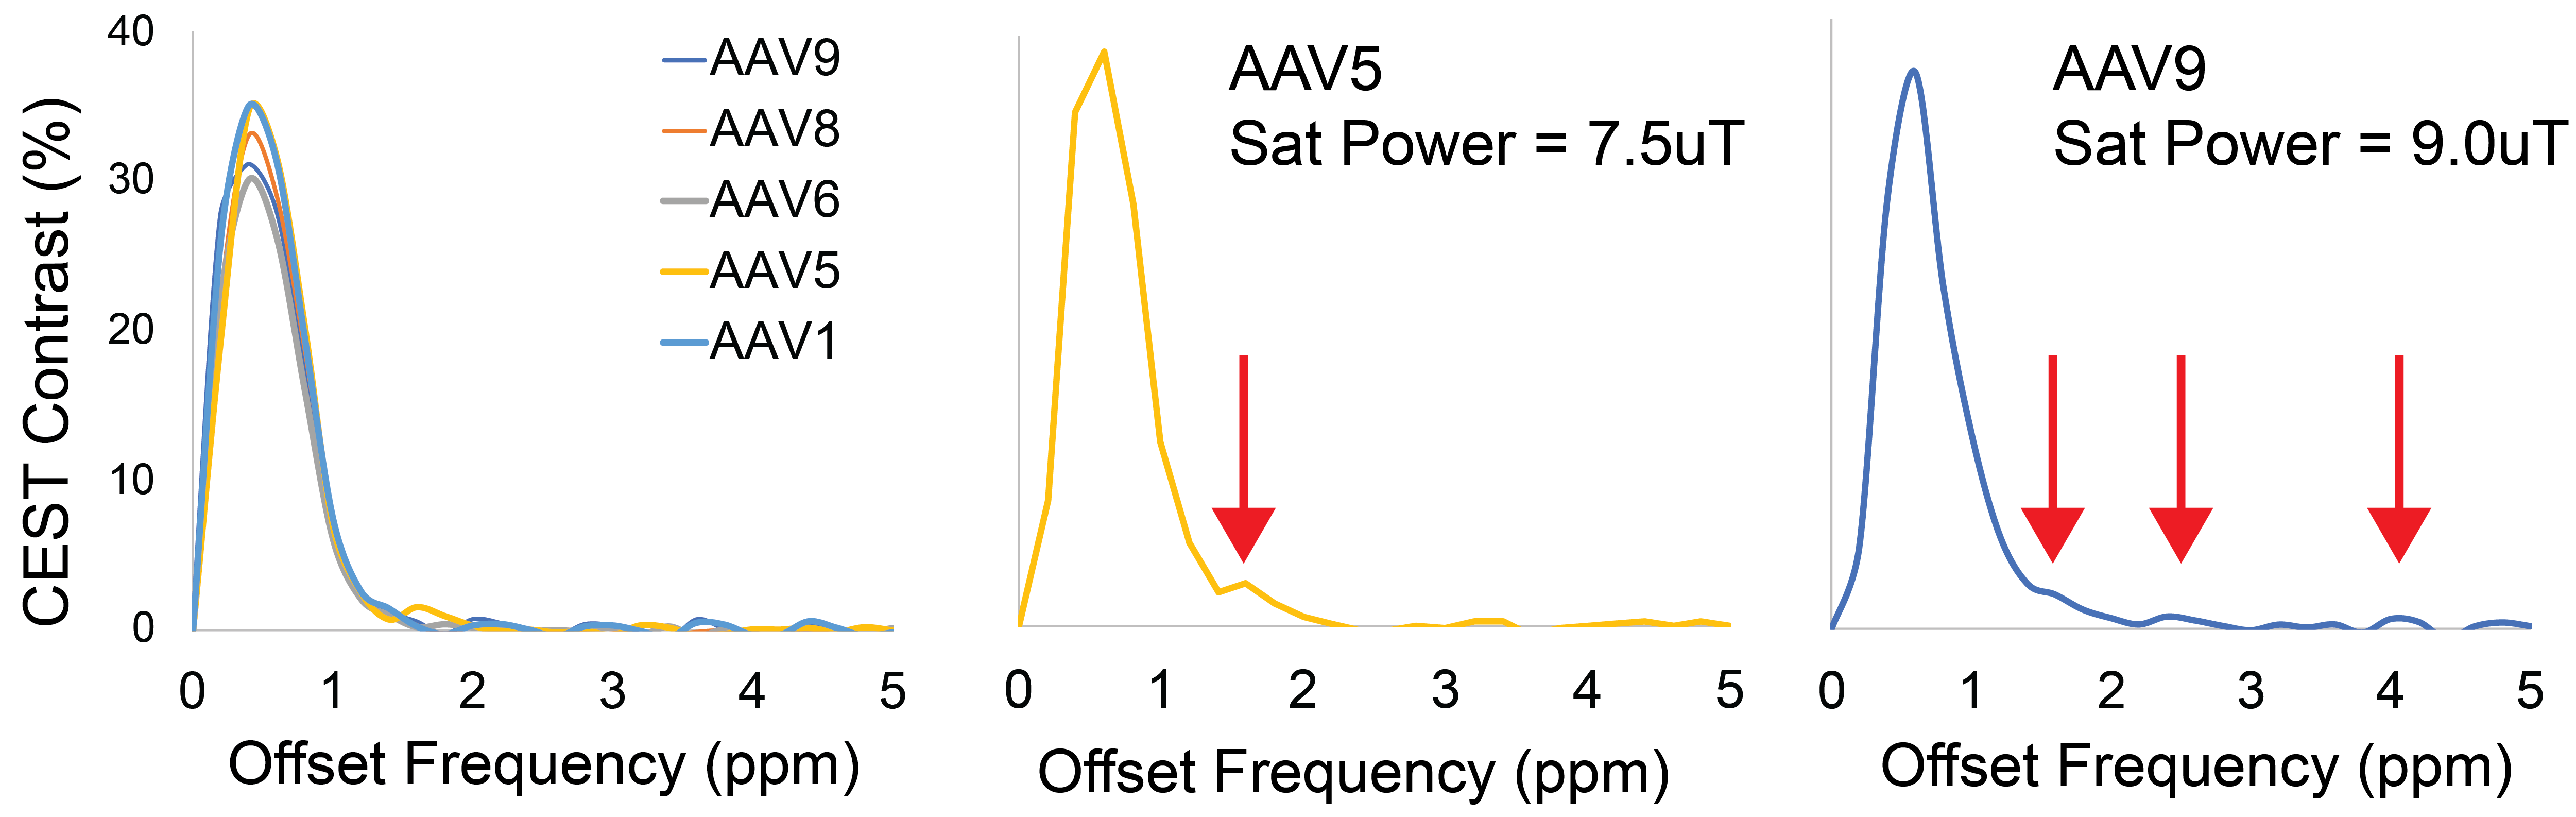
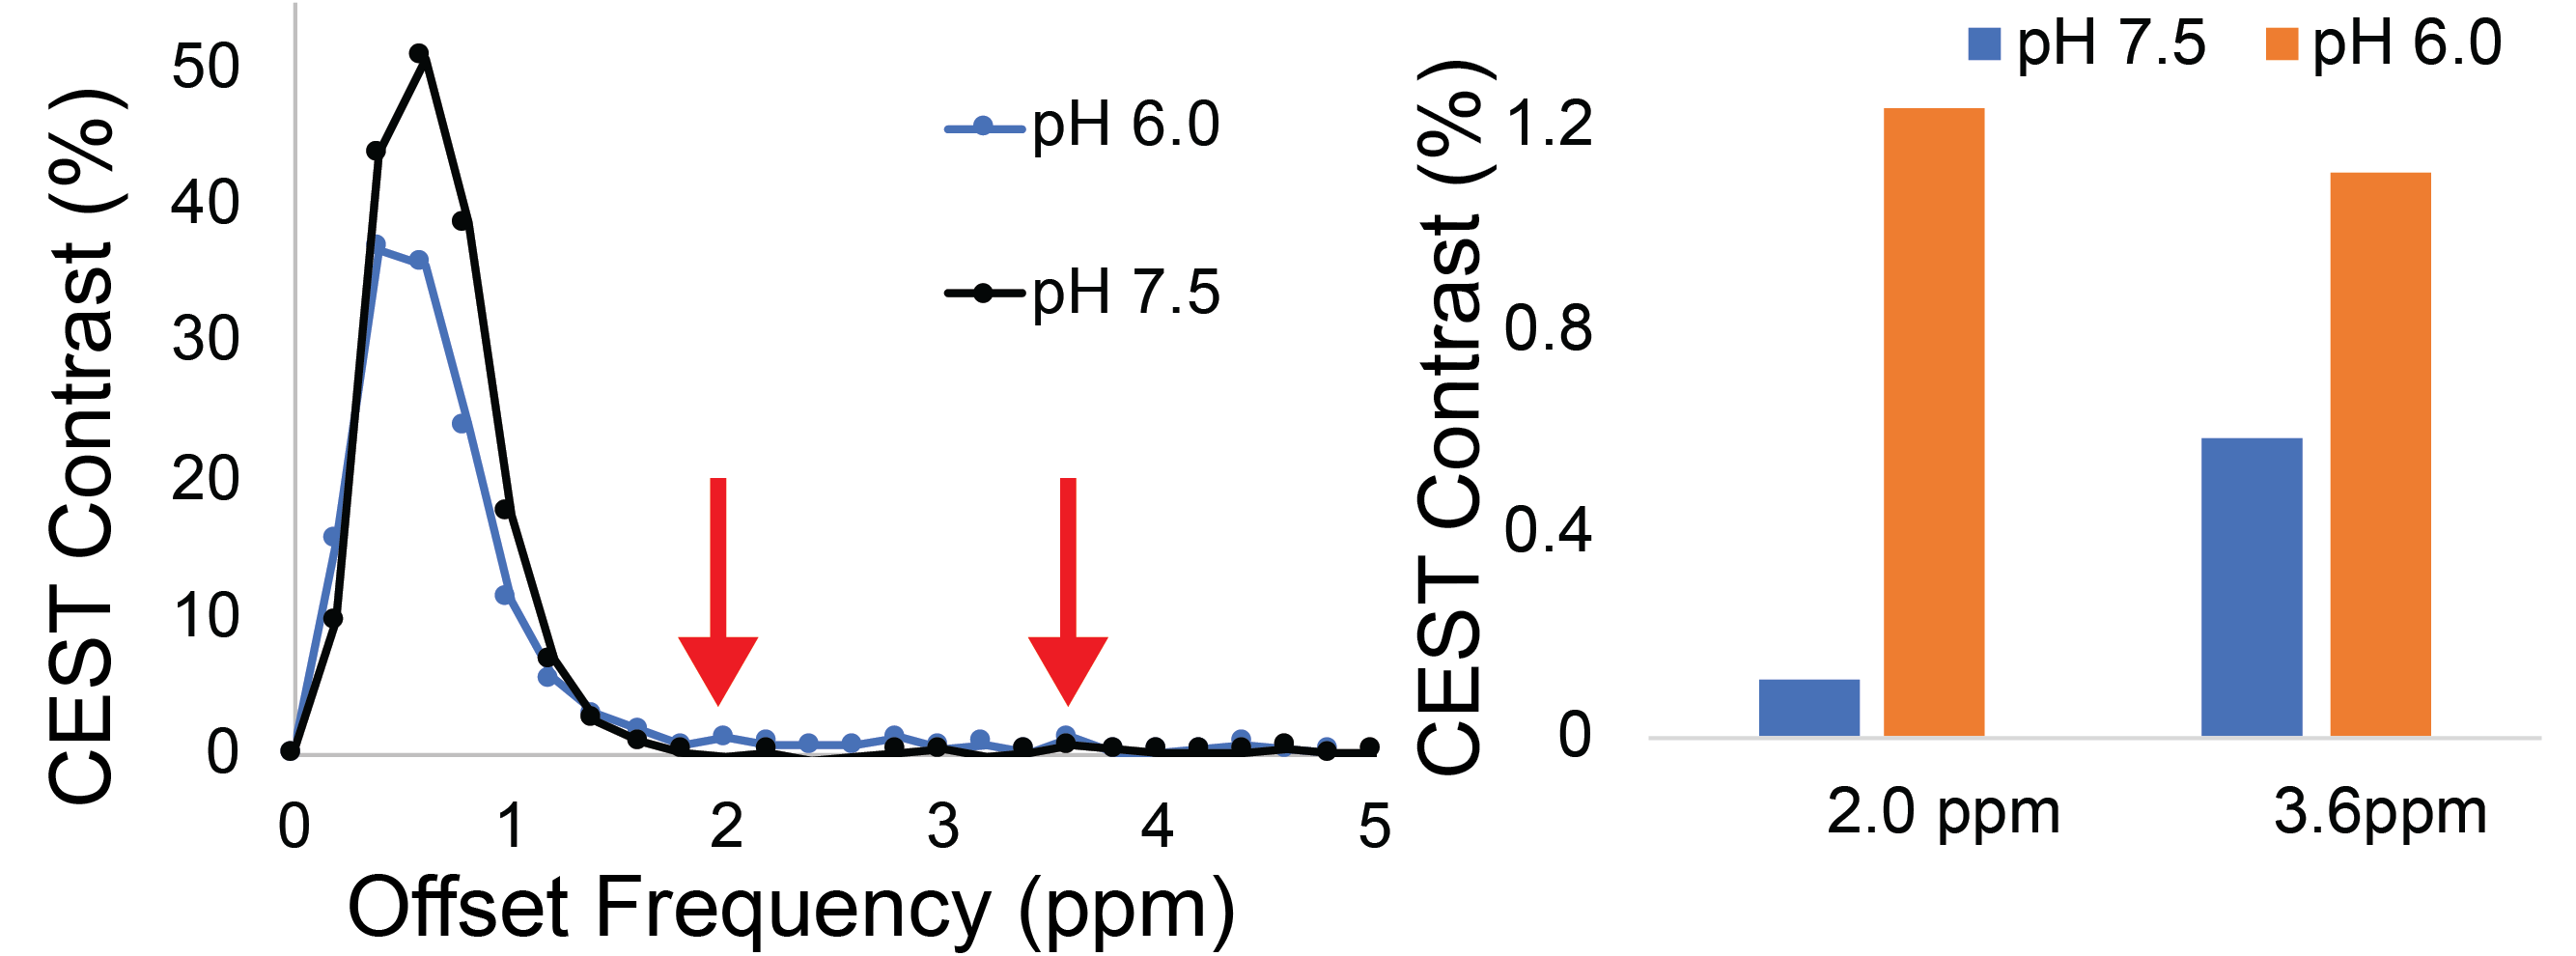
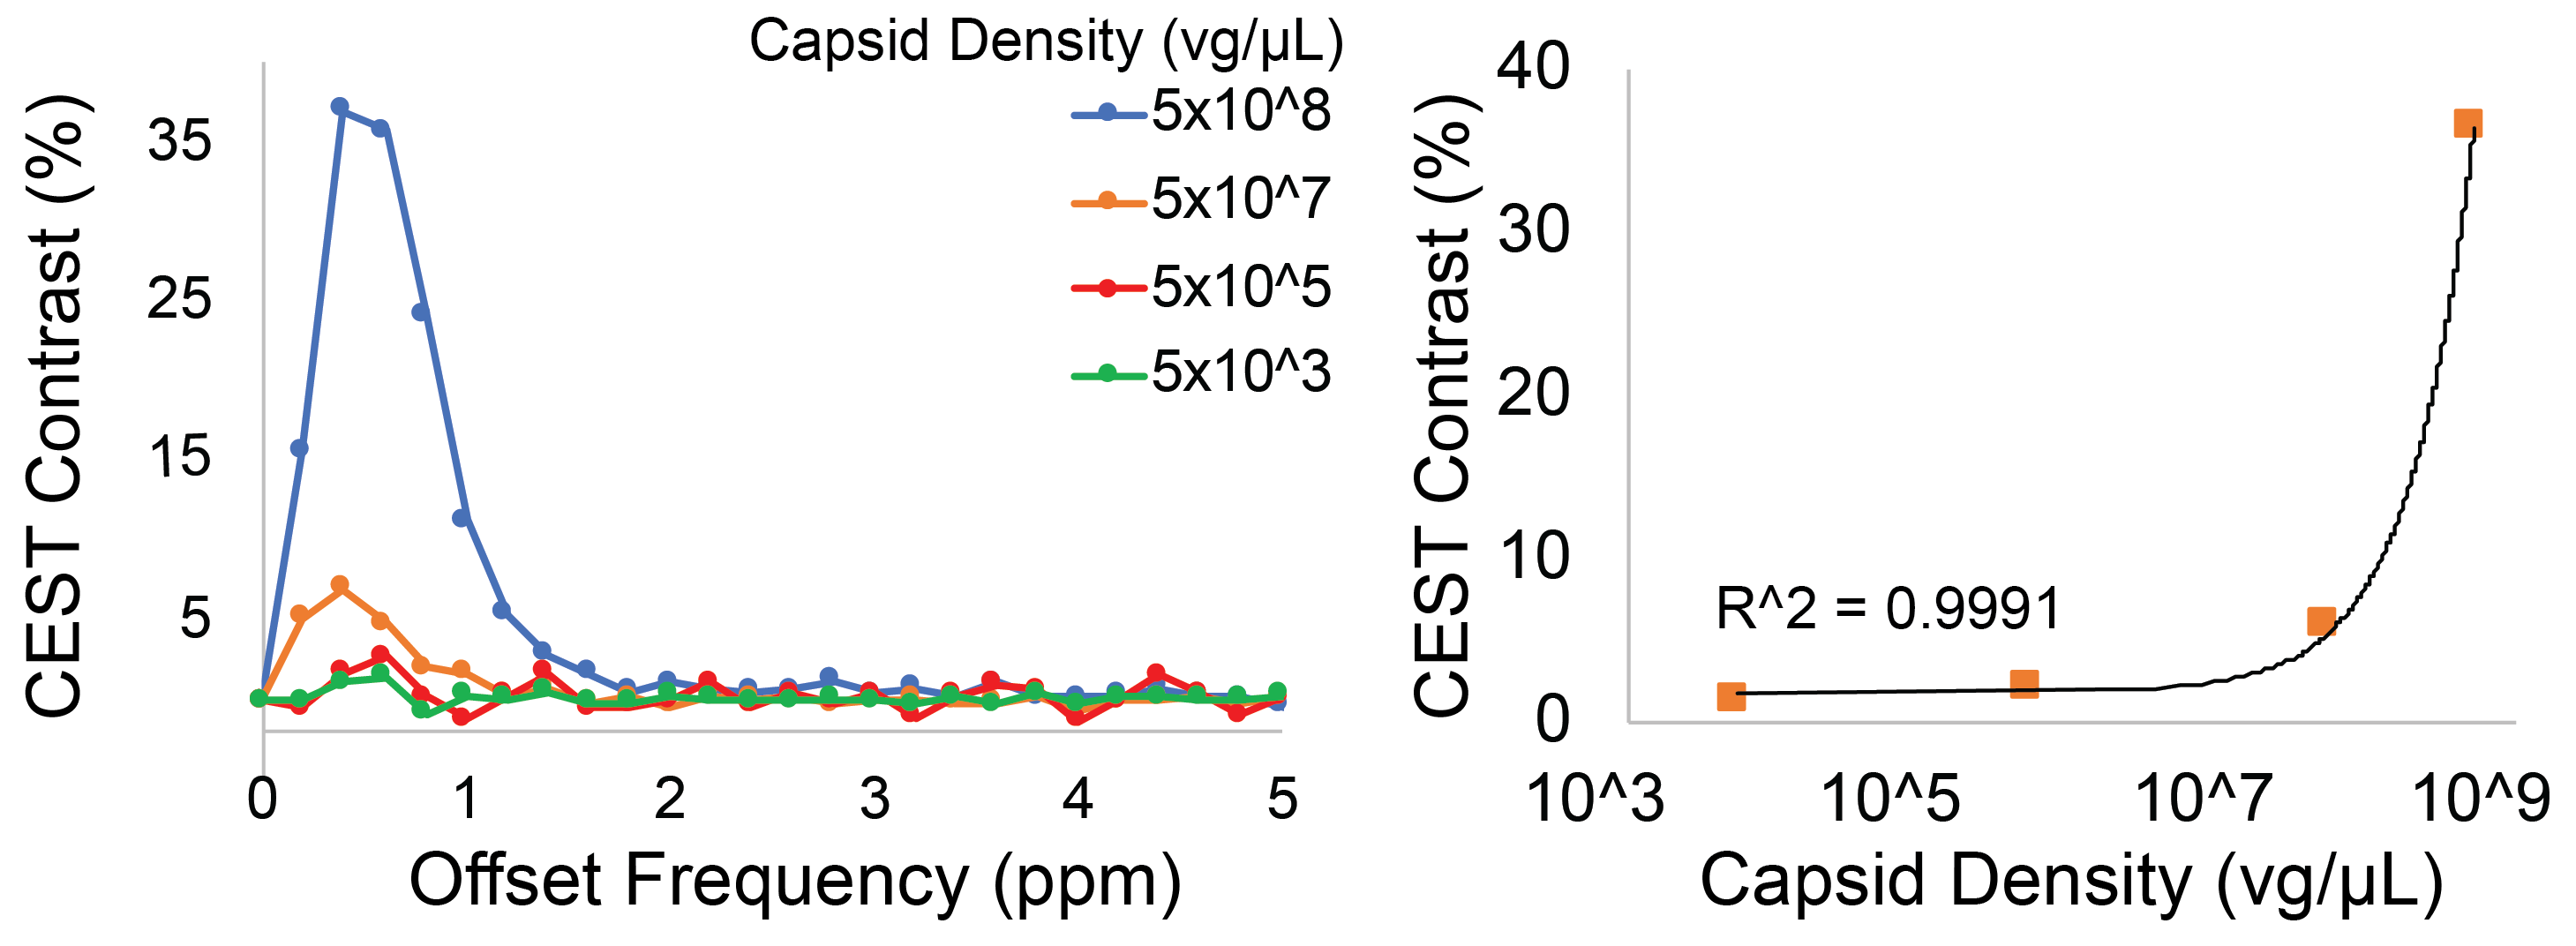
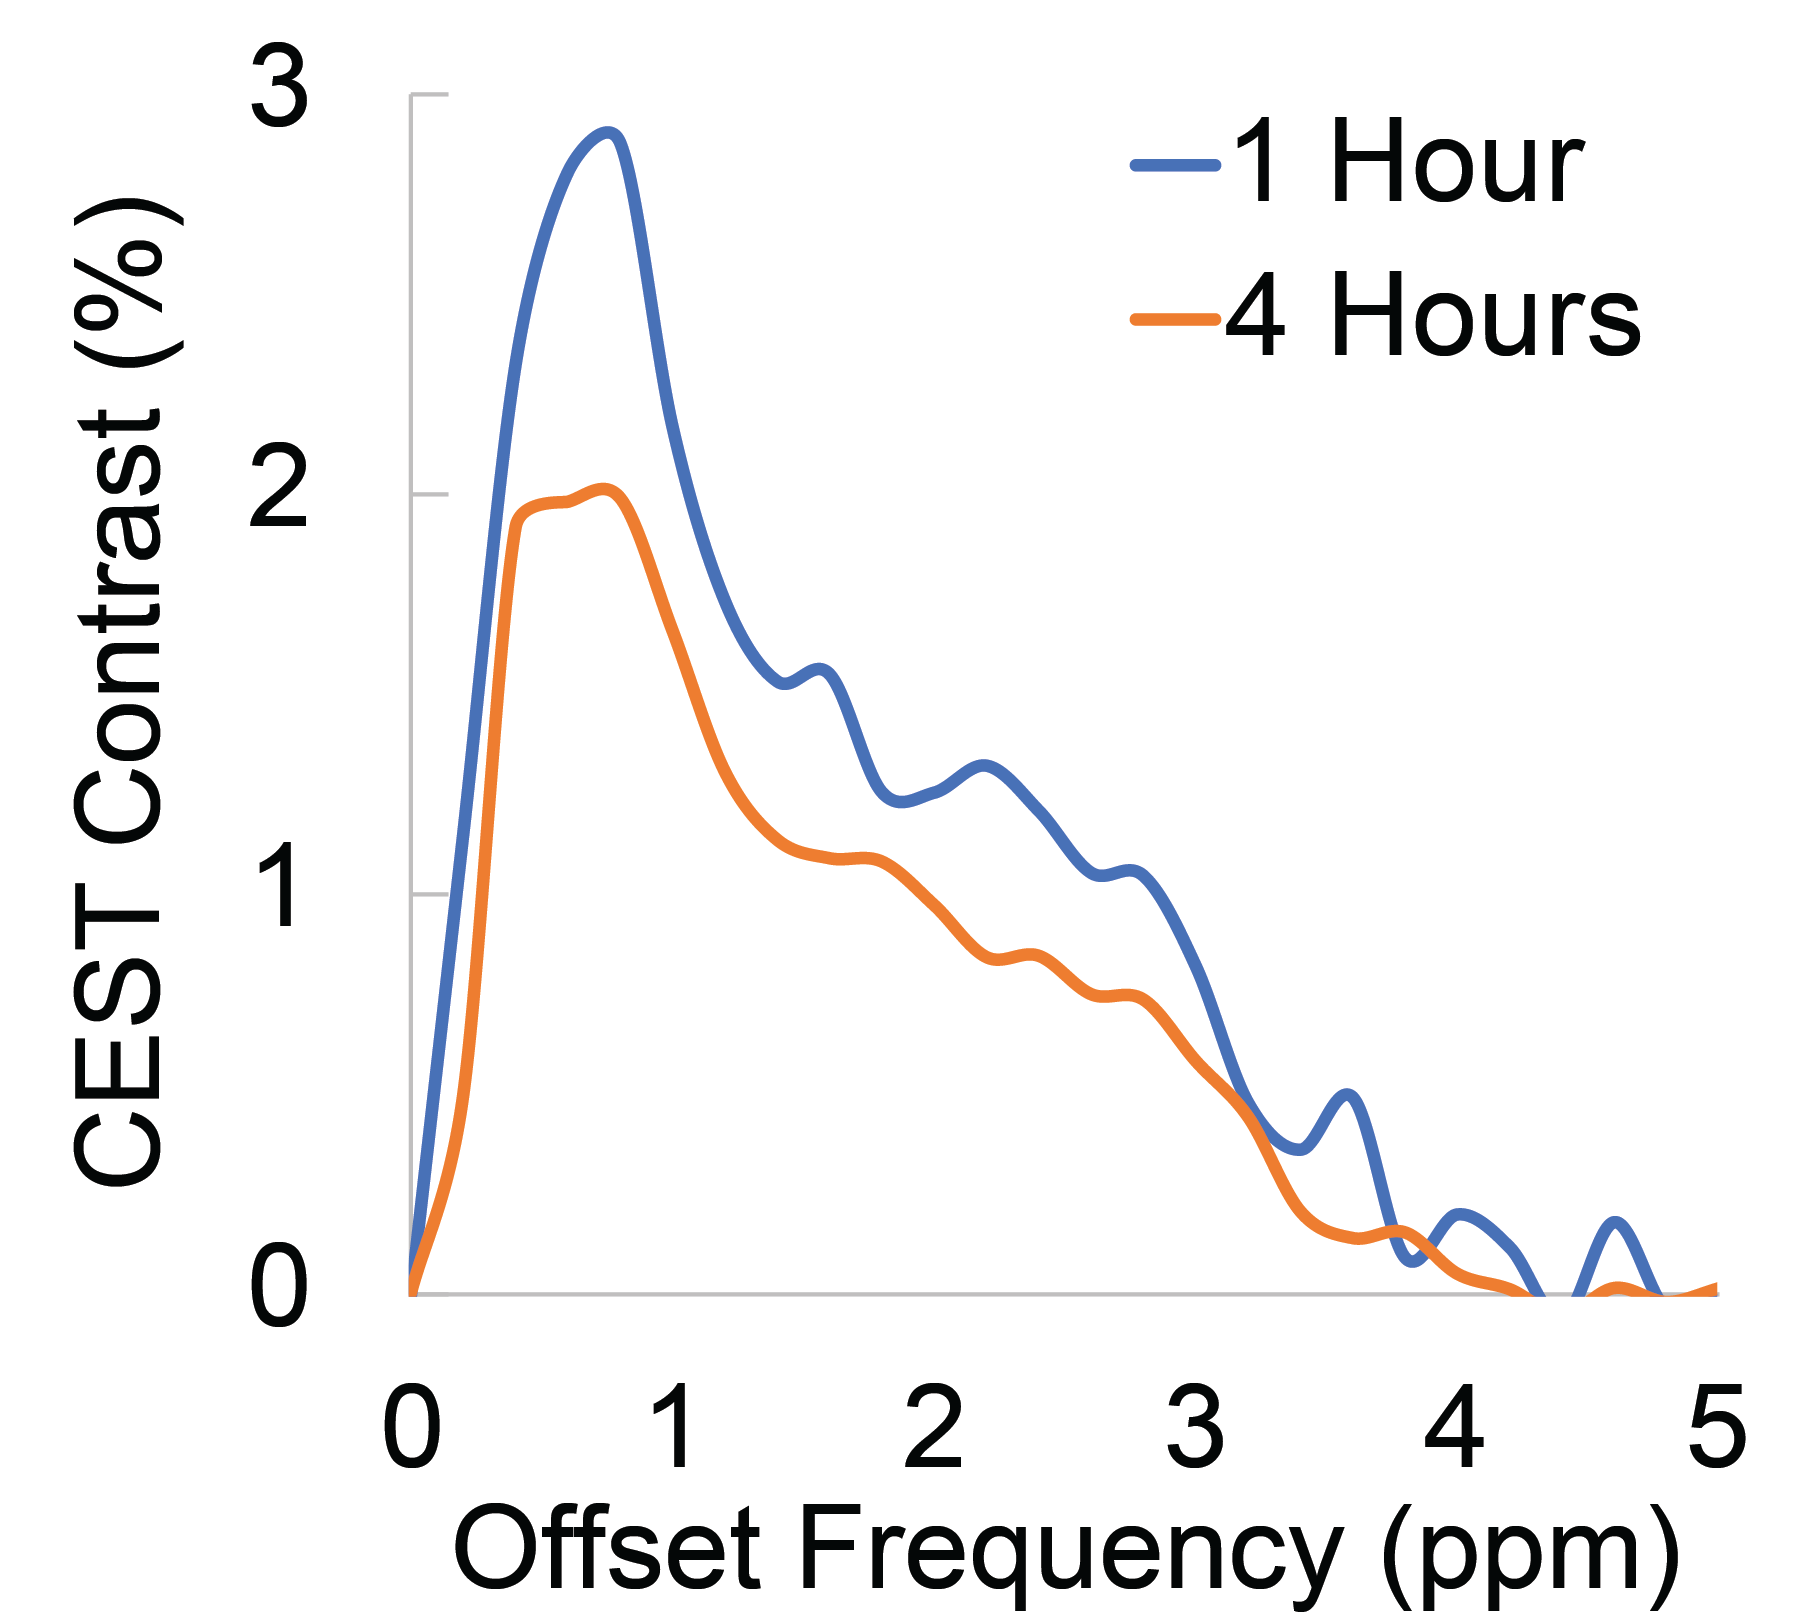
Representative Z-spectra and derived MTRasym spectra for AAV2 and 0.01% poly-L-Lysine are shown in figure 1. While all AAV vectors demonstrated substantial CEST contrast at 0.6-0.8ppm as shown in Figure 2, CEST contrasts at additional offset frequencies were unique to each vector as shown for AAV9 and AAV5 (Figure 2). For AAV2, acidification of buffer to pH 6 reduced CEST contrast at 0.6ppm by 20%, but increased amine CEST contrast at 2.0ppm by 600% and amide CEST contrast at 3.6ppm by over 100% (Figure 3). CEST contrast at 0.6ppm correlated with viral capsid concentration (Figure 4) in solution. Finally, CEST contrast at 0.6ppm measured in endosomes isolated from transduced cells was higher at 1 hour compared to 4 hours post initiation of transduction. This corresponded to RT-PCR measurements of approximately 20k viral genomes/mL and 4k viral genomes/mL at each time point, respectively.Discussion
In designing this study we anticipated that the abundance of 1080 surface lysine residues per viral particle in the capsid structure of AAV2 would generate substantial CEST contrast at amine and amide resonances of 2.8ppm and 3.6ppm, respectively. The increased CEST contrast at these offsets with lower pH values indicates acid based exchange rate catalysis that is unique to lower pH values found during endosomal transport. In juxtaposition, the robust CEST contrast generated by all AAV vectors between 0.6-0.8ppm likely derives from hydroxyl protons within serine and threonine that interact with extravesicular water and are conserved structural elements of AAV capsid proteins across serotypes (2). Finally, CEST contrast assessed at 0.6ppm during different time points post-transduction demonstrated higher contrast than was found in pure viral particle solutions for similar densities of viral genomes. This finding likely points to enhanced labeling efficiency of intra-endosomal water compared to what occurs in viral solution, similar to what is observed when labeling liposomes or other carrier molecules with paramagnetic CEST contrast agents (3). Importantly, at lower field strengths for both pre-clinical (7T) and routine clinical (3T) imaging the contrast generated at 0.6ppm will be significantly reduced due to comparatively faster exchange rates relative to field strength.Conclusion
CEST based NMR experiments revealed that AAV viral capsids generate endogenous CEST contrast due to conserved capsid amino acid structures containing large numbers of exchangeable hydroxyl protons. The ability to exploit this endogenous mechanism may lead to methods by which to quantify delivery of gene editing cargo to target tissues.Acknowledgements
This study was supported by NIH 1R01HL28592, AHA 19TPA34850040 and NIH UH2EB028908.References
1. Meier et al. Scientific Reports. 2018
2. Lee et al. Bioengineering and Biotechnology. 2005
3. Ferrauto et al. Angewandte Chemie. 2017
Figures