0426
Volumetric Renal ASL MRI using 3D TSE Cartesian Acquisition with Variable Density Sampling (VD-CASPR)1Radiology, UT Southwestern Medical Center, Dallas, TX, United States, 2Advanced Imaging Research Center, UT Southwestern Medical Center, Dallas, TX, United States, 3Urology, UT Southwestern Medical Center, Dallas, TX, United States
Synopsis
3D Cartesian turbo spin echo (TSE) is a promising acquisition method for renal ASL because of its improved SNR and compatibility with optimal background suppression (BGS). However, 3D Cartesian TSE with single average can limit its SNR and robustness. In this study, we applied a variable density sampling approach to renal ASL imaging, which acquires the center of the k-space with higher signal averages and improves SNR and robustness without significantly prolonging scan time. We combined this with partial k-space acquired M0 images to compensate for increased scan time, but without compromising perfusion quantification.
Purpose
Single-slice 2D readout is often recommended for renal ASL MRI, because of its compatibility with multiple signal averages, but it suffers from limited spatial coverage [1]. Multi-slice 2D acquisitions are feasible and offer superior anatomic coverage although suffer from suboptimal background suppression (BGS) and low SNR [2]. 3D Cartesian TSE is an alternative to 2D acquisitions because of its improved SNR and compatibility with optimal BGS, and has specifically shown its promises in renal ASL [2-4]. However, 3D Cartesian TSE is often acquired with single average due to its relatively long TRs needed to accommodate larger number of refocusing pulses and to stay within SAR limits. Thus, the purpose of this study was to apply a variable density (VD) sampled 3D Cartesian TSE to renal ASL MRI to improve SNR and robustness, and to combine it with M0 images using partial k-space acquisition to maintain the total scan time [5].Methods
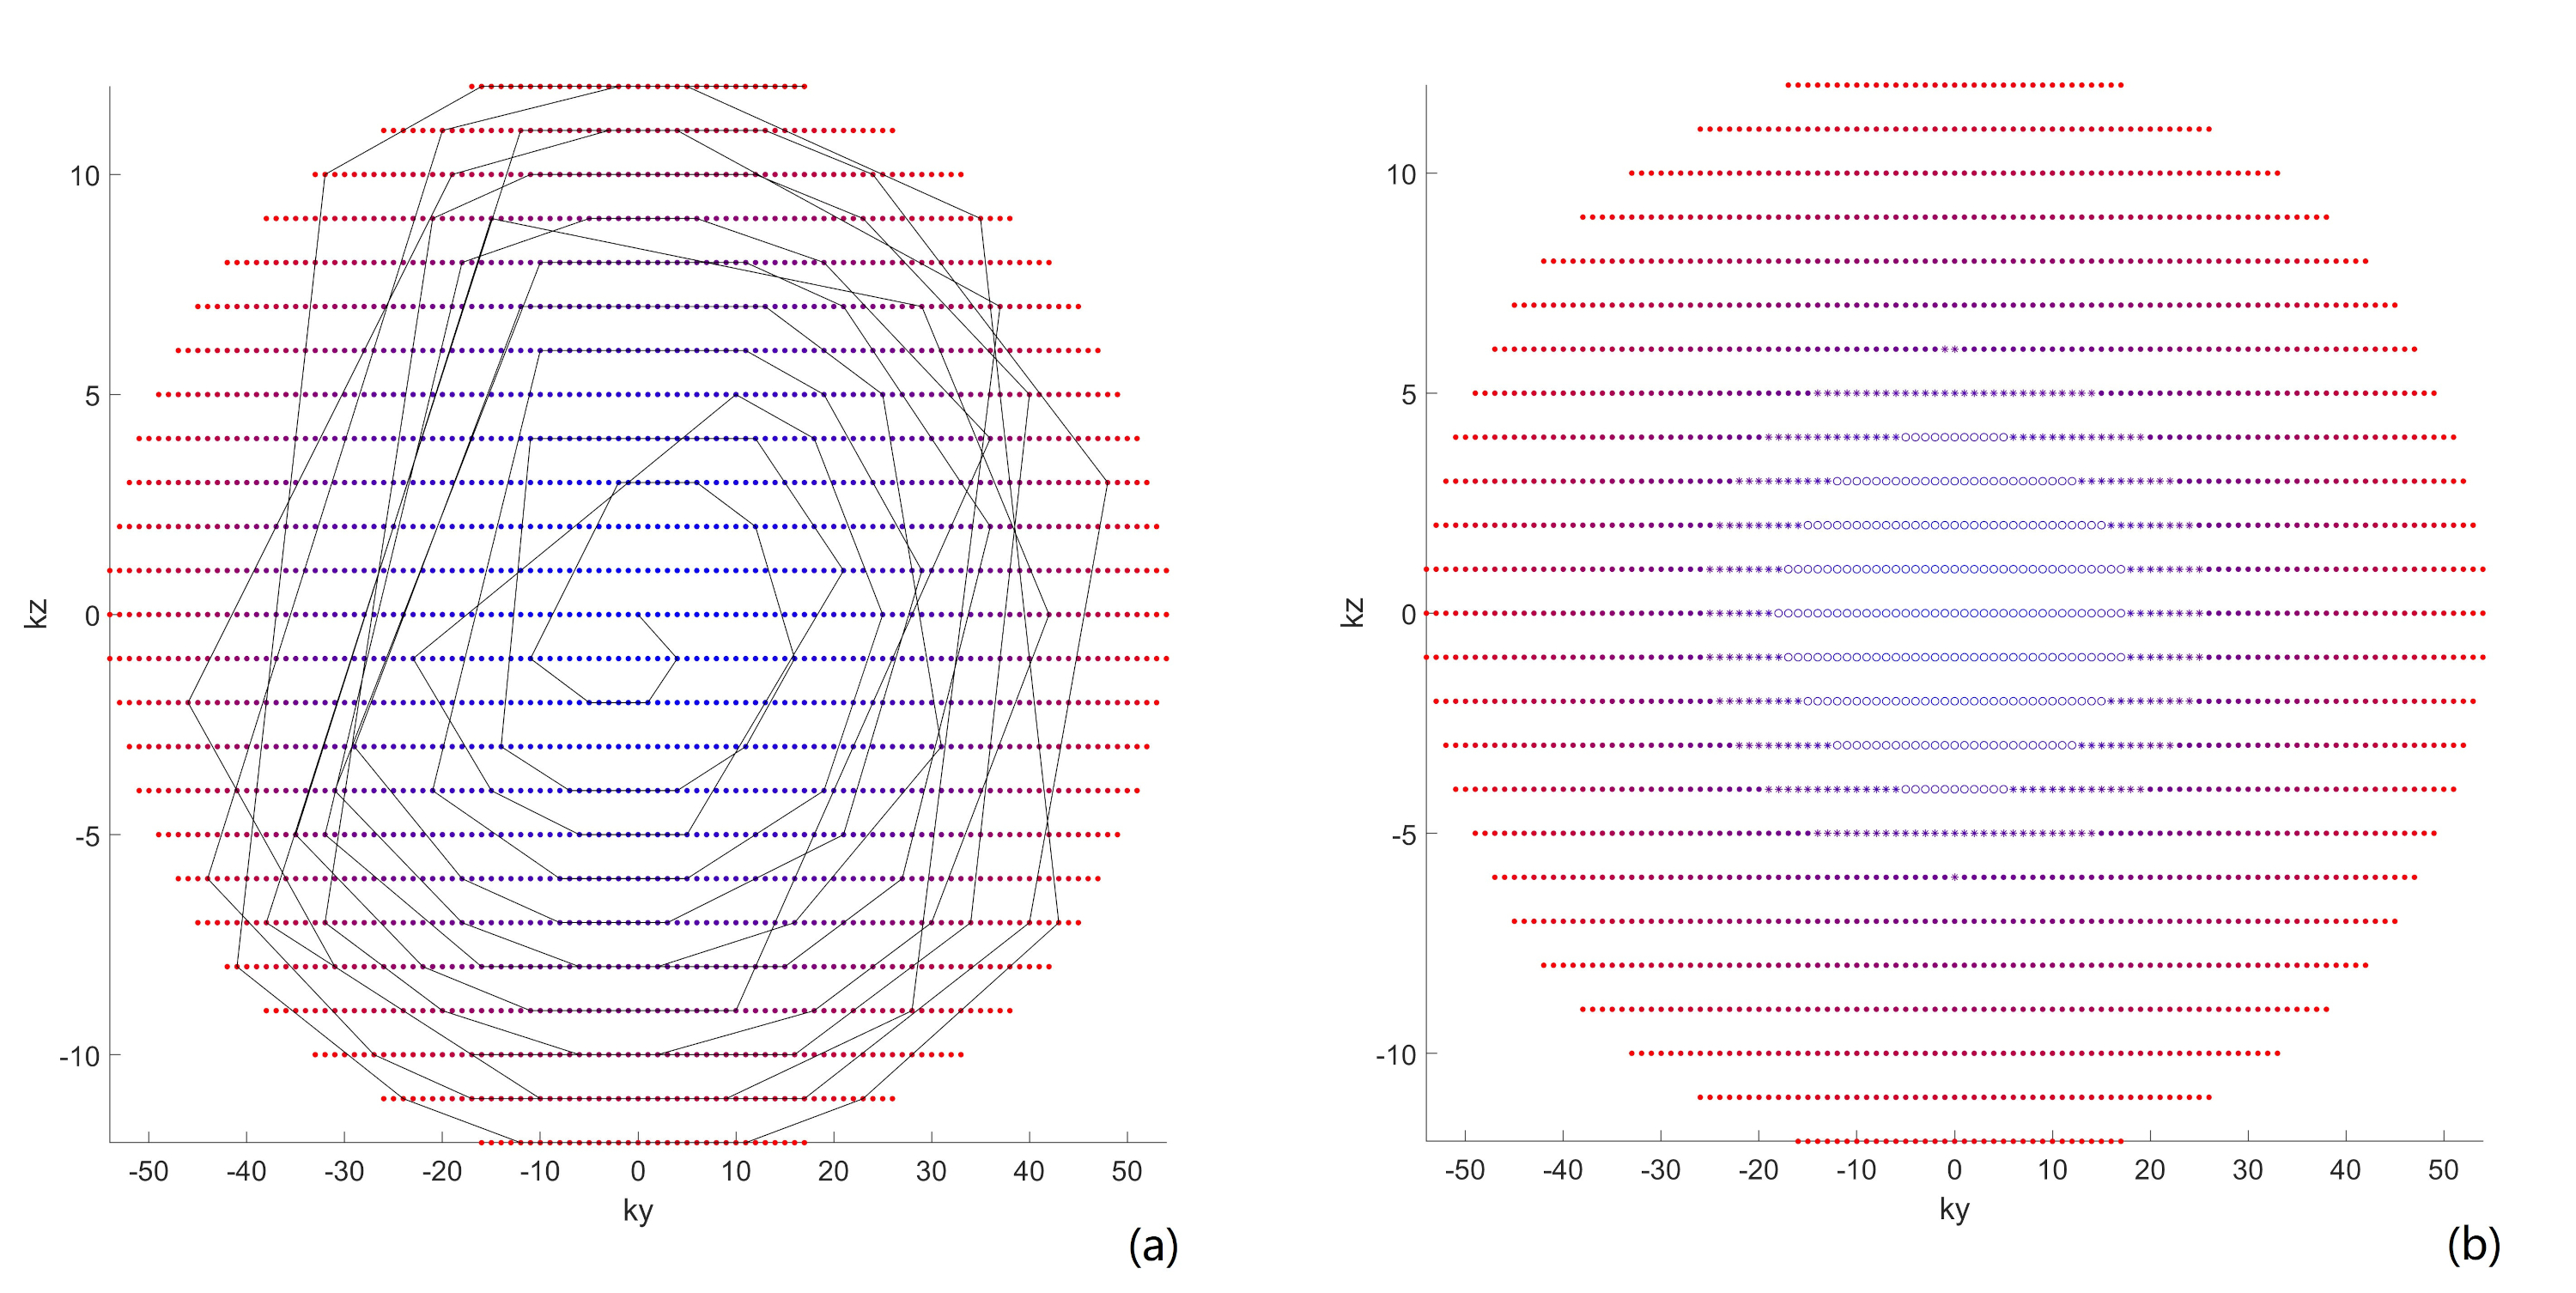
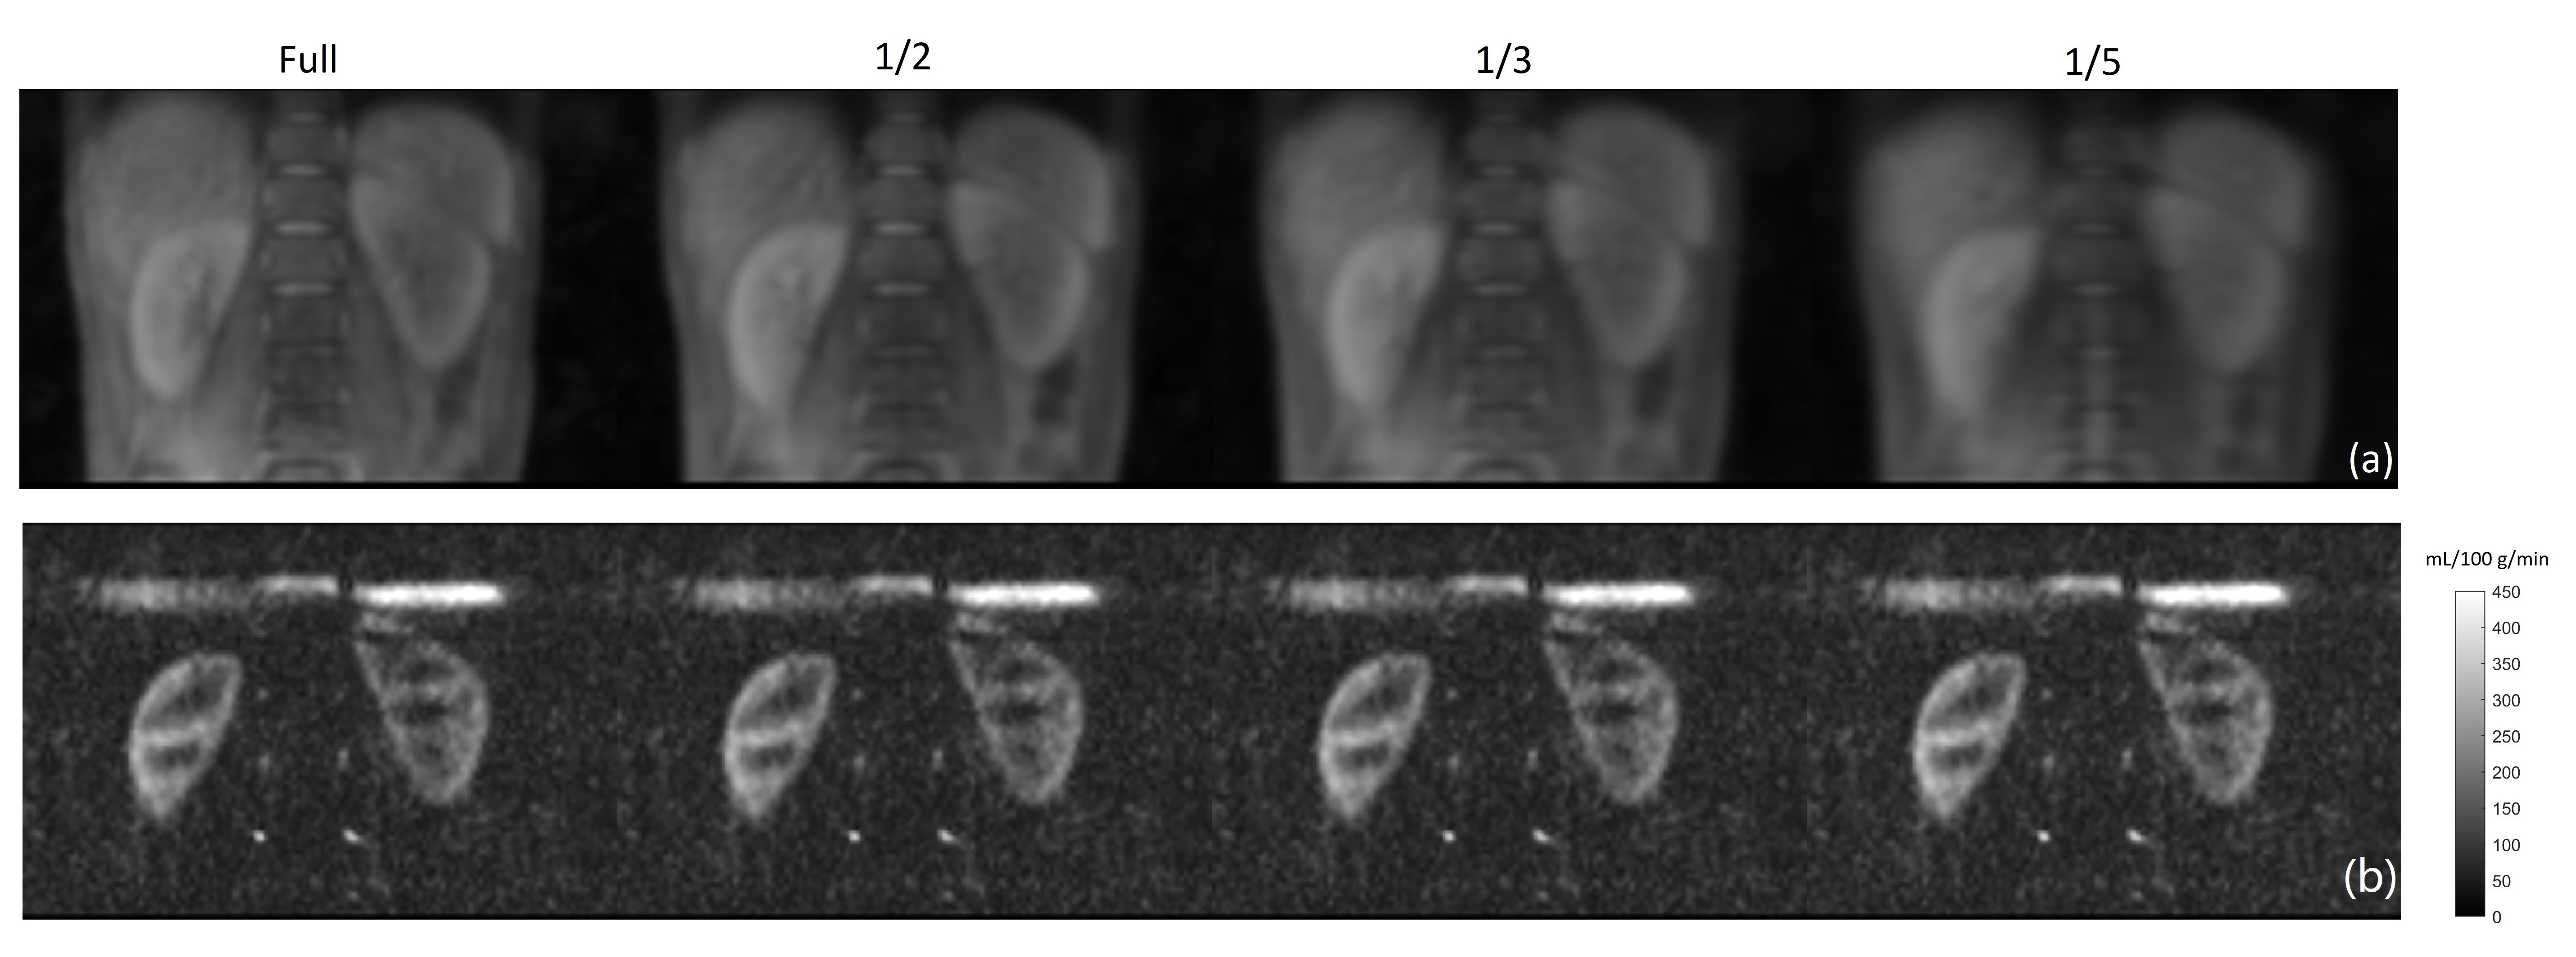
Pseudo-continuous ASL (pCASL) with optimized BGS was used for kidney perfusion imaging, using a 3D TSE Cartesian acquisition with Spiral Profile Reordering (CASPR) (Fig. 1a) [3]. VD-CASPR was defined using 3 regions in the ky-kz space according to their increasing distances from the center of the k-space (Fig. 1b), namely an elliptical region 1 (R1), and annular regions, 2 (R2) and 3 (R3). Each echo train starts sampling from the center of the k-space in a pseudo-spiral trajectory, while still maintaining a Cartesian grid (Fig. 1a, solid line). Profiles at R1, R2, and R3 are acquired with NSA of 3, 2, and 1 respectively, enabling multiple averages of central k-space profiles for improved robustness and SNR.VD-CASPR slightly increases the scan time compared to single-average CASPR. To compensate for this increase in scan time, we adopted partial k-space acquisition for proton-density weighted (M0) images, such that the total scan time for ASL quantification (including ASL and M0) is not increased. M0 images were acquired using single-average 3D TSE-CASPR that acquired 1/2, 1/3, and 1/5 of the central part of a fully acquired k-space. Renal blood flow (RBF) quantification was performed using M0 images with different acquisition ratios.
Four healthy volunteers were scanned on a 3T Philips Ingenia scanner under IRB approval. The imaging parameters for CASPR were: TR/TE = 6500/14 ms, FOV = 220x340x90 mm3, matrix = 76x113 with 30 slices, acquired resolution = 3x3x6 mm3, reconstructed resolution = 3x3x3 mm3, ETL = 120, echo spacing = 2.8 ms, label duration = 1.5 s, post-label delay = 1.5 s, 4 BGS pulses and acquisition time = 4:20 minutes for 1 average. For the VD-CASPR acquisition, the number of profiles in R1 and R2 were set to 2×ETL = 240 in each region, which increased the scan time to 5:38 mins. Due to higher SNR, M0 images were only acquired with single average CASPR, for which the scan time was 2:10 mins with fully acquired k-space, and 1:05 mins, 43 s and 26 s with 1/2, 1/3 and 1/5 acquired k-space respectively.
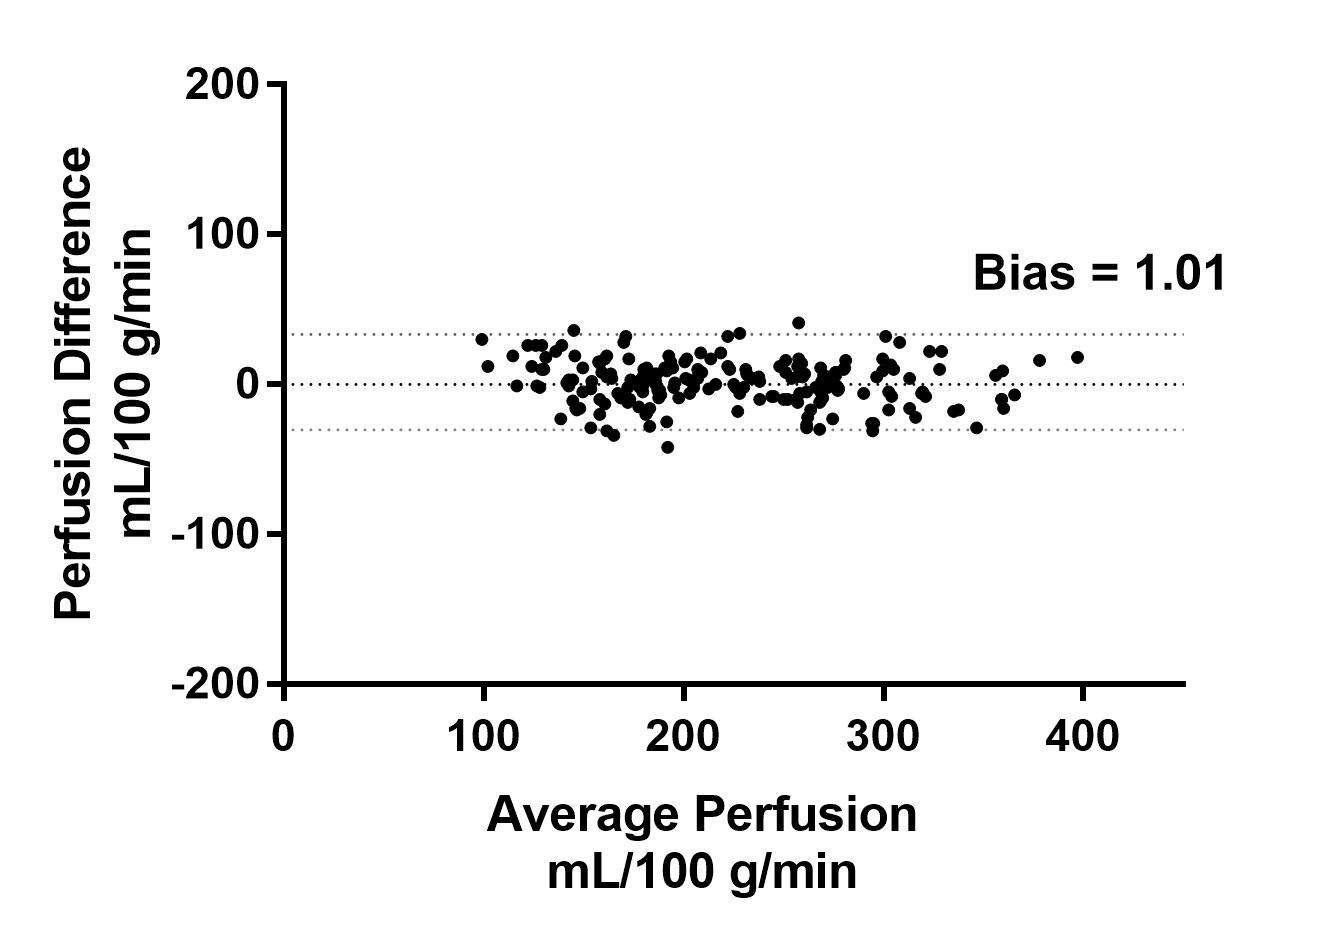
ROIs were drawn on different regions of the renal cortex on RBF maps. The agreement between the quantified mean RBF values in these ROIs was compared, between single-average CASPR combined with M0 using fully acquired k-space (total 6:30 minutes), and VD-CASPR combined with M0 using 1/3 acquired k-space (total 6:21 minutes), using Bland-Altman analysis.
Results
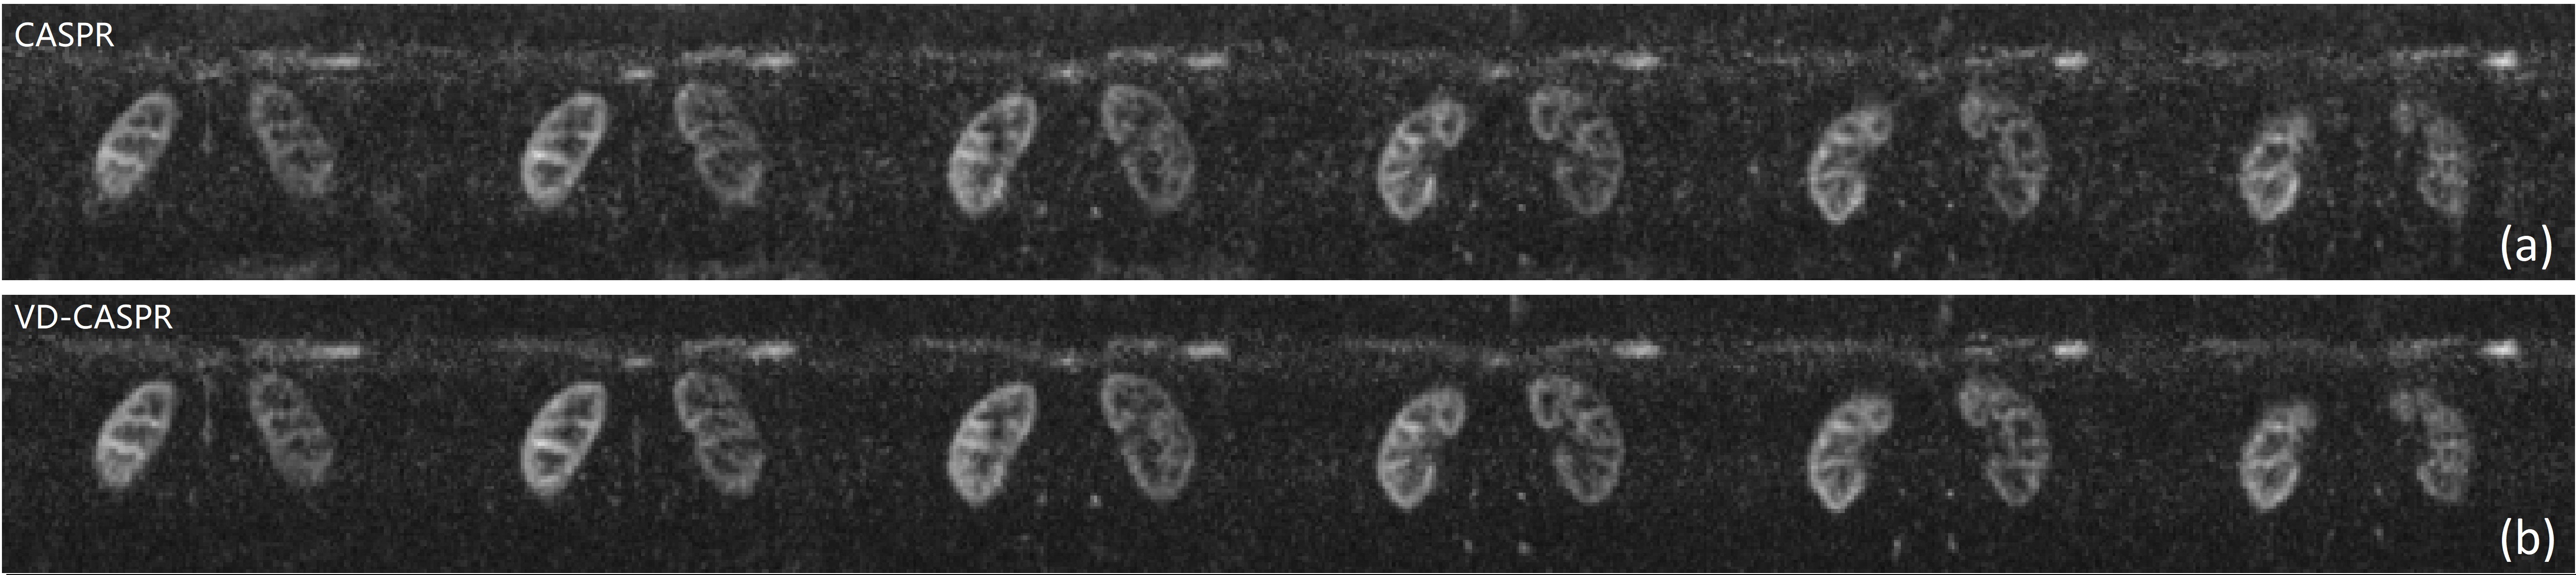
Kidney perfusion weighted images acquired with VD-CASPR showed minimized background noise and improved SNR compared to the single-average CASPR acquisition (Fig. 2). M0 images with partial k-space showed similar signal intensities overall compared to images with fully-acquired k-space, although are more blurred as expected (Fig. 3a). Nevertheless, the RBF maps calculated using M0 images acquired with different ratios of the central k-space showed overall similar values compared to the RBF maps calculated using M0 images with fully-acquired k-space (Fig. 3b). The RBF values measured in kidney ROIs showed good agreement, between single-average CASPR combined with M0 images using fully acquired k-space, and VD-CASPR combined with M0 images with 1/3 acquired k-space (Fig. 4). The total scan time for VD-CASPR and M0 with 1/3 acquired k-space is 6:21 mins, slightly shorter than single-average CASPR and M0 with fully acquired k-space (6:30 mins).Conclusions
We applied VD-CASPR method to renal ASL MRI, which acquires the center of k-space with multiple NSAs, thus minimizes noise and improves SNR and robustness of renal ASL MRI. VD-CASPR was then combined with the partial k-space acquisition for M0 images to retain the total scan time, without introducing significant bias to RBF quantification. The application of VD-CASPR may be of particular benefit to renal ASL, given its challenges from SNR and acquisition variations.Acknowledgements
This work was partly supported by the NIH/NCI grant U01CA207091.References
[1] Nery, F et al. MAGMA 2020; 33(1):141-161.
[2] Robson, PM et al. Acad Radiol 2016; 23(2):144-154.
[3] Taso, M et al. MRM 2019; 82(2):680-692.
[4] Greer, JS et al. MRM 2019; 82(5):1713-1724.
[5] Wang, Y et al. ISMRM 2020; 3281.
Figures