0423
High-resolution kidney MRI in mice for longitudinal tracking of kidney volume and cyst burden1Calico Life Sciences LLC, South San Francisco, CA, United States
Synopsis
We present an improved imaging and data analysis strategy for kidney MRI in mouse models of polycystic kidney disease. By registering multiple high resolution datasets at lower SNR, slow movement is compensated for and high resolution datasets with high quality and fine detail are achieved, allowing for detection and longitudinal tracking of kidney volume as well as cyst number and size. We established automatic cyst detection and are developing automatic kidney segmentation, for accurate and reliable assessment of polycystic kidney disease in mouse models.
Introduction
Polycystic kidney disease (PKD) is affecting more than 10 million patients globally leading to impaired quality of life, kidney failure and premature death. Limited treatment options for PKD are in part due to the need to test drug candidates in early disease stages when kidney function is not impaired. Preclinical MRI can assess change in kidney size and development of renal cysts, both of which are surrogate markers for disease progression1,2. For this, MR images of high resolution in three dimensions with high contrast between both cysts and tissue as well as between kidney and surrounding tissue are needed. However, high resolution MRI of mouse kidneys is notoriously difficult: limited SNR requires long acquisition times, and even slightest movement over the time of data acquisition causes artifacts and blurs out small details. While high resolution has been achieved using cryogenically cooled surface coils3,4, the FOV of mouse cryocoils is limited to one kidney only. Here, we present an improved method for data acquisition, post-processing and analysis of high-resolution renal MRI in PKD.Methods
All animal procedures were approved by the IACUC and followed AAALAC guidelines. Animals received a s.c. injection of 0.4 mg/kg atropine approx. 20 minutes before imaging to slow down peristaltic motion. Mice were anesthetized with isoflurane (2%) and kept at 37±0.5°C. Imaging was performed on a 9.4T Bruker Biospec. Animals were placed supine, with their abdomen on a 4-channel cardiac array. We used a breathing-gated multi-TE RARE sequence with 10 spin echoes, where 5 echoes were reconstructed into one image each (effective TE 25 and 60 ms). FOV was 32 x 32 x 8.4 mm, resolution 125 x 125 x 300 μm3, TR 2.35 s. 8 repetitions were acquired. Acquisition time was 16 min, effective acquisition time with gating for breathing approx. 25 min. In this study, Pkd1RC/RC mice5,6 , a genetic model for polycystic kidney disease (courtesy of the Eduardo Chini lab at the Mayo clinic), 5 females, 6 males, age: 36 weeks, average body weight: 19 gr and 25 gr (respectively), were imaged 3 times over the course of 15 weeks. To compensate for slow movement over time, the 8 repetitions were visually scored to exclude images with breathing artifacts or blurring, and coregistered to compensate for slow movement over time using elastix7. Kidneys were initially segmented semi-manually in ITK-Snap, and cysts were automatically detected on masked kidneys using an algorithm motivated by corner detection involving differences of gaussians in 3D. We applied differences of pairs of gaussians over a range of kernel sizes so as to capture cysts of different sizes followed by relu and max pooling over the pairs to generate a single score at each position. Finally, the scores are binarized using otsu thresholding, followed by erosion. We use a connected components algorithm to delineate the individual cysts. The pooling procedure was chosen based on a subjective assessment of accuracy and robustness, and inspired broadly by recent deep-learning algorithms. In the creation of this heuristic, one auxiliary consideration was whether the renal pelvis could be consistently captured as the largest connected component in each kidney. We did not pursue a supervised deep-learning based solution because we did not have ground truth annotations, and we hope to address this with future work. Kidney segmentation masks are being used to build and train a train a deep-learning model based on V-net8 for mouse kidney segmentation from MR images, in order to automate analysis in future studies.Results
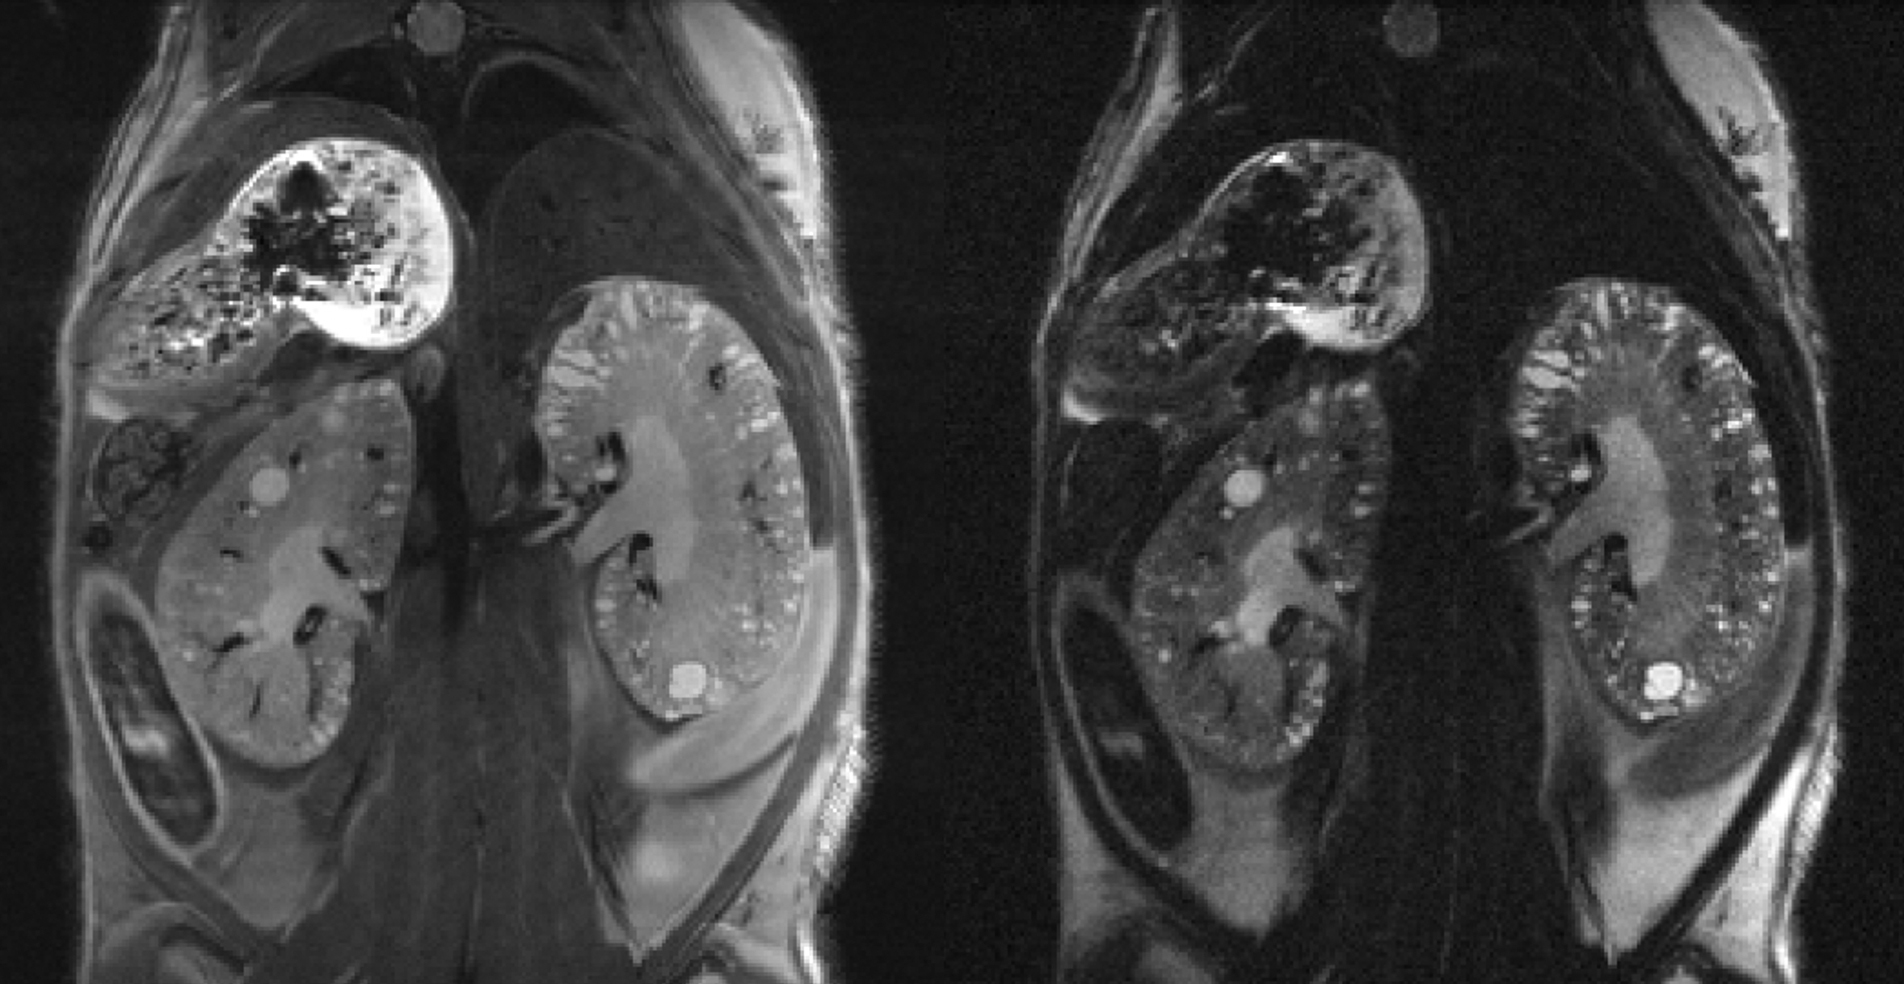
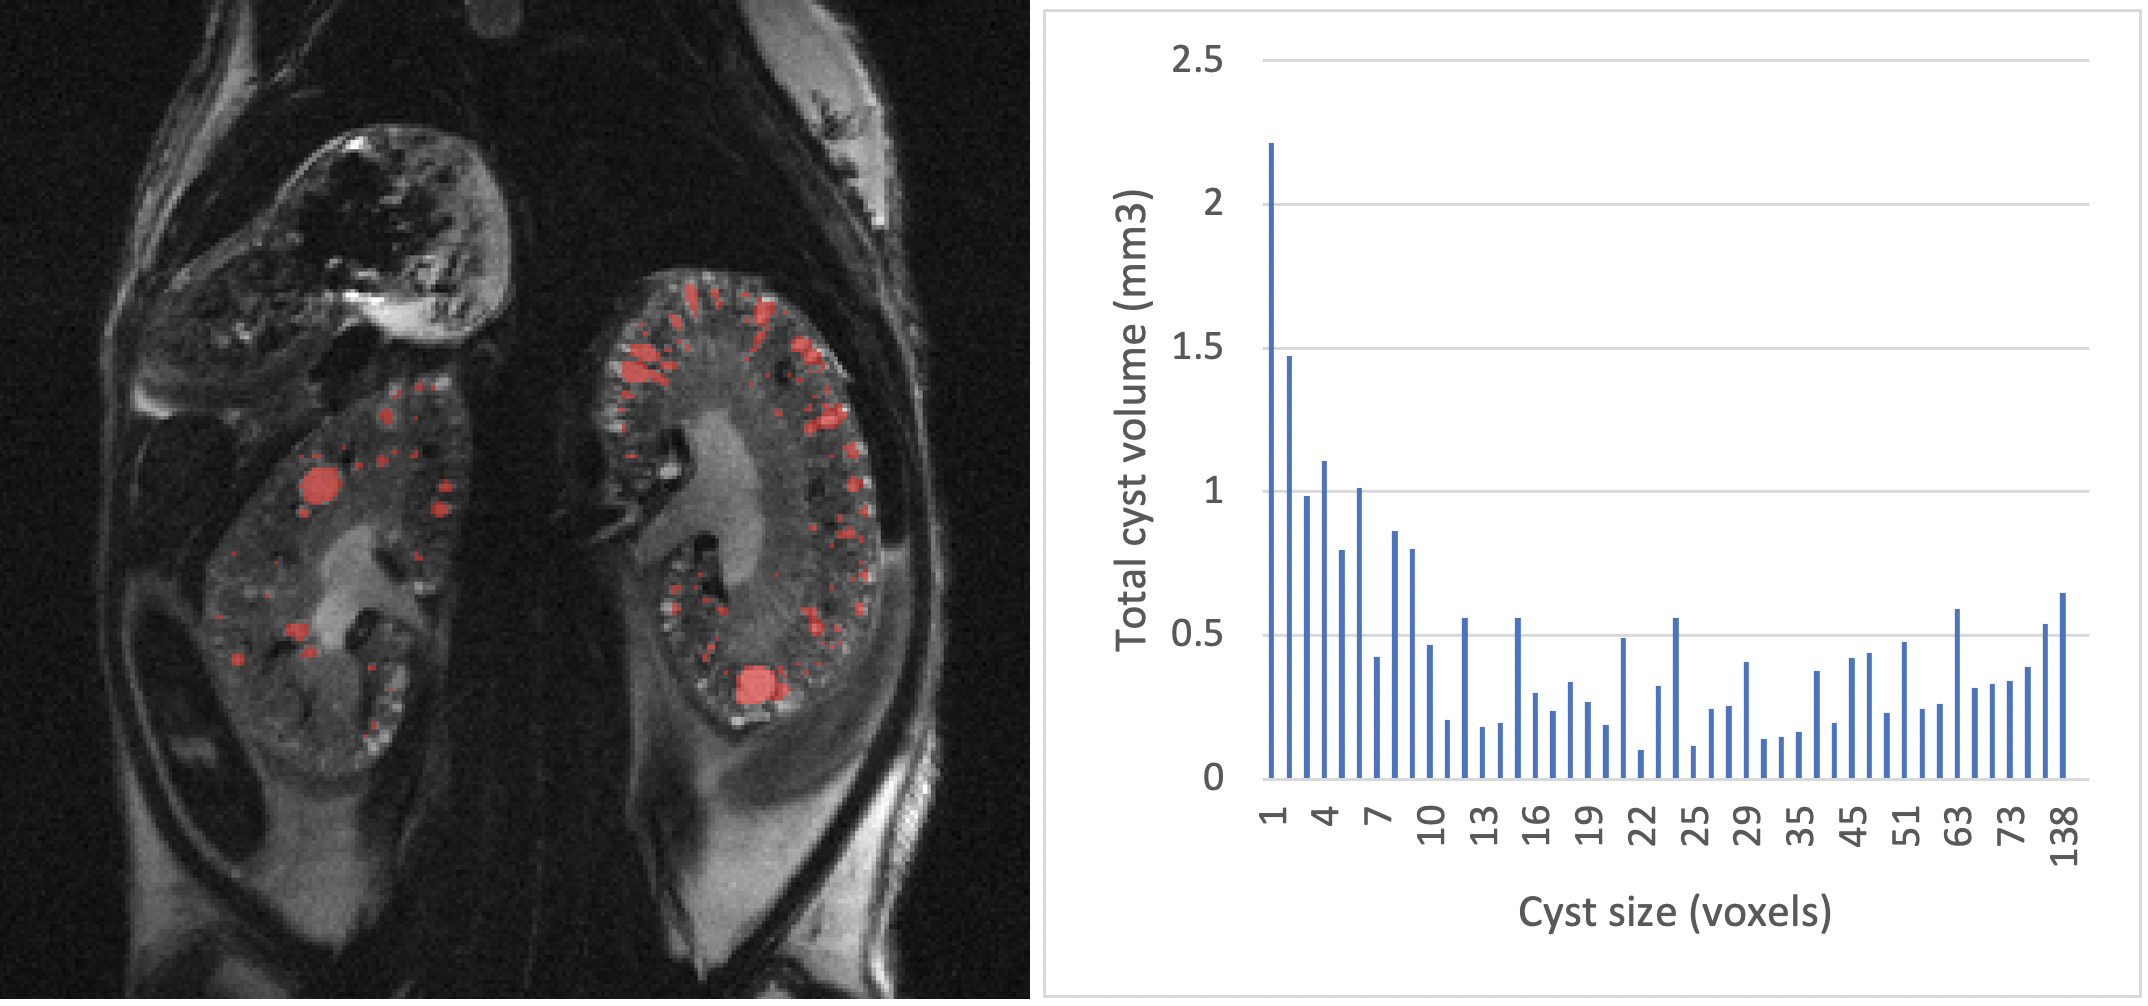
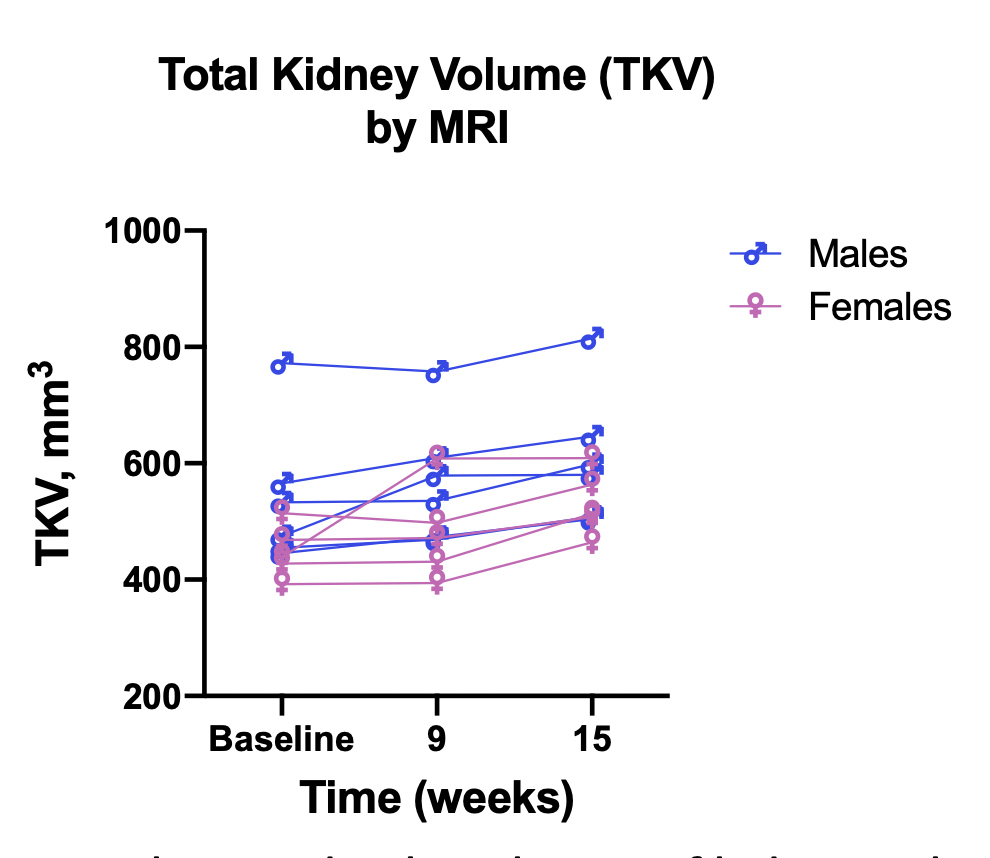
Single repetition images showed low SNR, but sharp boundaries of kidney surface and cysts. Peristaltic motion was slowed down considerably by atropine injection, but slight shifts in position between repetitions could be observed. Coregistration of the repetitions resulted in artifact-free images with clear and sharp boundaries (Fig. 1). Automatic cyst detection was able to label and detect cysts appearing bright in the longer TE image. An exemplary histogram of cyst size and count from one animal is shown in Fig. 2. Analysis of total kidney volume over the duration of the study showed growth in kidney size, consistent with expected disease progression (Fig. 3).Discussion and Conclusion
Our results show notable improvements in quality of anatomical kidney MRI and unprecedented resolution using conventional coils and imaging sequences. This allows for more accurate determination of kidney volume, cyst size and distribution by reducing partial volume effects and minimizing blurring and artifacts due to physiological motion over the acquisition time. Our approach for automatic cysts detection combined with a prototype algorithm for kidney segmentation enables reliable longitudinal tracking of kidney volume and cyst burden changes, facilitating rapid testing of drug candidates.Acknowledgements
No acknowledgement found.References
1 Kidney International (2008) 73, 778–781; doi:10.1038/sj.ki.5002771;
2 Kidney International (2004) 65, 1511-1516; doi:10.1111/j.1523-1755.2004.00532.x
3 NMR in Biomedicine (2014), Vol 27, no. 9, pp 1094-1102; doi:10.1002/nbm.3162
4 Front. Pharmacol., 12 November 2015; doi:10.3389/fphar.2015.00255
5 IEEE Transactions on Medical Imaging, vol. 29, no. 1, pp. 196 - 205, January 2010.
6 PKD1RC/RC mouse model developed by Dr. Peter C. Harris, Mayo Clinic, Rochester, MA, USA
7 J Clin Invest. (2012) ,122(11): 4257–4273; doi: 10.1172/JCI64313
8 https://arxiv.org/abs/1606.04797
Figures