0422
MR imaging of tuberous sclerosis complex in kidneys1Department of Radiology and Biomedical Imaging, University of California, San Francisco, San Francisco, CA, United States
Synopsis
There is a critical need for the development of non-invasive imaging strategies for tuberous sclerosis (TSC) derived tumor lesions in order to monitor the progression and therapeutic efficacy of this multi-system genetic disease. In this study, we investigated the ability of multiparametric 1H MRI (morphological T2-weighted and functional diffusion-weighted) to meet this need in a preclinical murine model of TSC treated with everolimus. Results indicated that proton MR imaging was able to capture the changes in cellularity and tumor size, post treatment.
Purpose
Tuberous sclerosis (TSC) is an inherited genetic disorder characterized by mutations in TSC1 or TSC2 class of tumor suppressers which impacts several organs including the kidney1. The renal manifestations are usually in the form of angiomyolipoma (AML, in 80% of the cases) and are the main cause of mortality and morbidity in TSC patients. And imaging assessment of disease prevalence is essential for management of this disease. mTOR inhibitor (everolimus) is the first line of therapy for asymptomatic AML. Early treatment prevents the progression of AML, however, evidence suggests that the tumors regrow upon cessation of therapy implying a lifelong need for monitoring and management of this morbid disease2,3. Thus, there is a critical need for development of imaging strategies to monitor response to therapy. In this study we evaluated the potential of multiparametric 1H MRI to monitor tumor response to therapy in a preclinical model of TSC.Materials and methods
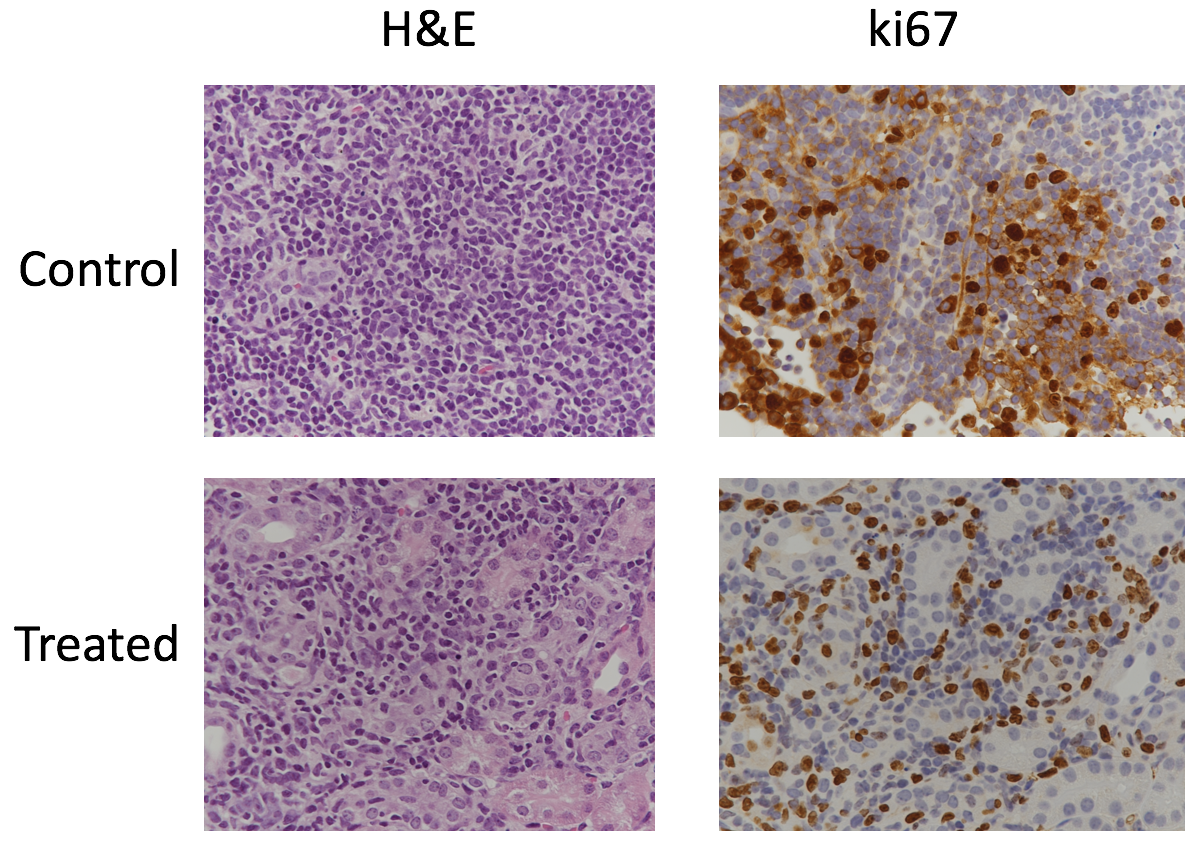
Six male A/J strain Tsc2+/- mice were studied in this project (n = 3 control and n = 3 treatment ). Everolimus (RAD001) was administered daily. Studies were performed using a vertical wide bore 14.1T scanner (1,000 mT/cm gradients, Agilent) equipped with a millipede 40 mm 1H coil for anatomic imaging. High resolution T2-weighted images were acquired for anatomic references using a fast spin-echo sequence and the following parameters: field of view, 30 x 30 mm; matrix size, 256 x 256; repetition time, 3 s; echo time, 10 ms; NEX, 2; slice thickness 1 and 0.5 mm and at axial and coronal orientation. High resolution 3D T2-weighted images were acquired using a fast spin-echo sequence and the following parameters: field of view, 30 x 30 x 64 mm; matrix size, 256 x 256 x 64 (128 for comparison with 0.5 mm thick slices); NEX, 2. Diffusion-weighted images were acquired using the following parameters: matrix size, 128 × 128; field of view, 30 × 30 mm; slice thickness, 1 mm; b-values of 25, 180, 323, 508 s/mm2. Post-acquisition of baseline imaging, the mice were treated with respective therapies and imaged once a week with the same imaging protocol as baseline for a total of three weeks post-therapy. Apparent diffusion coefficient (ADC) maps were generated as previously described4 and mean tumor ADCs were estimated via regions of interest (ROIs). Statistical analysis was conducted using t-test, one way and two-way ANOVA. Tumors were harvested and processed for immunohistochemistry post week 3 imaging and tumor sections were stained with hematoxylin and eosin (H&E) and ki67.Results
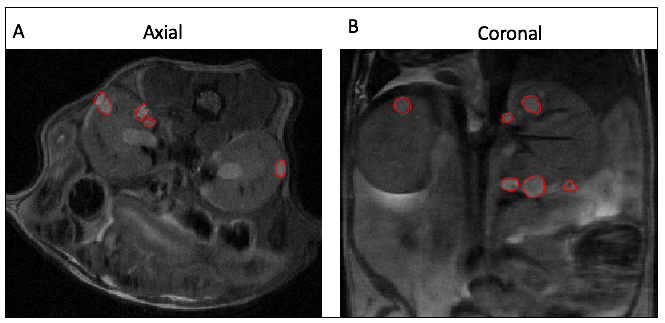
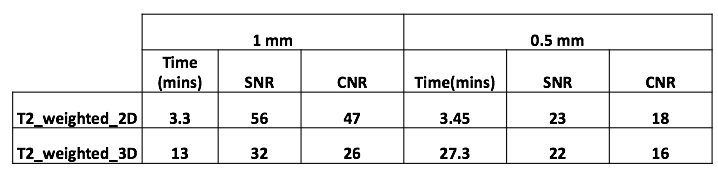
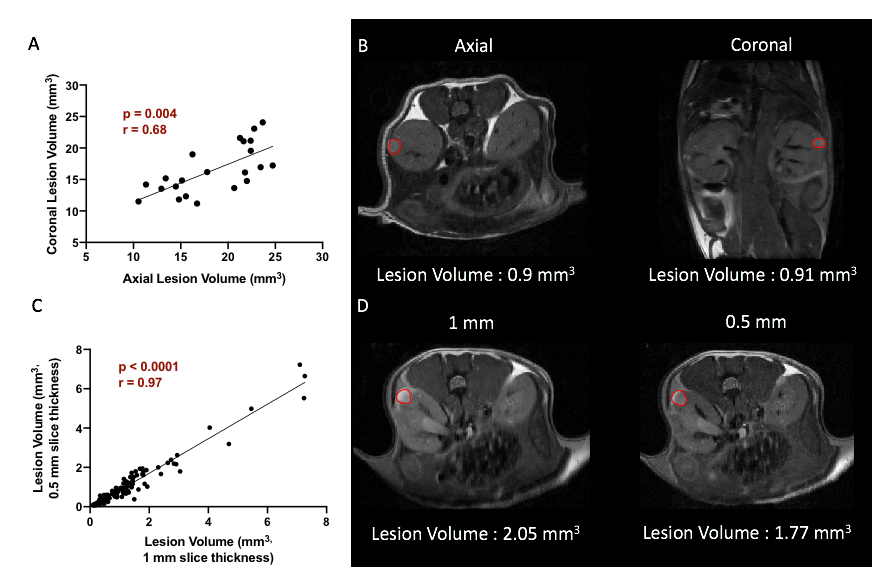
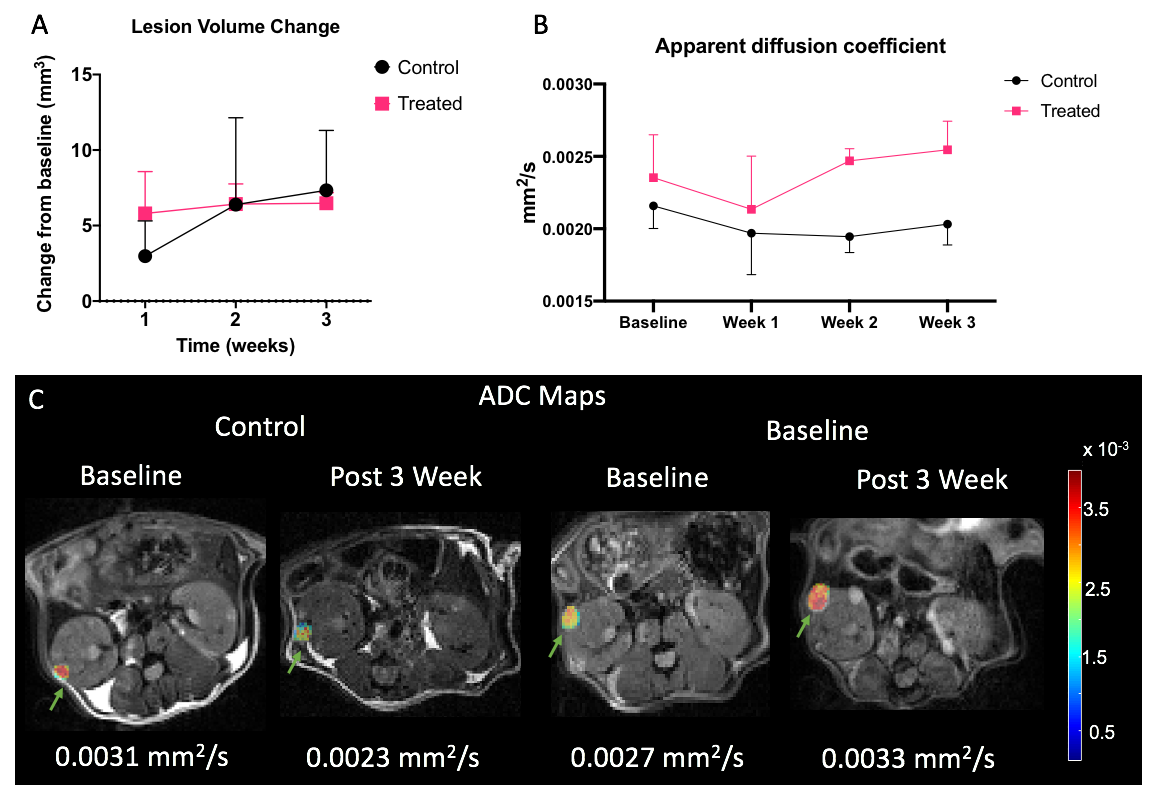
The genetically modified TSC mice presented with bilateral adenomas and cystic lesions that were predominantly in the renal capsule and pelvis (figure 1). T2-weighted images were used to estimate tumor volume using manually drawn ROIs. Owing to the location and size of the lesions, numerous imaging optimizations were evaluated with speed and ease of acquisition in mind for robust estimation of tumor volume. First, we evaluated if 3D acquisition would be necessary in lieu of the small lesion size. However, we found that a higher SNR without compromising on CNR, could be achieved with the 2D sequence in less time (Table 1). Volumes estimated from axial and coronal 2D acquisitions were in good agreement (p = 0.004. r = 0.68 (figure 2A). Furthermore, comparison of tumor volumes estimated from 1 mm and 0.5 mm thick slices also showed a strong correlation even for tumors less than 1 mm3 (p<0.0001. r = 0.97) (figure 2B). On average the lesion volumes estimated by 0.5 mm thick slice were 20% lower than their 1 mm thick counterpart. Treatment effect: The rate of change in tumor volumes post-treatment showed that everolimus treatment resulted in tumor stasis compared to control (figure 3A). 2-way ANOVA analysis of the ADC changes over time showed that the overall treated group had significantly lower cellularity as compared to the control group (p<0.03) (figure 3B) potentially reflecting apoptosis and cell size reduction5. Representative IHC stains of control and treated tumor lesions with H&E and ki67 are shown in figure 4.Discussion and conclusion
The current study shows the ability of multiparametric 1H MRI in providing vital information regarding TSC derived tumor characteristics, thus allowing for a dynamic and non-invasive evaluation of the disease progression and treatment response. Our results show that high-resolution 2D T2 -weighted images with thinner (0.5 mm) slice thickness are capable of providing tumor growth parameters at any image orientation. ADC maps showed that the cellularity of tumor lesions with volumes starting at 0.35 mm3 in size can be evaluated and can also be used to investigate the changes in cellularity as a response to therapy. The decrease in tumor growth as compared to baseline as well as cellularity of treated tumors indicate that the treatment was effective.Acknowledgements
The TSC consortium for providing the mice.References
1. Yang J, Samsel PA, Narov K, et al. Combination of Everolimus with Sorafenib for Solid Renal Tumors in Tsc2+/- Mice Is Superior to Everolimus Alone. Neoplasia. 2017;19(2):112-120. doi:10.1016/j.neo.2016.12.008
2. Yang P, Cornejo KM, Sadow PM, et al. Renal cell carcinoma in tuberous sclerosis complex. Am J Surg Pathol. 2014;38(7):895-909. doi:10.1097/PAS.0000000000000237
3. Bissler JJ, McCormack FX, Young LR, et al. Sirolimus for angiomyolipoma in tuberous sclerosis complex or lymphangioleiomyomatosis. N Engl J Med. 2008;358(2):140-151. doi:10.1056/NEJMoa063564
4. Sriram R, Gordon J, Baligand C, et al. Non-Invasive Assessment of Lactate Production and Compartmentalization in Renal Cell Carcinomas Using Hyperpolarized 13C Pyruvate MRI. Cancers (Basel). 2018;10(9). doi:10.3390/cancers10090313
5. Kenerson H, Dundon TA, Yeung RS. Effects of rapamycin in the Eker rat model of tuberous sclerosis complex. Pediatr Res. 2005;57(1):67-75. doi:10.1203/01.PDR.0000147727.78571.07
Figures