0421
Imaging renal fibrosis in an oxalate induced chronic kidney disease model1Biomedical Imaging, Genentech, South San Francisco, CA, United States, 2Translational Immunology, Genentech, South San Francisco, CA, United States, 3Pathology, Genentech, South San Francisco, CA, United States, 4Clinical Imaging Group, Genentech, South San Francisco, CA, United States
Synopsis
Chronic kidney disease (CKD) is a significant global health problem with fibrosis being a common pathway of disease progression. While MRI is sensitive to fibrosis, the relationship to ultrastructural underpinnings is not well understood. In this study, we evaluate an oxalate induced CKD model and determine the correlation of MRI metrics with high-resolution terminal endpoints. We find that FA and AD in the medulla are most correlated with fibrosis pathologies, new hydroxyproline, and inflammatory and fibrotic gene expression. These results show that MRI can detect fibrosis and that the signal change is related to interstitial fibrosis and nephron ultrastructure.
Introduction
Chronic kidney disease (CKD) is a significant global health problem affecting about 9-13% of the general population with substantial cases still undiagnosed (1-3). While many etiologies contribute to CKD including hypertension, diabetes, inflammation, and hypoxia, fibrotic processes are a common pathway and can accelerate progression of CKD (4,5). Quantifying fibrosis non-invasively is challenging, nevertheless recent advances and on-going clinical MRI studies are starting to show that renal fibrosis can be evaluated in vivo (6-9). Yet, one of the shortcomings of imaging is that the low-resolution measurements are not directly related to the ultrastructural molecular underpinnings. In this study, we evaluate a sodium oxalate disease model of CKD and fibrosis (10) to determine the relationship and correlation of MRI metrics with high-resolution terminal endpoints. In particular, we correlated MRI diffusion parameters and T2 with newly formed hydroxyproline, pathology scores, serum biomarkers, and gene expression data. Finally, a cumulative correlation analysis is completed to determine top MRI metrics most correlated with terminal endpoints.Methods
Animal model: Animal procedures were approved by the institutional AAALAC-accredited review board. Two groups of male mice were used: 1) C57Bl/6N (Charles River Laboratories) control (n=5), and 2) C57Bl/6 treated with sodium oxalate (n=8). In the disease group, animals were given a soluble sodium oxalate diet for 21 days prior to imaging. Mice were given deuterated water on day 7.MRI: During imaging, animals were anaesthetized with ~2% isoflurane and maintained at 37°C. Imaging was performed on a Bruker 7T (Billerica, MA) with an 86-mm volume transmit coil and a 4-channel cryogenic surface receive coil. A custom in vivo holder was constructed with 3D printing (Stratasys Dimension) to provide secure positioning of the animal. A T2 map covering the kidney was generated with a multi-slice multi-echo sequence: TR=4s, TE1/spacing/TE8=10/10/80ms (8 echoes), matrix=110×110×16, and resolution=200×200×1000μm3. Locally shimmed DTI with single-shot EPI readout was acquired: TR=4s, TE=42ms, gradient directions=20, matrix=110×110×16, and resolution=200×200×1000μm3. Echo enhanced T2 images were used to determine kidney volumes. DTI was used to compute parametric maps: fractional anisotropy (FA), apparent diffusion coefficient (ADC), axial diffusivity (AD), and radial diffusivity (RD). MRI parameters were measured in renal regions: cortex (CO), outer medulla (OM), and inner medulla (IM).
Hydroxyproline, histology, biomarkers, gene expression: Blood samples were collected to determine kidney function using serum BUN and creatinine. Kidneys were harvested from animals 1 day after MRI. Kidney specimens were sectioned and prepared for histology (H&E, collagen I, collagen III, and Masson’s trichrome). Histology was evaluated for crystalluria, tubular injury, inflammation, fibrosis distribution, and fibrosis severity (score of 0-2 each). Newly synthesized collagen was estimated using mass spectrometry of hydroxyproline in kidney tissue that incorporated deuterium from day 7. Inflammation and fibrosis were also determined from gene expression of Col1a1, Col3a1, Fn1, SerpinE1, IL6, and CCL2. Gene expression data were limited due to insufficient tissue samples (control n=5, oxalate n=4).
Results
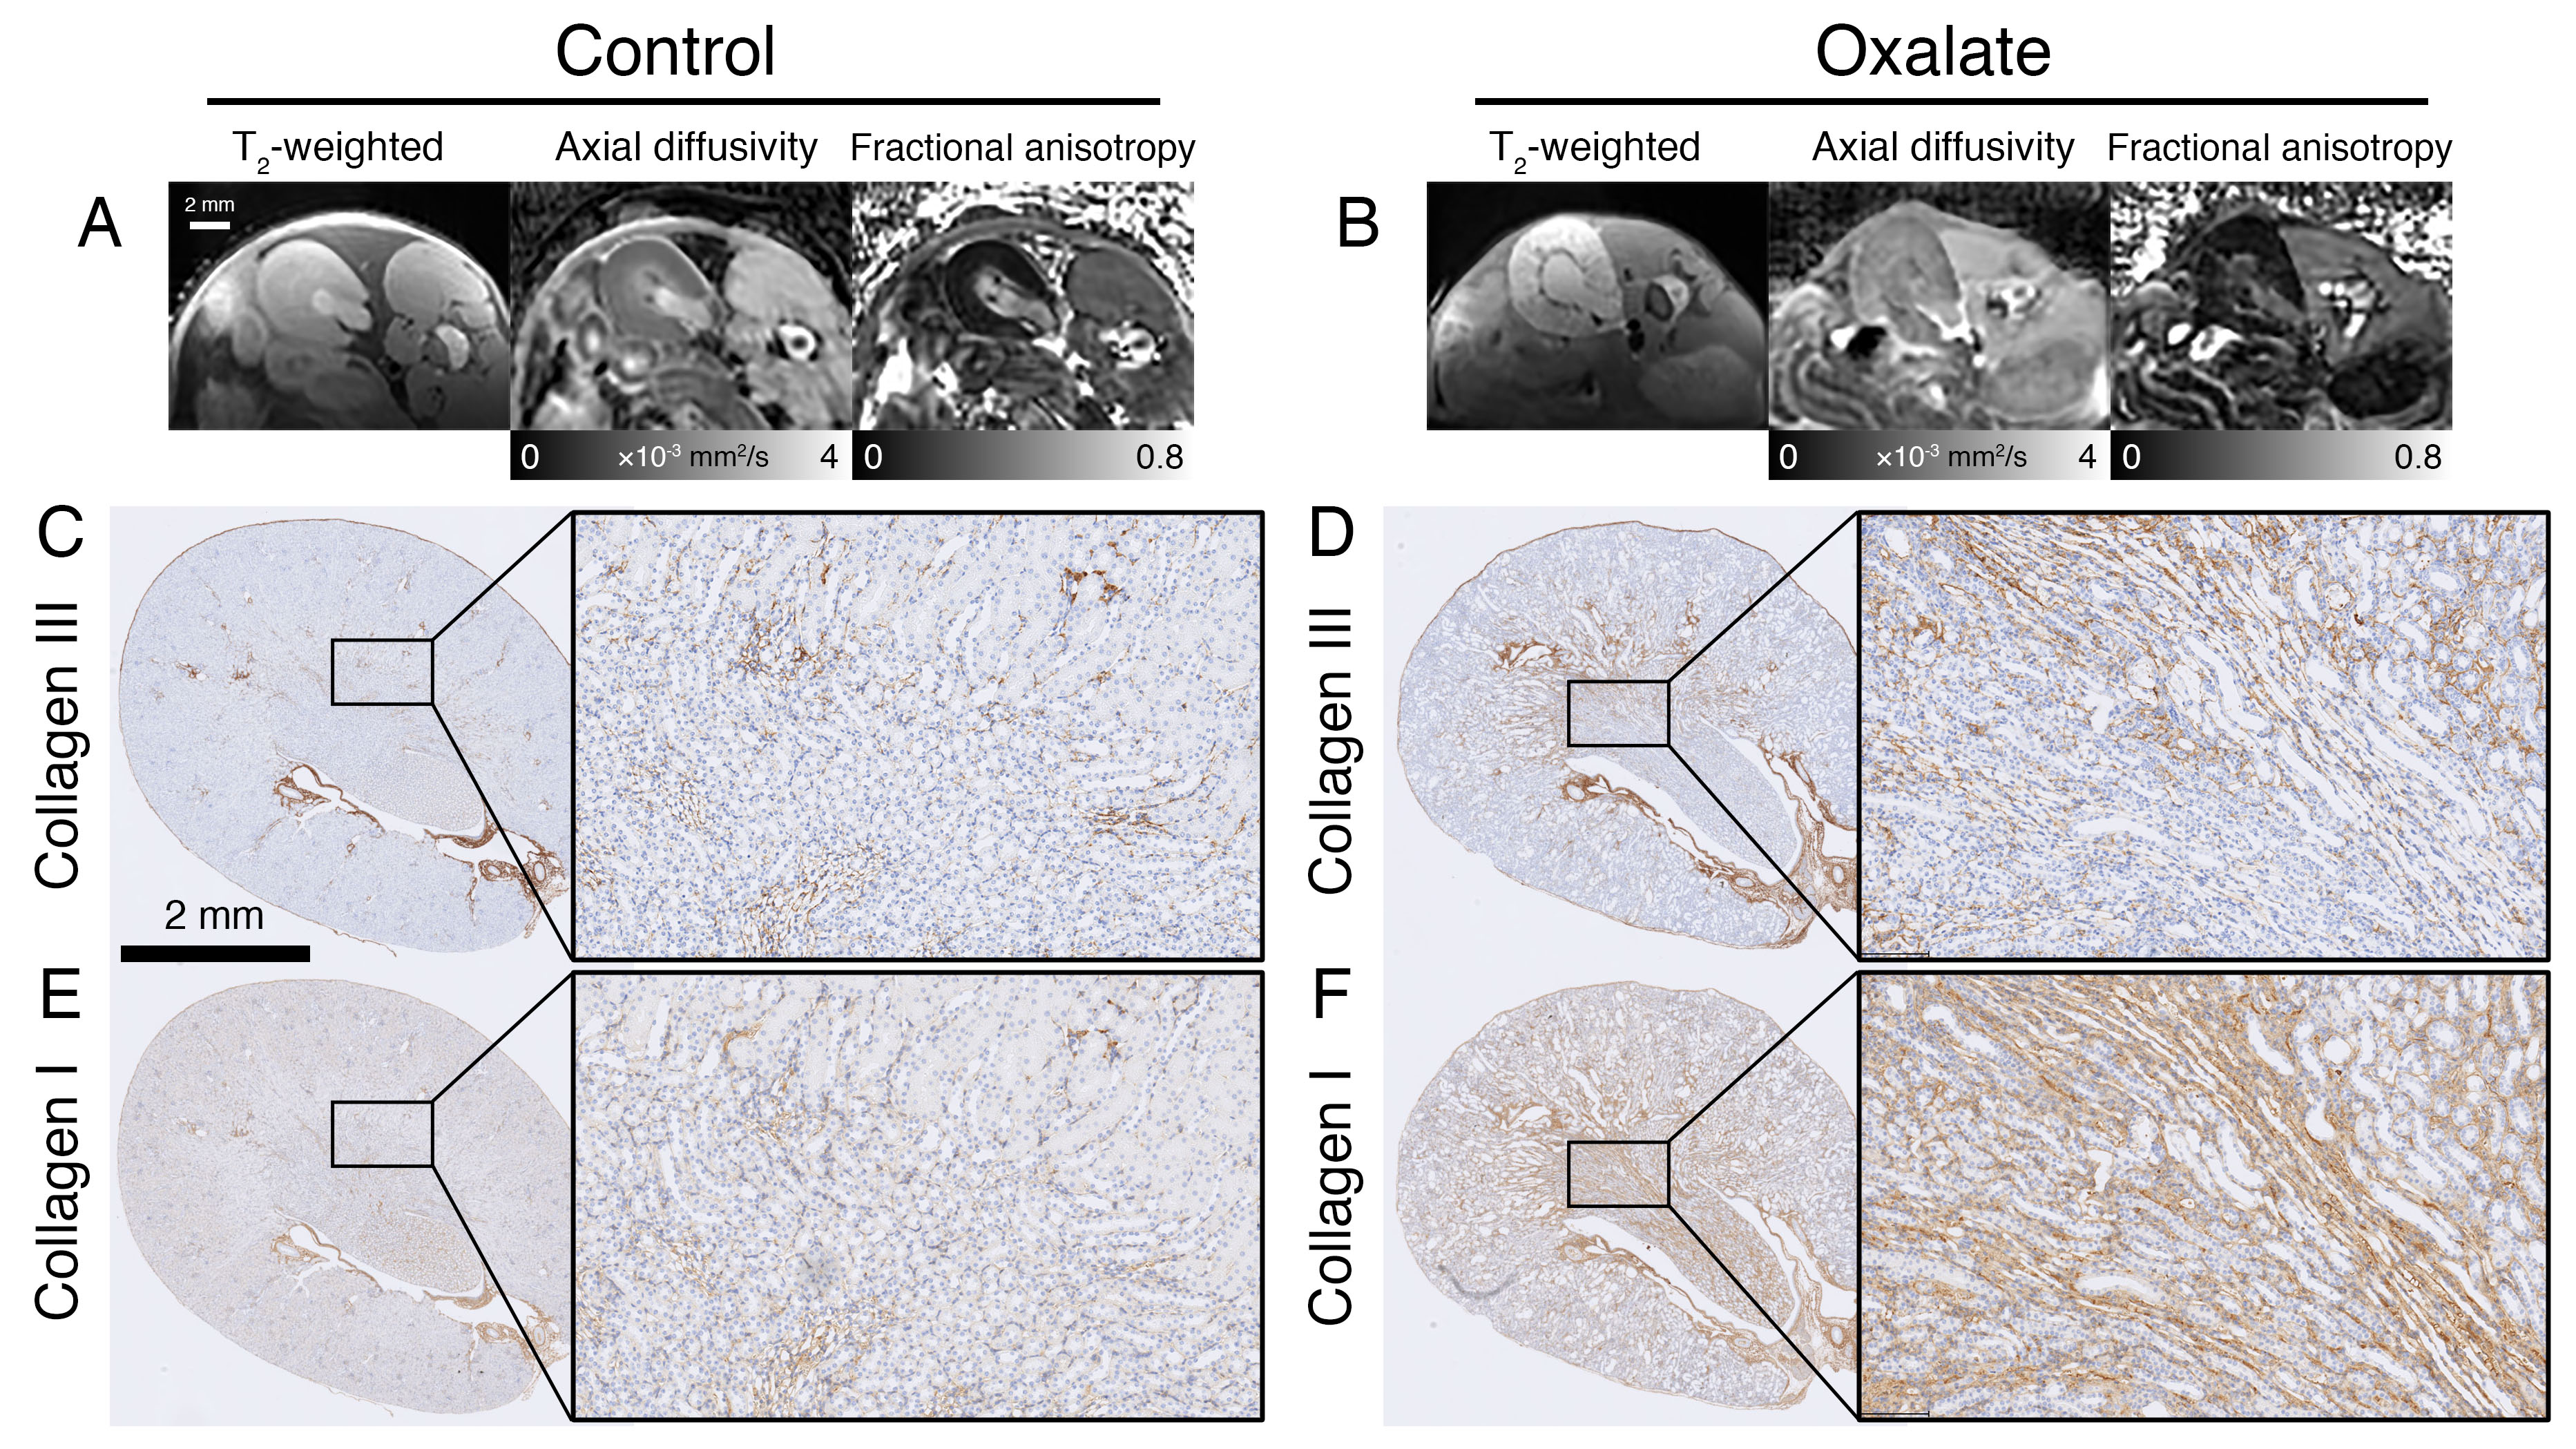
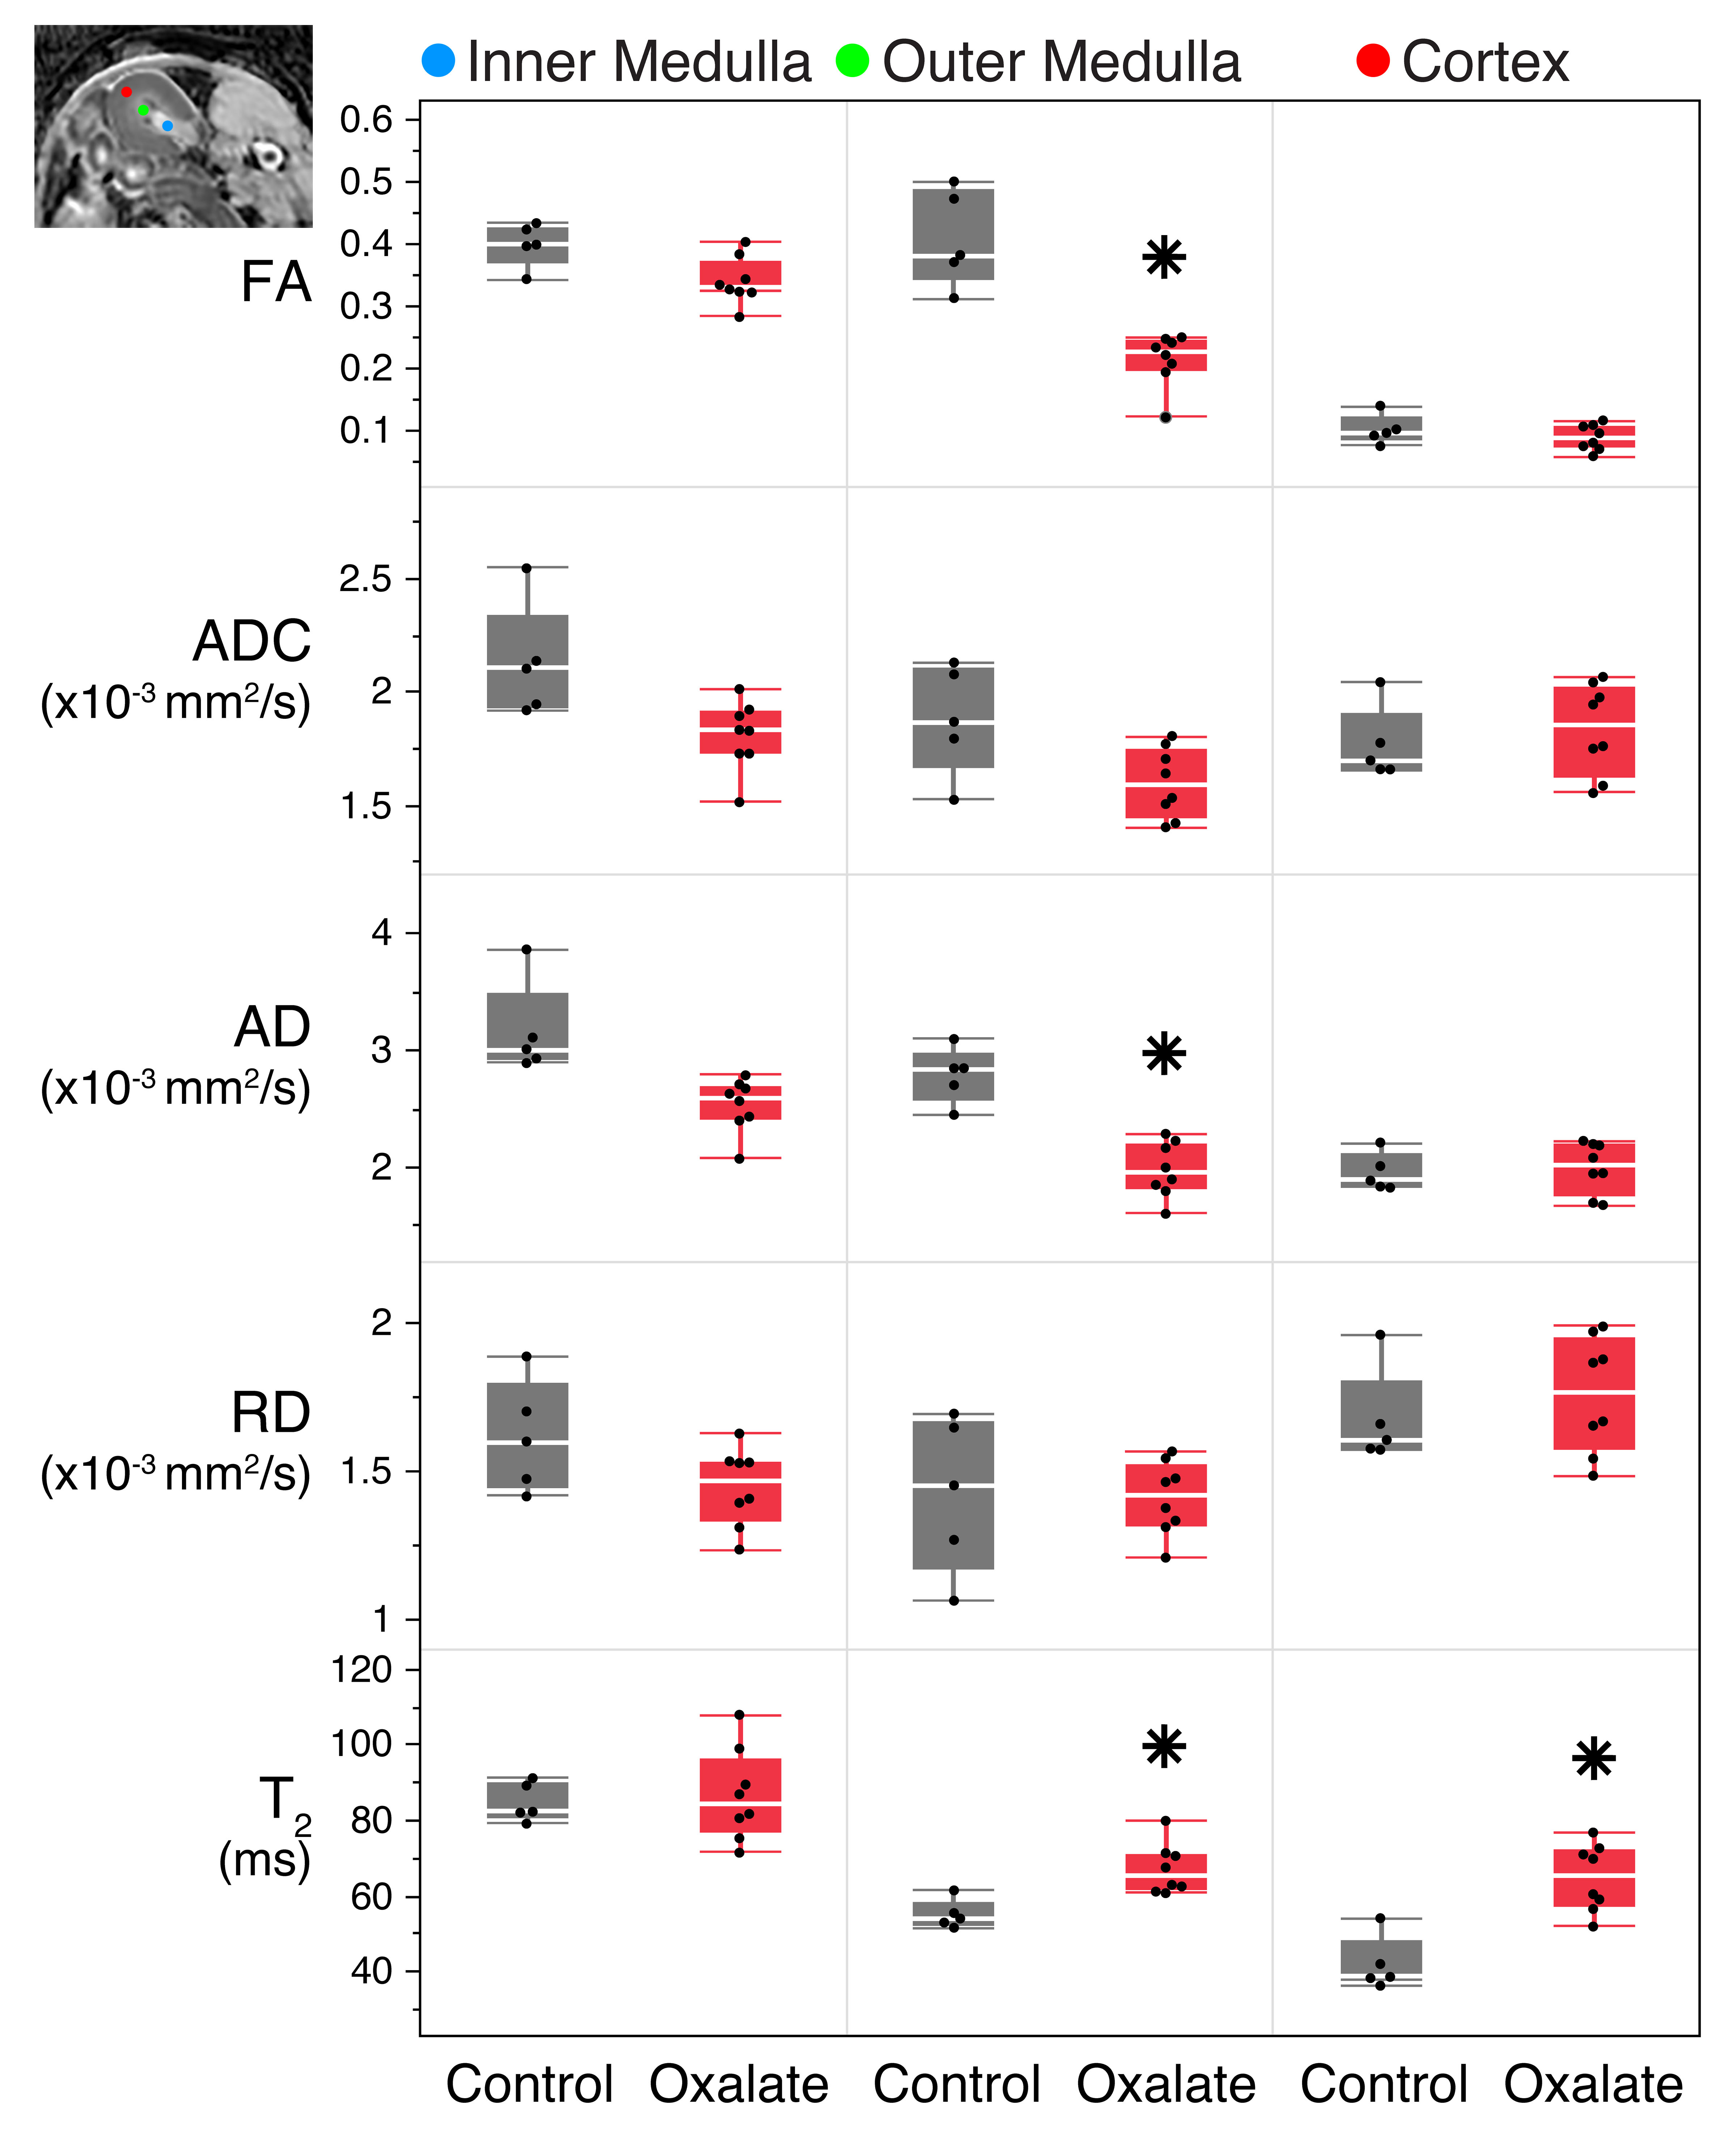
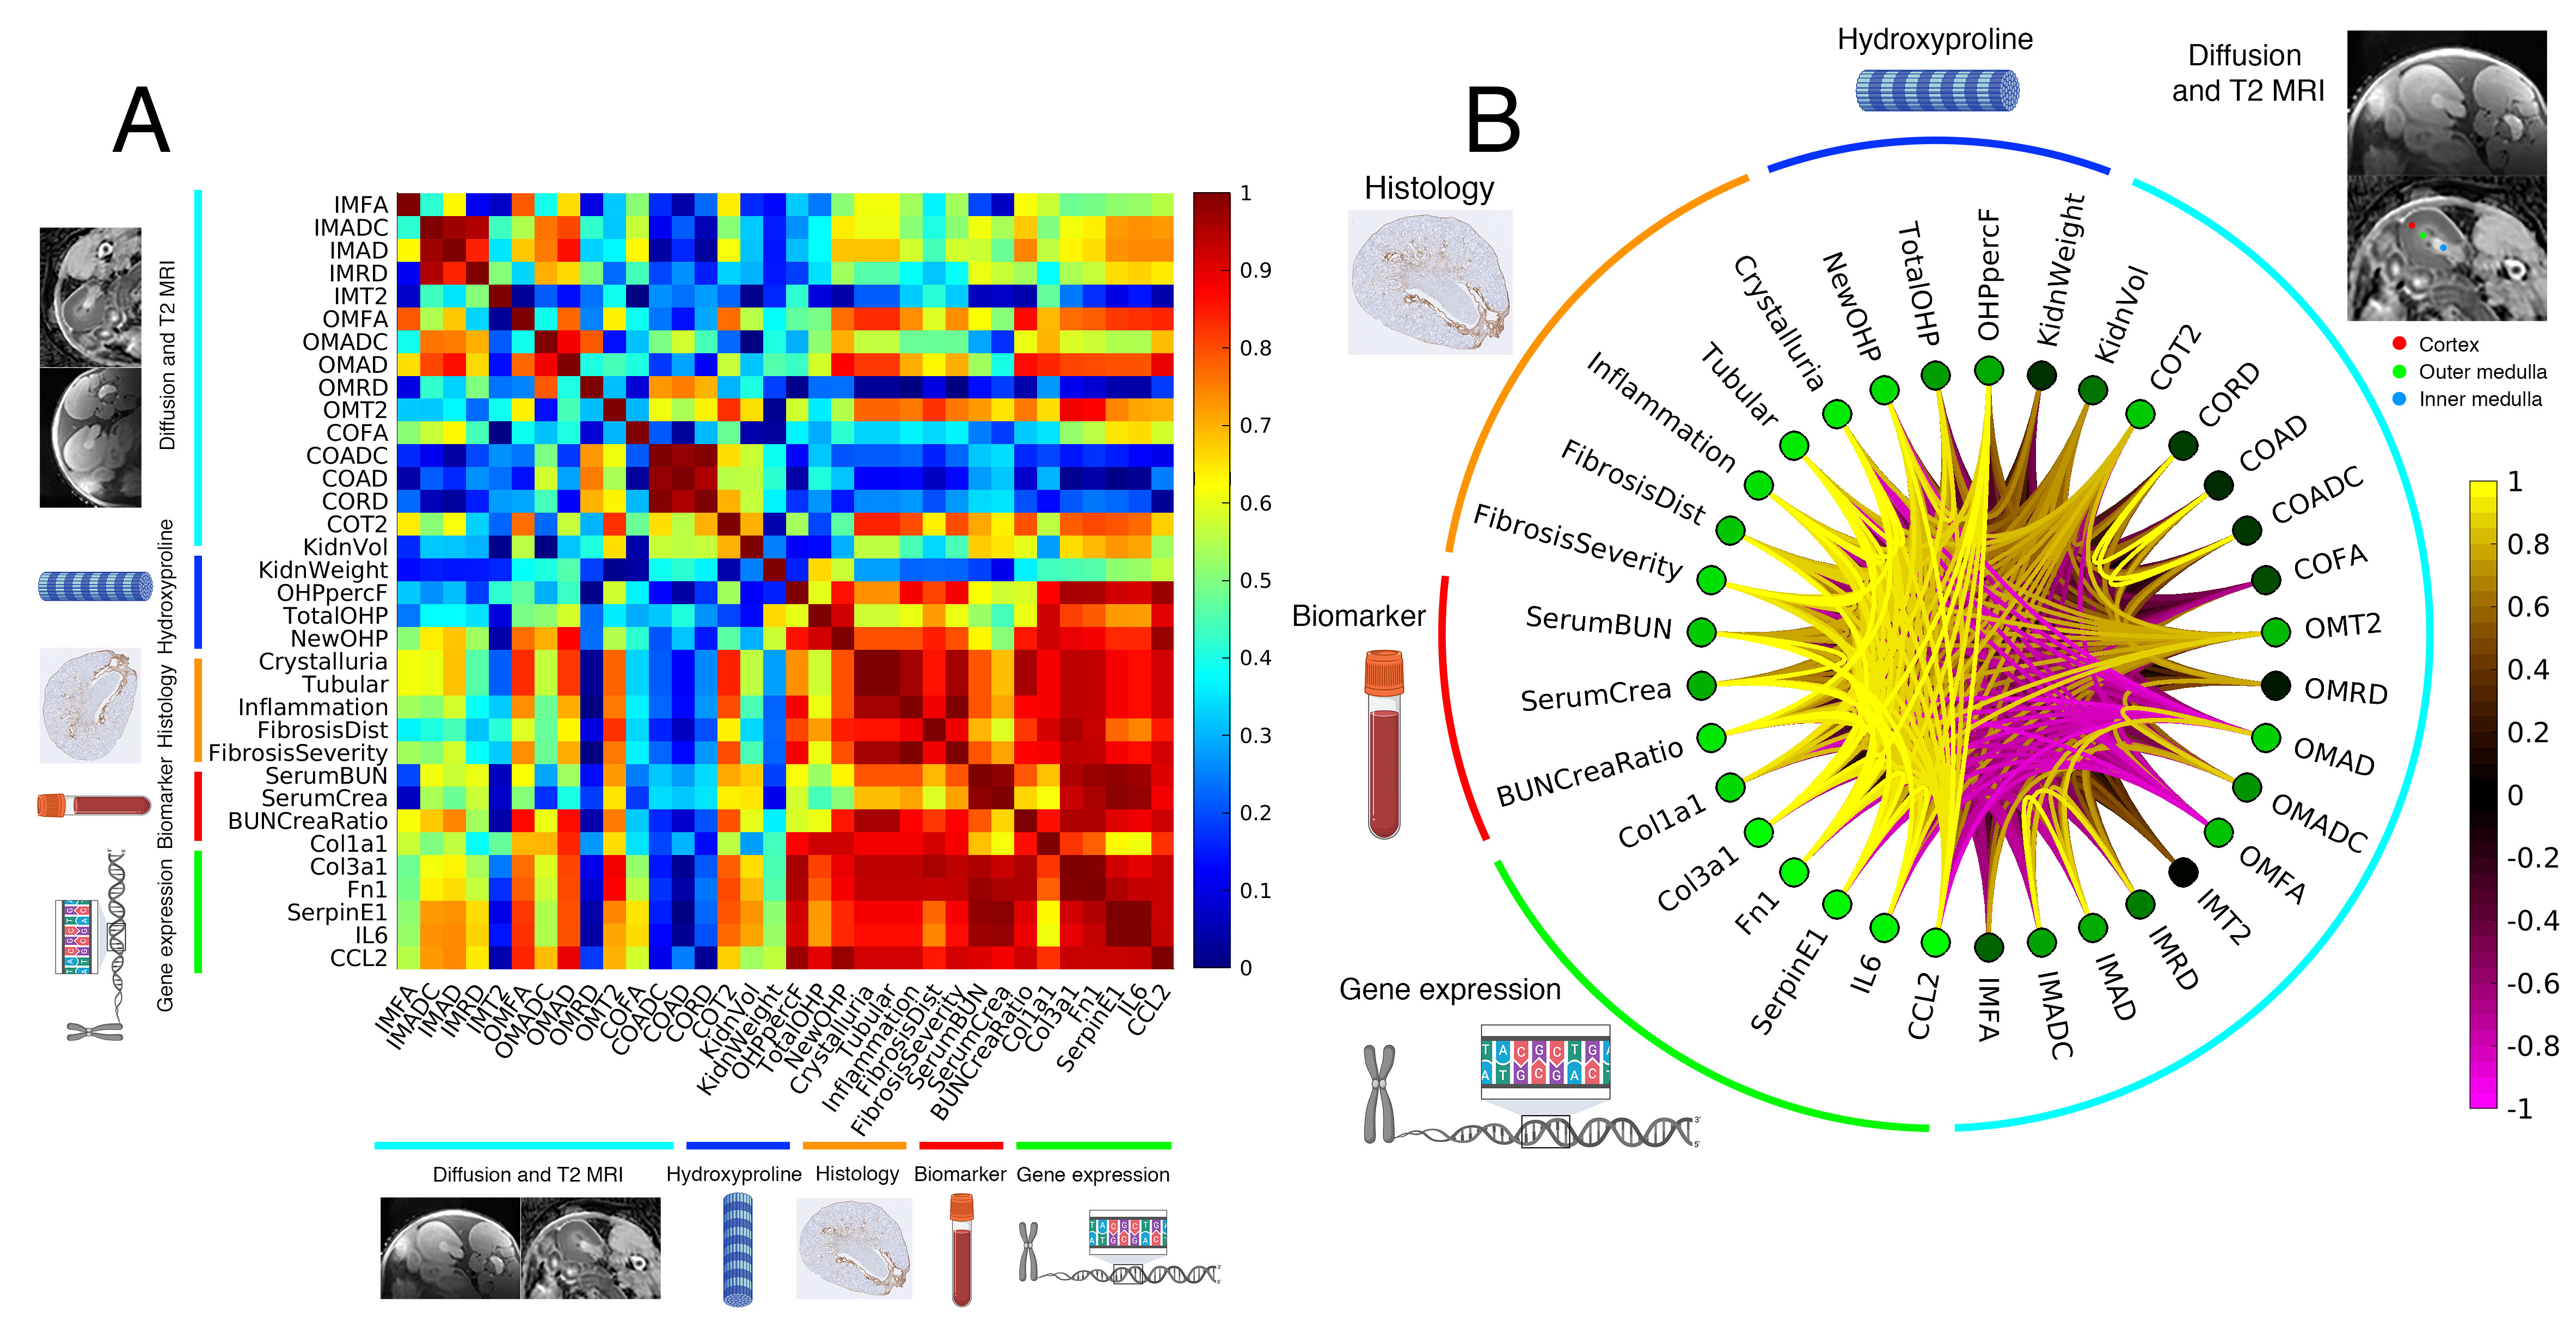
Example MRI and histology are shown in Fig. 1. The oxalate group showed a significant reduction in axial diffusivity and fractional anisotropy, especially in the outer medulla. In the histology images, there was increased tubular injury, inflammation, and fibrosis in the oxalate group. FA and AD were reduced in the outer medulla, and T2 was elevated in the outer medulla and cortex (Fig. 2). Imaging metrics were correlated with hydroxyproline, pathology scores, serum biomarkers, and gene expression data in a correlation matrix (Fig. 3A) and in a schemaball (Fig. 3B). Highly negatively correlated imaging metrics were generally in the outer medulla including FA and AD; highly positively correlated metrics were T2 values in the outer medulla and cortex (Fig. 3B). Axial diffusivity, having the highest cumulative imaging correlation, was most correlated with newly formed hydroxyproline, crystalluria, tubular injury, serum BUN to creatinine ratio, Col1a1, Col3a1, Fn1, SerpinE1, IL6, and CCL2. Highly correlated non-imaging endpoints included newly formed hydroxyproline, crystalluria, tubular injury, inflammation, fibrosis, and all gene expression data.Discussion and Conclusion
In this study, we demonstrate that MRI can detect changes in a sodium oxalate disease model. Using a comprehensive correlation analysis, we found diffusivities in the outer medulla and T2 in the outer medulla and cortex to be highly correlated with fibrosis pathologies, new hydroxyproline, and inflammatory and fibrotic gene expression. Moreover, the decrease of diffusivity values can be confirmed visually from histology images. There was significant interstitial fibrosis and collapsed nephron lumens that hinder water movement, which is reflected by diffusion MRI (Fig. 1). Crystalluria in nephrons can also act as physical barriers that reduce water diffusion along the tubules. MRI measurements were correlated with kidney function as determined from serum BUN and serum creatinine. In a different kidney disease model of lupus nephritis, diffusion metrics in the medulla were similarly correlated to pathology scores, but poorly correlated with proteinuria (11). Together, these results suggest that microstructural changes measured by MRI can potentially detect underlying fibrosis prior to significant functional decline at a late stage. The imaging methods presented here can possibly be translated to clinical studies for evaluating novel therapeutics in CKD and kidney fibrosis.Acknowledgements
No acknowledgement found.References
1. Shiba N, Shimokawa H. Chronic kidney disease and heart failure--Bidirectional close link and common therapeutic goal. J Cardiol 2011;57(1):8-17.
2. Eknoyan G, Lameire N, Barsoum R, Eckardt KU, Levin A, Levin N, Locatelli F, MacLeod A, Vanholder R, Walker R, Wang H. The burden of kidney disease: improving global outcomes. Kidney international 2004;66(4):1310-1314.
3. Hill NR, Fatoba ST, Oke JL, Hirst JA, O'Callaghan CA, Lasserson DS, Hobbs FD. Global Prevalence of Chronic Kidney Disease - A Systematic Review and Meta-Analysis. PloS one 2016;11(7):e0158765.
4. Inoue T, Kozawa E, Okada H, Inukai K, Watanabe S, Kikuta T, Watanabe Y, Takenaka T, Katayama S, Tanaka J, Suzuki H. Noninvasive evaluation of kidney hypoxia and fibrosis using magnetic resonance imaging. Journal of the American Society of Nephrology : JASN 2011;22(8):1429-1434.
5. Romagnani P, Remuzzi G, Glassock R, Levin A, Jager KJ, Tonelli M, Massy Z, Wanner C, Anders HJ. Chronic kidney disease. Nat Rev Dis Primers 2017;3:17088.
6. Friedli I, Crowe LA, Berchtold L, Moll S, Hadaya K, de Perrot T, Vesin C, Martin PY, de Seigneux S, Vallee JP. New Magnetic Resonance Imaging Index for Renal Fibrosis Assessment: A Comparison between Diffusion-Weighted Imaging and T1 Mapping with Histological Validation. Sci Rep 2016;6:30088.
7. Berchtold L, Crowe LA, Friedli I, Legouis D, Moll S, de Perrot T, Martin PY, Vallee JP, de Seigneux S. Diffusion magnetic resonance imaging detects an increase in interstitial fibrosis earlier than the decline of renal function. Nephrology, dialysis, transplantation : official publication of the European Dialysis and Transplant Association - European Renal Association 2020.
8. Selby NM, Blankestijn PJ, Boor P, Combe C, Eckardt KU, Eikefjord E, Garcia-Fernandez N, Golay X, Gordon I, Grenier N, Hockings PD, Jensen JD, Joles JA, Kalra PA, Kramer BK, Mark PB, Mendichovszky IA, Nikolic O, Odudu A, Ong ACM, Ortiz A, Pruijm M, Remuzzi G, Rorvik J, de Seigneux S, Simms RJ, Slatinska J, Summers P, Taal MW, Thoeny HC, Vallee JP, Wolf M, Caroli A, Sourbron S. Magnetic resonance imaging biomarkers for chronic kidney disease: a position paper from the European Cooperation in Science and Technology Action PARENCHIMA. Nephrology, dialysis, transplantation : official publication of the European Dialysis and Transplant Association - European Renal Association 2018;33(suppl_2):ii4-ii14.
9. Buchanan CE, Mahmoud H, Cox EF, McCulloch T, Prestwich BL, Taal MW, Selby NM, Francis ST. Quantitative assessment of renal structural and functional changes in chronic kidney disease using multi-parametric magnetic resonance imaging. Nephrology, dialysis, transplantation : official publication of the European Dialysis and Transplant Association - European Renal Association 2020;35(6):955-964.
10. Mulay SR, Eberhard JN, Pfann V, Marschner JA, Darisipudi MN, Daniel C, Romoli S, Desai J, Grigorescu M, Kumar SV, Rathkolb B, Wolf E, Hrabe de Angelis M, Bauerle T, Dietel B, Wagner CA, Amann K, Eckardt KU, Aronson PS, Anders HJ, Knauf F. Oxalate-induced chronic kidney disease with its uremic and cardiovascular complications in C57BL/6 mice. American journal of physiology Renal physiology 2016;310(8):F785-F795.
11. Xie L, Gandham V, Barck K, Suto E, Lee W, Foreman O, Carano R, De Crespigny A, Weimer R. T2 and diffusion tensor imaging of kidney disease in an epicutaneous TLR7 enhanced lupus mouse model. ISMRM 2020. p 0950.
Figures