0420
Renal perfusion imaging with free-breathing pCASL MRI in persons with salt-sensitive blood pressure1Radiology and Radiological Sciences, Vanderbilt University Medical Center, Nashville, TN, United States, 2Cardiovascular Medicine, Vanderbilt University Medical Center, Nashville, TN, United States
Synopsis
Salt sensitive blood pressure is a major independent risk factor for cardiovascular disease, with estimated 50% prevalence in adults for which no imaging biomarker exists. We evaluated persons for salt sensitivity and applied a quantitative magnetic resonance imaging strategy in the kidneys for measuring renal blood flow using free-breathing pseudo-continuous arterial spin labeling. Group comparisons showed renal blood flow is reduced in subjects with salt-sensitivity, which may be linked to renal mechanisms of sodium handling. Additionally, image acquisition protocols were compared between 20x and 4x acquisitions, revealing 4x acquisitions were robust to motion and favored a clinically feasible scan time.
Introduction
Cardiovascular disease is the leading cause of death world-wide, affecting more than one billion adults1. Salt-sensitive blood pressure (SSBP) is an independent risk factor for developing cardiovascular disease and all-cause mortality1,2. Current methods to assess SSBP are limited to lengthy dietary protocols that detect a parallel change in blood pressure in response to dietary salt load in persons with salt sensitivity2. Noninvasive magnetic resonance imaging (MRI) strategies are needed to provide clinically-feasible assessment of SSBP.Our approach is to apply advanced MRI methods for measuring renal blood flow3 in persons evaluated for SSBP using standard dietary protocols, which may relate to sodium handling mechanisms and provide a functional biomarker for SSBP. Here we explore whether noninvasive free-breathing kidney pseudo-continuous arterial spin labeling (pCASL) MRI can provide adequate signal-to-noise ratio (SNR) to measure renal blood flow (RBF) in a clinically-feasible scan time. We applied this pCASL MRI strategy in the kidneys of persons evaluated for SSBP to assess whether RBF is reduced in individuals with SSBP.
Methods
All volunteers provided informed, written consent for this study. Adult volunteers (n = 25; age = 26.8±10.1; BMI = 23.5±3.3; sex = 10 female/15 male; race = 13 black/12 white) were enrolled through research outreach at our institution. Volunteers were all normotensive and without kidney or cardiovascular disease. Screening for eligibility included physical examination, medical history review, identifying caloric intake, and standard blood panels. Exclusion criteria included cardiovascular disease, hypertension (blood pressure systolic/diastolic > 140/90 mmHg), diabetes, renal disease, smoking, pregnancy, steroid use, or MRI contradictions.Diet. Subjects underwent an extensive protocol to evaluate their salt-sensitivity using standardized dietary protocols recommended by the NIH and AHA4,5. Subjects were randomly assigned to a 3-week dietary intervention which consisted of one week each of either i.) high-salt, washout, low-salt, or ii.) low-salt, wash-out, high-salt. The high-salt diet consisted of two bullion broth packets per day which were added to a subject’s typical diet, raising sodium intake by 4,600 mg/day. The low-salt diet consisted of isocaloric meals that resulted in sodium intake of <600 mg/day. Blood pressure (mmHg) was measured following each diet week to calculate the difference between mean arterial pressure (ΔMAP = blood pressure after high salt diet – blood pressure after low salt diet).
MRI. MRI was performed at baseline or at least two weeks after diet completion on a 3.0-T Philips Ingenia (Philips Healthcare, Best, The Netherlands). Kidney pCASL MRI was acquired utilizing the Philips anterior coil for free-breathing methods and the following parameters: TR/TE = 7000/15.6 ms; FOV = 384 x 384 x 77 mm3; resolution 1.5 x 1.5 x 7 mm3; post-labeling delay = 1.4 s; label duration = 1.8 s; blood T1 = 1.55 s; labeling efficiency = 80%; number of acquisitions = 4x, scan time=1.2 min). A separate sequential scan was performed using 20x acquisitions (scan time=4.9 min), followed by a scan to measure equilibrium signal (M0) without labeling or changing the shim and with extended TR=15,000 ms.
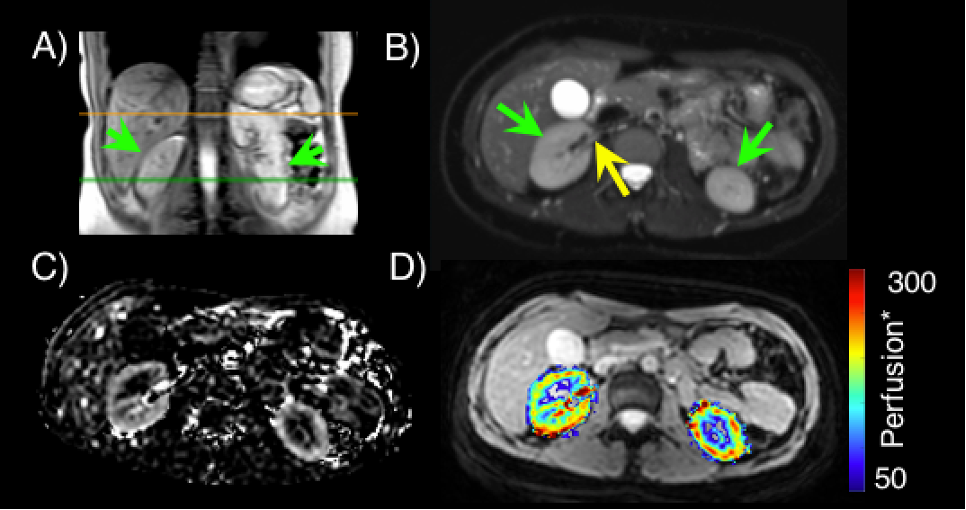
Image analysis. Quantitative RBF maps were calculated voxel-wise using the simplified ISMRM perfusion model of the difference signal on pCASL control and label source images6 (Figure 1). Segmentation of the cortex was performed on the M0 image, and this region of interest (ROI) was applied to perfusion maps to calculate mean cortical RBF (ml blood/100g tissue/min). SNR was calculated from pCASL difference images as the mean cortical signal divided by the standard deviation of the noise, which was defined with an ROI set outside of the abdomen in the FOV.
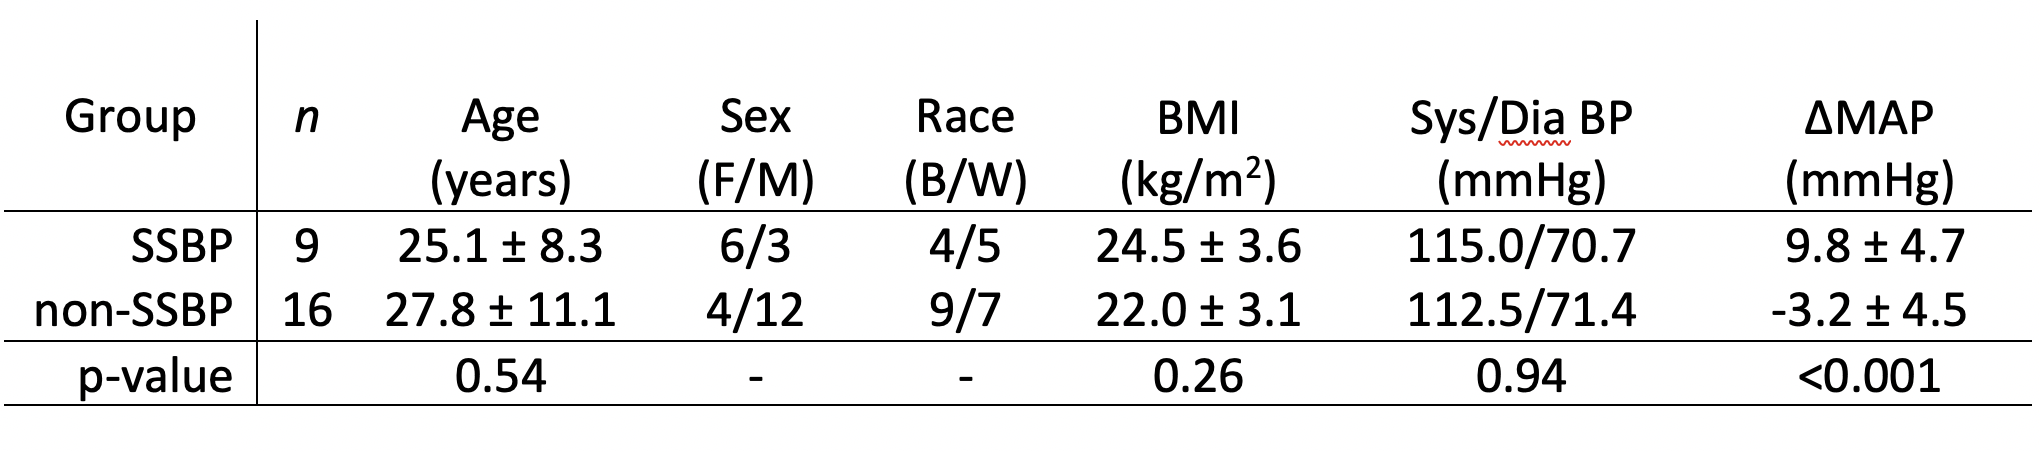
Statistical and analysis procedures. Subjects were classified as salt-sensitive if the mean arterial blood pressure change ΔMAP>5 mmHg according to standard thresholds2. Statistical objectives were to (i) compare SNR between the 4x and 20x acquisitions; (ii) determine the correlation between RBF from 4x and 20x acquisitions; (iii) perform summary statistics of study measures; (iv) establish SSBP and non-SSBP groups are matched for age, BMI, sex, race; and (v) evaluate potential group differences in cortical RBF using a Student’s t-test with two-sided significance criteria p<0.05.
Results
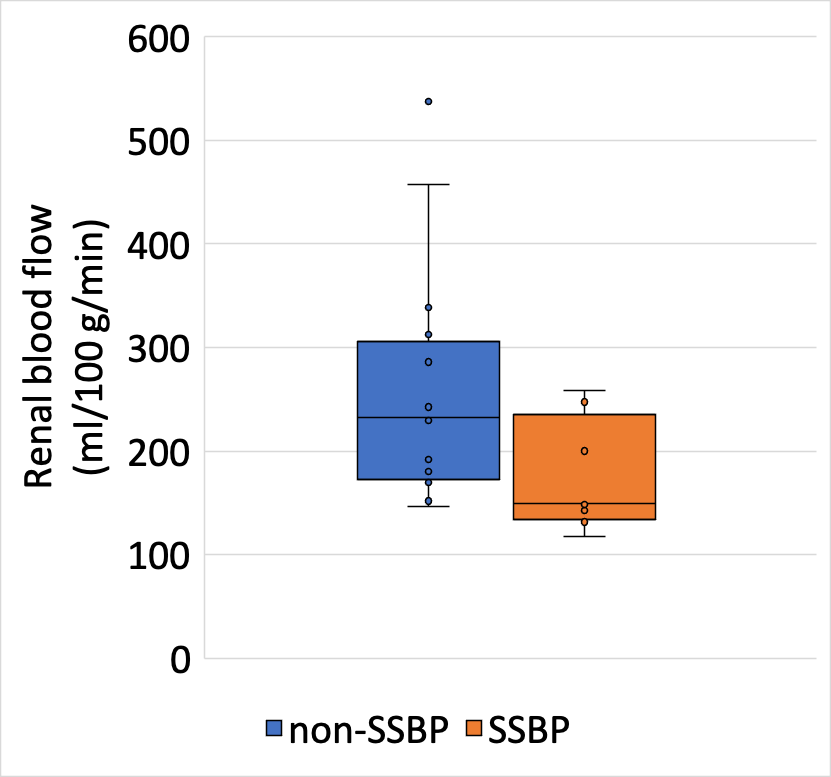
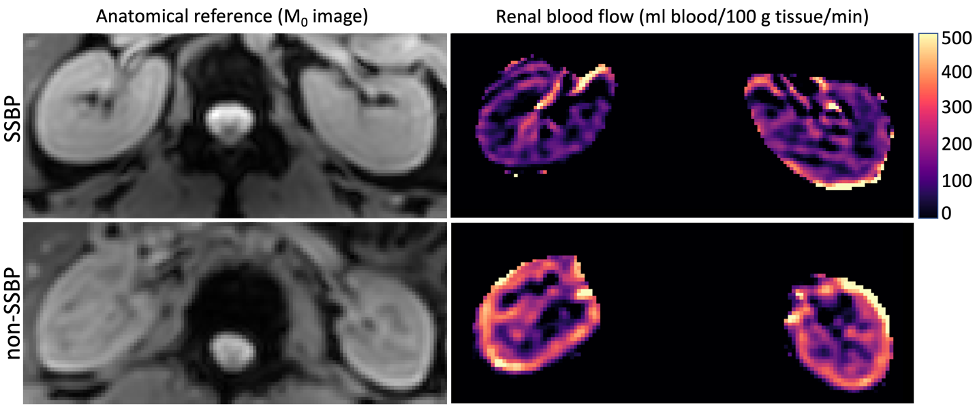
Comparison of 20x and 4x acquisition protocols revealed higher SNR using the 20x protocol (9.0 ± 5.1 vs. 4.6 ± 2.7, respectively). Cortical RBF values from the 4x acquisition correlated with those from the 20x acquisition (R2=0.84, p<0.001) and were used in subsequent analyses. Volunteers with SSBP (n=9) and non-SSBP (n=16) were all normotensive and matched for age, BMI, sex, and race (Figure 2). Quantitative kidney pCASL MRI showed a trend for lower RBF in SSBP (174.5 ± 53.9 ml/100g/min) compared to non-SSBP (253.8 ± 111.7 ml/100g/min) groups (p=0.07, Figure 3). Case examples of this finding are shown in Figure 4.Discussion
In this ongoing study, we demonstrate that free-breathing non-invasive kidney pCASL MRI can provide adequate signal at 4x acquisitions that favors a clinically feasible scan time. Group comparisons indicate that cortical RBF is reduced in persons with SSBP and may indicate renal mechanisms of SSBP. Ongoing recruitment is anticipated to provide sufficient power to test the significance of these findings.Conclusion
Kidney pCASL MRI may provide a noninvasive, clinically-feasible imaging biomarker of salt-sensitivity, a major independent risk factor for cardiovascular disease with high prevalence.Acknowledgements
Imaging experiments were performed in the Vanderbilt Human Imaging Core, using research resources supported by the National Institutes of Health (NIH) grant 1S10OD021771-01. We are grateful for Philips support from Charles Nockowski and Ryan Robinson, and to core MRI technicians Christopher Thompson, Clair Jones, and Marisa Bush. Funding was provided by the NIH/National Heart, Blood and Lung Institute (NHBLI) grant K23HL128928, the American Heart Association Innovative Project Award (19IPLOI34760518), American Heart Association Career Development Award (18CDA34110297), and the Institutional National Research Service Award (NRSA) T32 EB001628. Recruitment through www.ResearchMatch.org and services at the Clinical Research Center are supported by the National Center for Advancing Translational Sciences (NCATS) Clinical Translational Science Award (CTSA) Program, award number 5UL1TR002243-03. The content is solely the responsibility of the authors and does not necessarily represent the official views of the NIH.References
1. Heron M. Deaths: Leading causes for 2016 (National Vital Statistics Reports volume 67, number 6). 2018;67(6):1-77. https://www.cdc.gov/nchs/data/nvsr/nvsr67/nvsr67_06.pdf2.
2. Kurtz TW, Dicarlo SE, Pravenec M, Morris RC. The American Heart Association Scientific Statement on salt sensitivity of blood pressure: Prompting consideration of alternative conceptual frameworks for the pathogenesis of salt sensitivity? J Hypertens. 2017;35(11):2214-2225. doi:10.1097/HJH.00000000000014583.
3. Nery F, Gordon I, Thomas D. Non-Invasive Renal Perfusion Imaging Using Arterial Spin Labeling MRI: Challenges and Opportunities. Diagnostics. 2018;8(1):2. doi:10.3390/diagnostics80100024.
4. Elijovich F, Weinberger MH, Anderson CAM, et al. Salt Sensitivity of Blood Pressure : A Scientific Statement from the American Heart Association. Vol 68.; 2016. doi:10.1161/HYP.00000000000000475.
5. Farquhar WB, Edwards DG, Jurkovitz CT, Weintraub WS. Dietary Sodium and Health. J Am Coll Cardiol. 2015;65(10):1042-1050. doi:10.1016/j.jacc.2014.12.0396.
6. Alsop DC, Detre JA, Golay X, et al. Recommended implementation of arterial spin-labeled Perfusion mri for clinical applications: A consensus of the ISMRM Perfusion Study group and the European consortium for ASL in dementia. Magn Reson Med. 2015;73(1):102-116. doi:10.1002/mrm.251977.
7. Biguri A. Perceptually uniform colormaps (https://www.mathworks.com/matlabcentral/fileexchange/51986-perceptually-uniform-colormaps). MATLAB Central File Exchange. Retrieved December 15, 2020.
Figures