0419
Multiparametric Renal MRI in Children and Young Adults: Comparison between Healthy Participants and Patients with Chronic Kidney Disease1Department of Radiology, Cincinnati Children's Hospital Medical Center, Cincinnati, OH, United States, 2Imaging Research Center, Department of Radiology, Cincinnati Children's Hospital Medical Center, Cincinnati, OH, United States, 3Department of Nephrology, Cincinnati Children's Hospital Medical Center, Cincinnati, OH, United States, 4Department off Nephrology, Cincinnati Children's Hospital Medical Center, Cincinnati, OH, United States
Synopsis
Multiparametric renal MRI might be used as a non-invasive biomarker of pediatric chronic kidney disease (CKD). 20 pediatric and young adult healthy controls and 12 patients with CKD underwent quantitative renal MRI consisting of MR elastography (MRE), T1 mapping, T2 mapping, and diffusion-weighted imaging (DWI). Whole kidney and cortical T1 values were greater in patients than healthy controls (p=0.018 and p<0.0001, respectively), whereas whole kidney, cortical, and medullary DWI ADC values were lower in patients than healthy controls (p=0.017, whole kidney). No differences in T2 or stiffness measurements between the two groups were observed.
Introduction
Chronic kidney disease (CKD) is a major public health concern worldwide, affecting more than 10% of the adults, with rates estimated to rise by up to 5% per year1. However, less is known about the prevalence of CKD in the pediatric population, where it is estimated that the rate of renal replacement therapy for treatment of CKD is 9 per million for the age range 4-18 years2. Since the risk of progression from CKD to end-stage renal disease and associated cardiovascular complications can significantly impact quality of life and clinical outcomes diagnosis and monitoring of CKD is important1.Glomerular filtration rate (GFR) is commonly used to evaluate and stratify patients with CKD3, but can be challenging to accurately measure4. Furthermore, GFR does not necessarily provide insight into the presence and degree of kidney fibrosis and inflammation. Multiparametric MRI has shown promise to non-invasively assess and quantify pathophysiological and histological processes in animal models of CKD without need for invasive biopsy or contrast agents1. However, to date, there is a paucity of renal multiparametric MRI data in the pediatric population. Therefore, the goals of this study were to 1) obtain normative multiparametric MRI data from the kidneys of healthy children and young adults, 2) compare MRI measurements between controls and patients with CKD, and 3) determine if MRI measurements correlate with clinical/laboratory data.
Methods
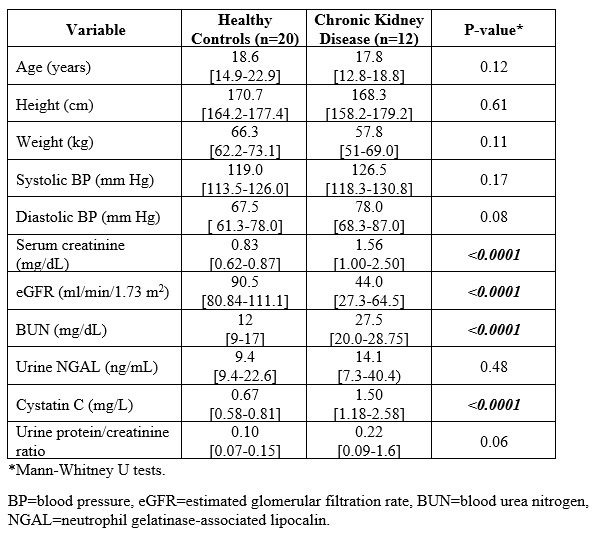
This was a prospective, HIPAA compliant and IRB approved study in which 20 healthy children/young adults (10/20 females; median age=18.6 years [IQR: 14.9-22.9]) and 12 patients with CKD (10 of 12 males; median age=17.8 years [IQR:12.8-18.8]) underwent research quantitative MRI exams of the kidneys.All imaging under the study protocol was performed on a Philips Ingenia 1.5T scanner (Best, The Netherlands) using a 28-channel (16 anterior, 12 posterior) torso coil with participants in supine position. The quantitative MRI exams of the kidneys included T1 mapping (MOLLI), T2 mapping (multi-echo fast spin-echo), MR elastography (60 Hz, posteriorly placed paddle, spin-echo echo-planar sequence), and diffusion-weighted imaging (quantified as apparent diffusion coefficients [ADC] using 5 b-values from 0-800 s/mm2). Clinical and laboratory data were obtained at the same visit, including serum creatinine (sCre), cystatin C, and urine protein/creatinine ratio (UPCR). Estimated glomerular filtration rate (eGFR) was calculated using the modified bedside schwartz equation for pediatrics and MDRD for young-adults.
All image reconstructions and parametric mapping were performed inline on the scanner, including the MRE stiffness map computation using a multimodal direct inversion algorithm. The imaging data were exported to a post-processing workstation (IntelliSpace Portal v10.1; Philips Healthcare) in standard DICOM format for analysis. Manual measurements of the kidneys were made on all quantitative image types by a single trained image analyst (>4-years’ experience), blinded to the clinical and laboratory data, under the supervision of a board-certified Pediatric Radiologist (>10-years post-fellowship experience). Independent measurements for cortex, medulla and whole kidney were obtained by tracing region of interest (ROIs) on the upper, mid, and lower portions of the kidneys and the weighted average of all anatomical slices was reported.
Mann-Whitney U tests were used to compare continuous data between groups, while Spearman correlation coefficients were used to assess bivariate associations. A p-value <0.05 was considered significant for all inference testing. All statistical analyses were performed using GraphPad Prism (GraphPad Software; San Diego, California).
Results
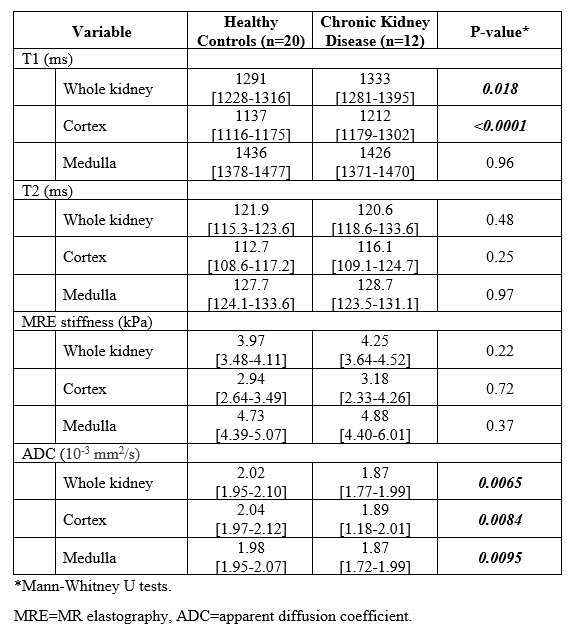
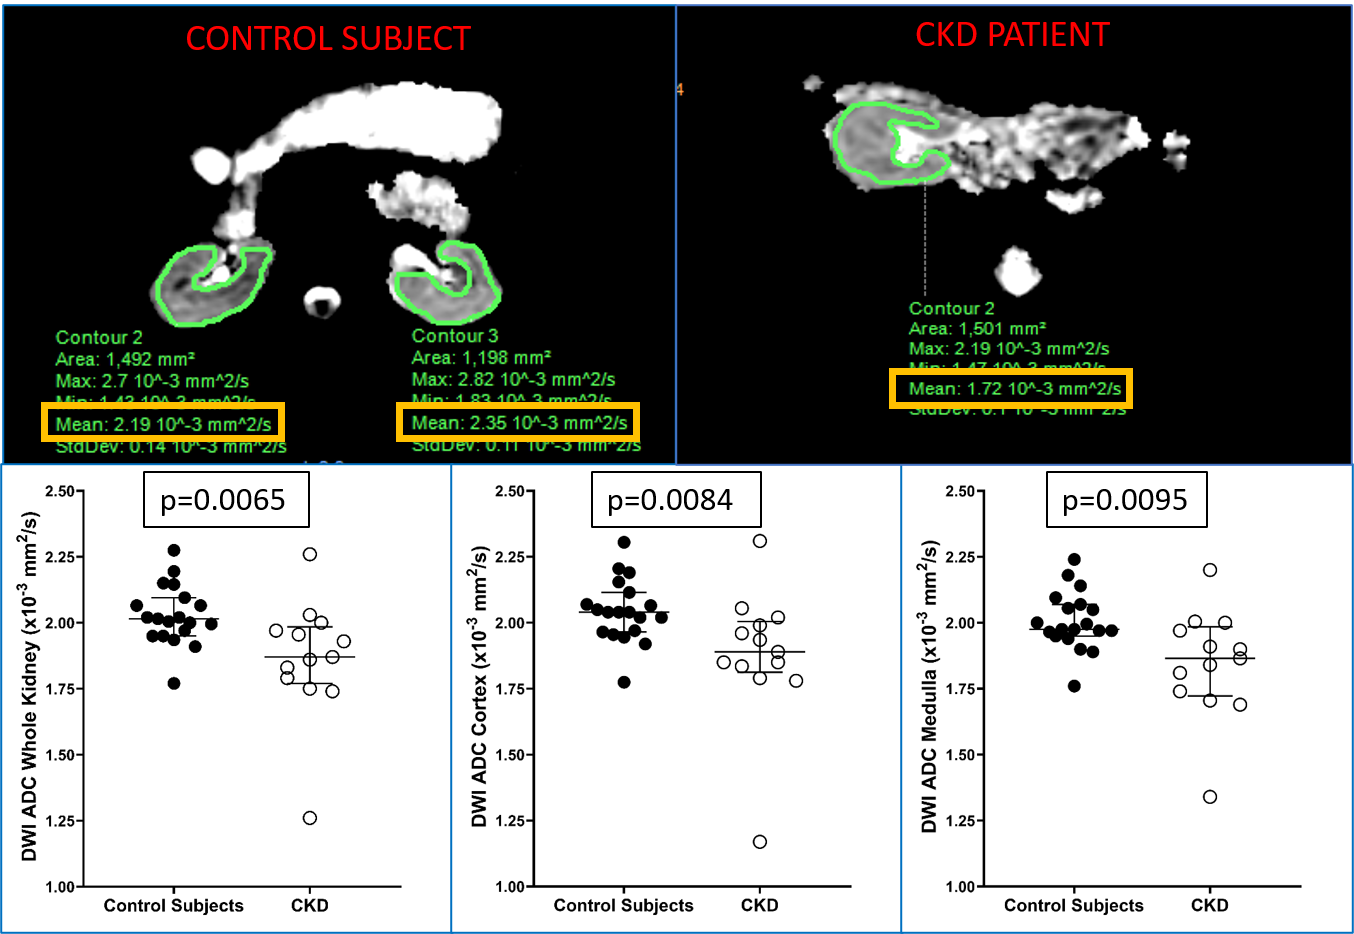
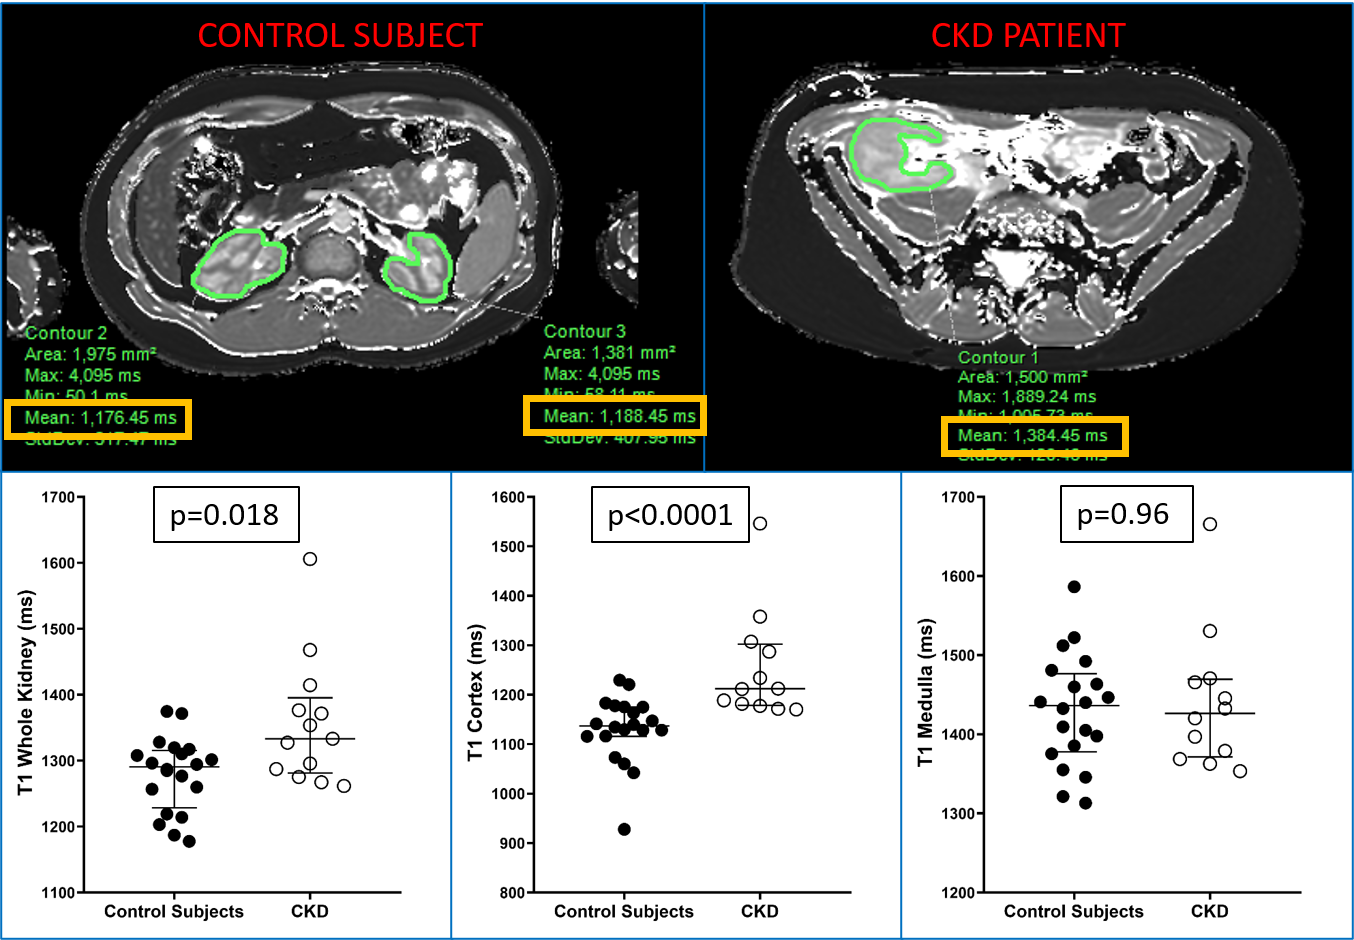
Healthy controls had a median sCre of 0.83 mg/dL (IQR: 0.62-0.87) and eGFR of 112.3 ml/min/1.73 m2 (IQR:108.6-130.9), while patients with CKD had a median sCre of 1.45 mg/dL (IQR:0.98-2.48) and eGFR of 55.0 ml/min/m2 (IQR: 32.0-76.1) (all p<0.0001). Whole kidney and cortical T1 values were higher in patients compared to controls (1333 vs 1291 ms [p=0.018] and 1212 vs 1137 ms [p<0.0001]). There was no significant difference in renal T2 values or stiffness measurements between groups for cortex, medulla and whole kidney. Whole kidney, cortical, and medullary ADC values were lower in patients compared to controls (e.g., whole kidney ADC 1.87 vs. 2.02 10-3 mm2/s [p=0.007]). Whole kidney and cortical T1 measurements correlated with sCre, eGFR, cystatin C, and UPCR (e.g., cortical T1 vs. eGFR rho=-0.62 [p=0.0003]). Whole kidney, cortical, and medullary ADC values correlated with sCre, eGFR, and cystatin C (e.g., whole kidney ADC vs. cystatin C rho=-0.46 [p=0.009]).Discussion
Whole kidney and cortical T1 values were significantly higher in CKD patients compared to control subjects. DWI ADC values for whole kidney, cortex and medulla were significantly lower in CKD subjects compared to control subjects. There were no significant differences in T2 relaxation times and stiffness values between CKD patients and healthy controls. Renal T1 as well as ADC values also significantly correlated with conventional clinical laboratory markers of kidney function, such as sCre, eGFR, and cystatin C. These results demonstrate that multiparametric kidney MRI can potentially be used as a non-invasive biomarker for pediatric CKD in conjunction with clinical and laboratory data. Future goals include assessing the relationships between quantitative MRI measurements and histologic markers of inflammation and fibrosis as well as conducting a larger validation study.Conclusion
T1 relaxation and DWI ADC measurements significantly differ between healthy children/young adults and patients with CKD, correlate with laboratory markers of CKD, and may be useful noninvasive biomarkers for pediatric CKD.Acknowledgements
No acknowledgement found.References
1. Buchanan CE, Mahmoud H, Cox EF, et al. Quantitative assessment of renal structural and functional changes in chronic kidney disease using multi-parametric magnetic resonance imaging. Nephrol Dial Transplant. 2020;35(6):955-964. doi:10.1093/ndt/gfz129
2. Harambat J, Van Stralen KJ, Kim JJ, Tizard EJ. Epidemiology of chronic kidney disease in children. Pediatr Nephrol. 2012;27(3):363-373. doi:10.1007/s00467-011-1939-1
3. Bjornstad P, Karger AB, Maahs DM. Measured GFR in Routine Clinical Practice—The Promise of Dried Blood Spots. Adv Chronic Kidney Dis. 2018;25(1):76-83. doi:10.1053/j.ackd.2017.09.003
4. Lopez-Giacoman S. Biomarkers in chronic kidney disease, from kidney function to kidney damage. World J Nephrol. 2015;4(1):57. doi:10.5527/wjn.v4.i1.57
Figures