0418
Multiparametric Renal MRI in Chronic Kidney Disease: Changes in MRI and Clinical Measures Over Two Years
Charlotte E Buchanan1, Rebecca Noble2, Eleanor Cox1, Huda E Mahmoud2, Isma Kazmi2, Benjamin Prestwich1, Nicholas Selby2, Maarten Taal2, and Susan T Francis1
1Sir Peter Mansfield Imaging Centre, University of Nottingham, Nottingham, United Kingdom, 2Centre for Kidney Research and Innovation, University of Nottingham, Derby, United Kingdom
1Sir Peter Mansfield Imaging Centre, University of Nottingham, Nottingham, United Kingdom, 2Centre for Kidney Research and Innovation, University of Nottingham, Derby, United Kingdom
Synopsis
We use multi-parametric renal MRI to assess structural and haemodynamic changes in CKD patients and assess these changes after one and two years to investigate the ability of MRI measures to predict and monitor progression of CKD. At baseline, higher renal cortex T1 and a reduction in renal cortex perfusion are associated with subsequent progression of CKD over 2 years suggesting that these MRI parameters may be predictors of progression. Renal cortex T1 and total kidney volume changed more in ‘progressors’ than in ‘stable’ participants over time compared to baseline suggesting these to be useful MRI measures to monitor progression.
Introduction
Chronic kidney disease (CKD) is a heterogeneous condition that affects 1 in 7 of the population. It can progress to end-stage-kidney disease (ESKD) requiring dialysis or transplantation, and increases cardiovascular risk. The treatment of CKD is supportive and non-specific. Currently CKD progression is monitored using estimated glomerular filtration rate (eGFR) and albuminuria, relatively crude measures with multiple limitations. There is need for improved methods to stratify patients according to risk of progression, guide and monitor therapy, and assess novel drug treatments for more efficient trial design. Our previous work [1] has shown that it is possible to differentiate between healthy volunteers (HVs) and CKD patients using MRI with significant differences between cortical and corticomedullary difference (CMD) in T1, cortical and medullary apparent diffusion coefficient (ADC), renal artery blood flow and cortical perfusion. MRI measures of T1, ADC, renal artery flow and cortical perfusion correlated with kidney function measures. Additionally, MRI measures (cortical T1 and ADC, T1 and ADC CMD, cortical perfusion) were able to differentiate between low/high interstitial fibrosis (IF) groups at 30–40% fibrosis threshold. In this follow-up study we sought to investigate the ability of MRI measures to predict and monitor progression of CKD over a two-year period.Methods
22 patients with CKD Stage 3 or 4 were recruited to the study (eGFR 39±14 ml/minute/1.73 m2, 17M, 5F, 61±24 years), 13 of these patients returned for a scan at 1 year and 2 years to assess progression. At baseline, fibrosis quantification was performed on CKD renal biopsies with Sirius red staining to determine % IF. At each scan session patients also had eGFR and serum creatinine measured.MR Acquisition: Scanning was performed on a 3T Philips Ingenia scanner. Localiser bFFE scans were acquired to estimate kidney volume. ASL, T1, and DWI data were collected using respiratory-triggered schemes in matched data space (5 coronal-oblique slices, SE-EPI readout, FOV 288x288mm, 3x3x5mm, SENSE 2); ASL data: flow alternating inversion recovery (FAIR) scheme (post-label delay times of 300, 500, 700, 900, and 1800ms, S/NS thickness 45/400mm), T1 data: 13 inversion times (200-1500ms), DWI data: 8 b-values (0-500s/mm2). T1 data were also collected using a higher resolution bFFE readout (1.5x1.5x5mm). T2* data was acquired using an mFFE scheme with 12 echo times (TE 5ms, ΔTE 3ms, 1.5x1.5x5mm).
Data Analysis: In-house software (Matlab) was used to generate multi-parametric maps: T1 data was fit voxel-wise to form T1 maps; perfusion maps were formed from the average perfusion-weighted (PW) images (S-NS) normalised to a base magnetisation image and fit using a kinetic model accounting for inflow time; DWI data was fit to both ADC and IVIM models to calculate D, D* and perfusion fraction maps; mFFE data was fit to compute R2* maps. Cortex and medulla masks were created, and histogram analysis applied to determine the mode of each MRI measure. Total kidney volume (TKV) was determined using Analyze9. CKD ‘progressors’ were defined as participants having a slope in eGFR of -5ml/min/1.73m2/yr or more negative over 2-years. Statistical analysis was performed using SPSS. A Shapiro-Wilk normality test was applied to each MRI measure. Normal data are expressed as mean±standard deviation and non-normal as median (interquartile range). No significant differences in renal MRI measures were observed between right and left kidneys (paired t-test), thus the mean of both kidneys was computed.
Results
Of the 22 participants recruited to the study, 7 were classified as ‘progressors’ and 15 as ‘stable’. 13 of the 22 participants, 4 ‘progressors’ and 9 ‘stable’, completed all three scans. At baseline, ‘progressors’ had significantly higher cortical T1 (Fig. 1A, p = 0.02) and lower cortical perfusion (Fig. 2A, p=0.03) than ‘stable’ patients. There was no signicant difference in TKV (Fig. 3A), ADC (Fig. 4A), renal cortex or medulla R2*, or renal biopsy measures of IF at baseline between ‘progressors’ and ‘stable’ patients. Over time, T1 increased in the ‘progressor’ group versus baseline (Fig. 1B-C), particularly in renal cortex at Year 1 (p=0.034) and Year 2 (p=0.053). Compared to baseline, TKV decreased (Fig. 3B-C), with a significantly greater decrease in the ‘progressor’ than ‘stable’ group (p=0.04). There was a trend for a reduction in ADC of the cortex and medulla in ‘progressors’ versus ‘stable’ participants (Fig. 4B, p > 0.05). No significant changes were seen over time from baseline or between groups in cortex perfusion (Fig. 2B-C), cortex or medulla R2*.Discussion and Conclusion
At baseline, higher renal cortex T1 and a reduction in renal cortex perfusion are associated with subsequent progression of CKD over 2 years suggesting that these MRI parameters may be predictors of progression. Renal cortex T1 and TKV changed more in ‘progressors’ than in ‘stable’ participants over time compared to baseline (with an increase in renal T1 and decrease in TKV), suggesting these to be useful MRI measures to monitor progression. Changes at one year were generally not significant, indicating that the optimal interval for serial MRI scans may be 2 years. We are now performing a multicentre CKD study to confirm these findings in a larger cohortAcknowledgements
This work was funded by Animal Free Research UK, Kidney research UK and the Medical Research Council.References
1. Buchanan CE, Mahmoud H, Cox EF et al. Quantitative assessment of renal structural and functional changes in chronic kidney disease using multi-parametric magnetic resonance imaging. Nephrol. Dial. Transplant. 2019: 1–10.Figures
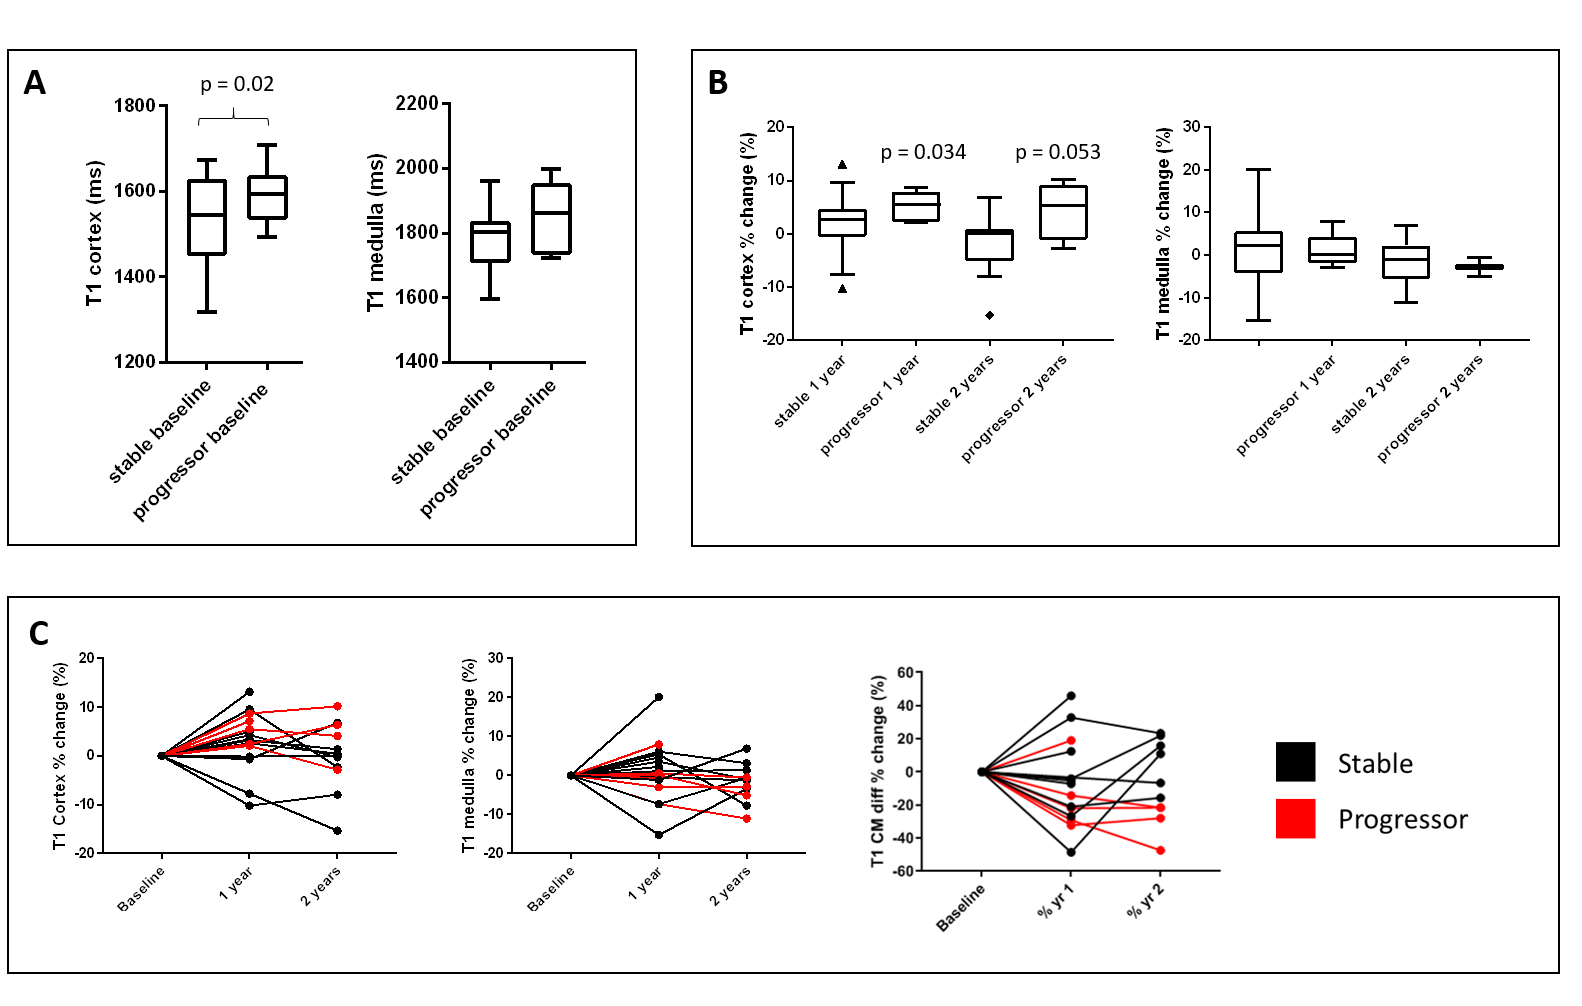
Figure 1: A)
Longitudinal relaxation time (T1) for the CKD cohort at baseline
divided into ‘stable’ (n=13) and ‘progressors’ (n=9), B) Percentage change in T1
at Year 1 and Year 2 as compared to baseline for the ‘stable’ and ‘progressor’
group, C) Individual subjects shown at baseline, Year 1 and Year 2 with the ‘stable’
group shown in black and ‘progressors’ in red. [CM diff = corticomedulllary
difference]
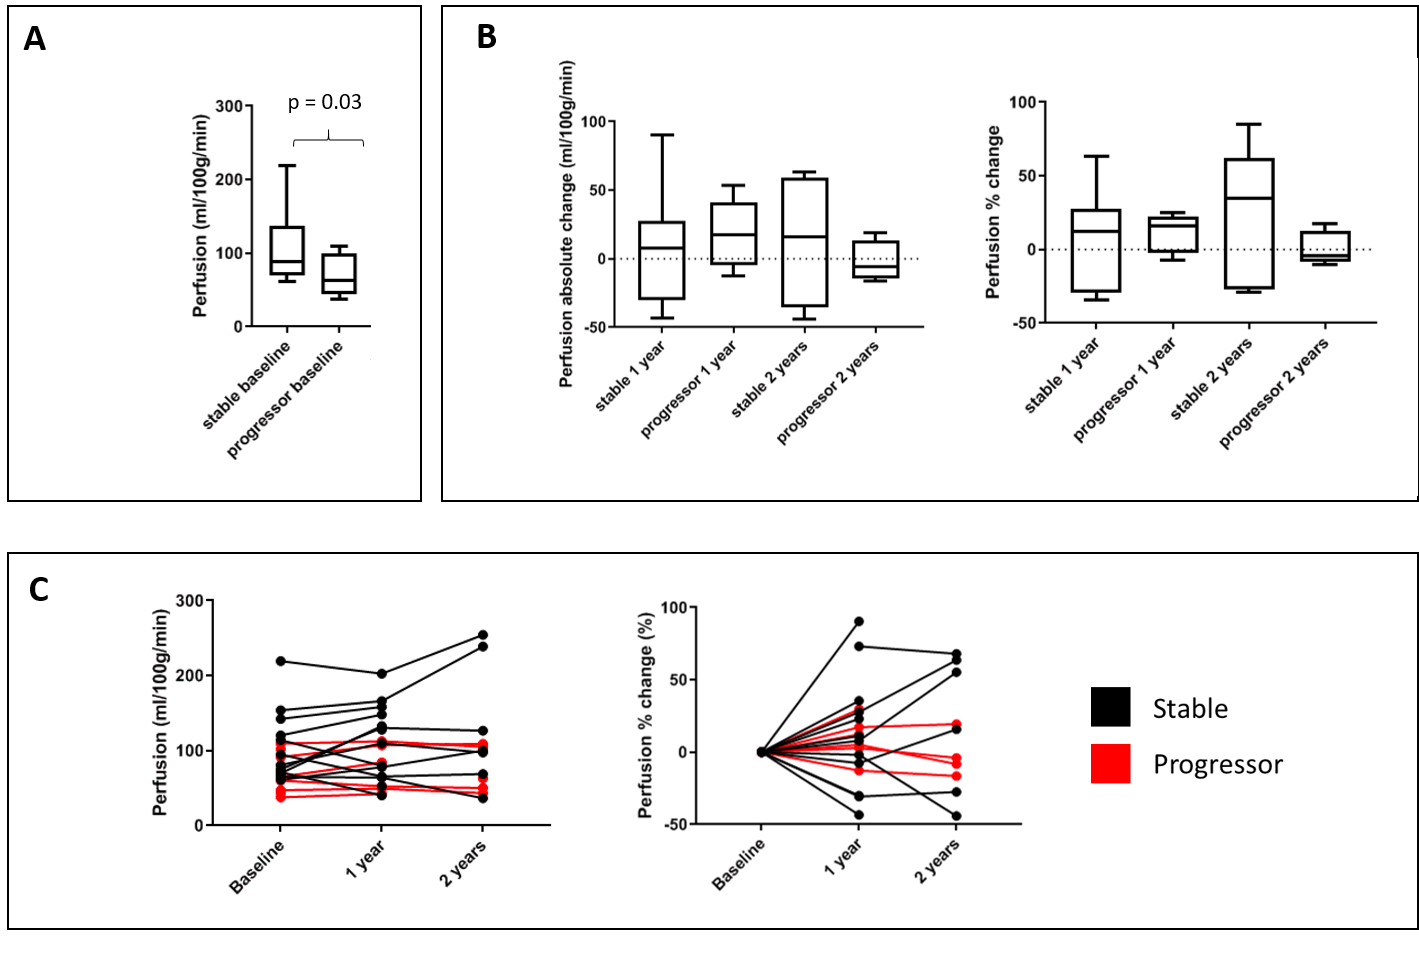
Figure 2: A) Renal cortex perfusion for the CKD cohort at baseline divided
into ‘stable’ (n=13) and ‘progressors’ (n=9), B) Percentage change in perfusion
at Year 1 and Year 2 as compared to baseline for the ‘stable’ and ‘progressor’
group. C) Individual subjects shown at baseline, Year 1 and Year 2 with the ‘stable’
group shown in black and ‘progressors’ in red.
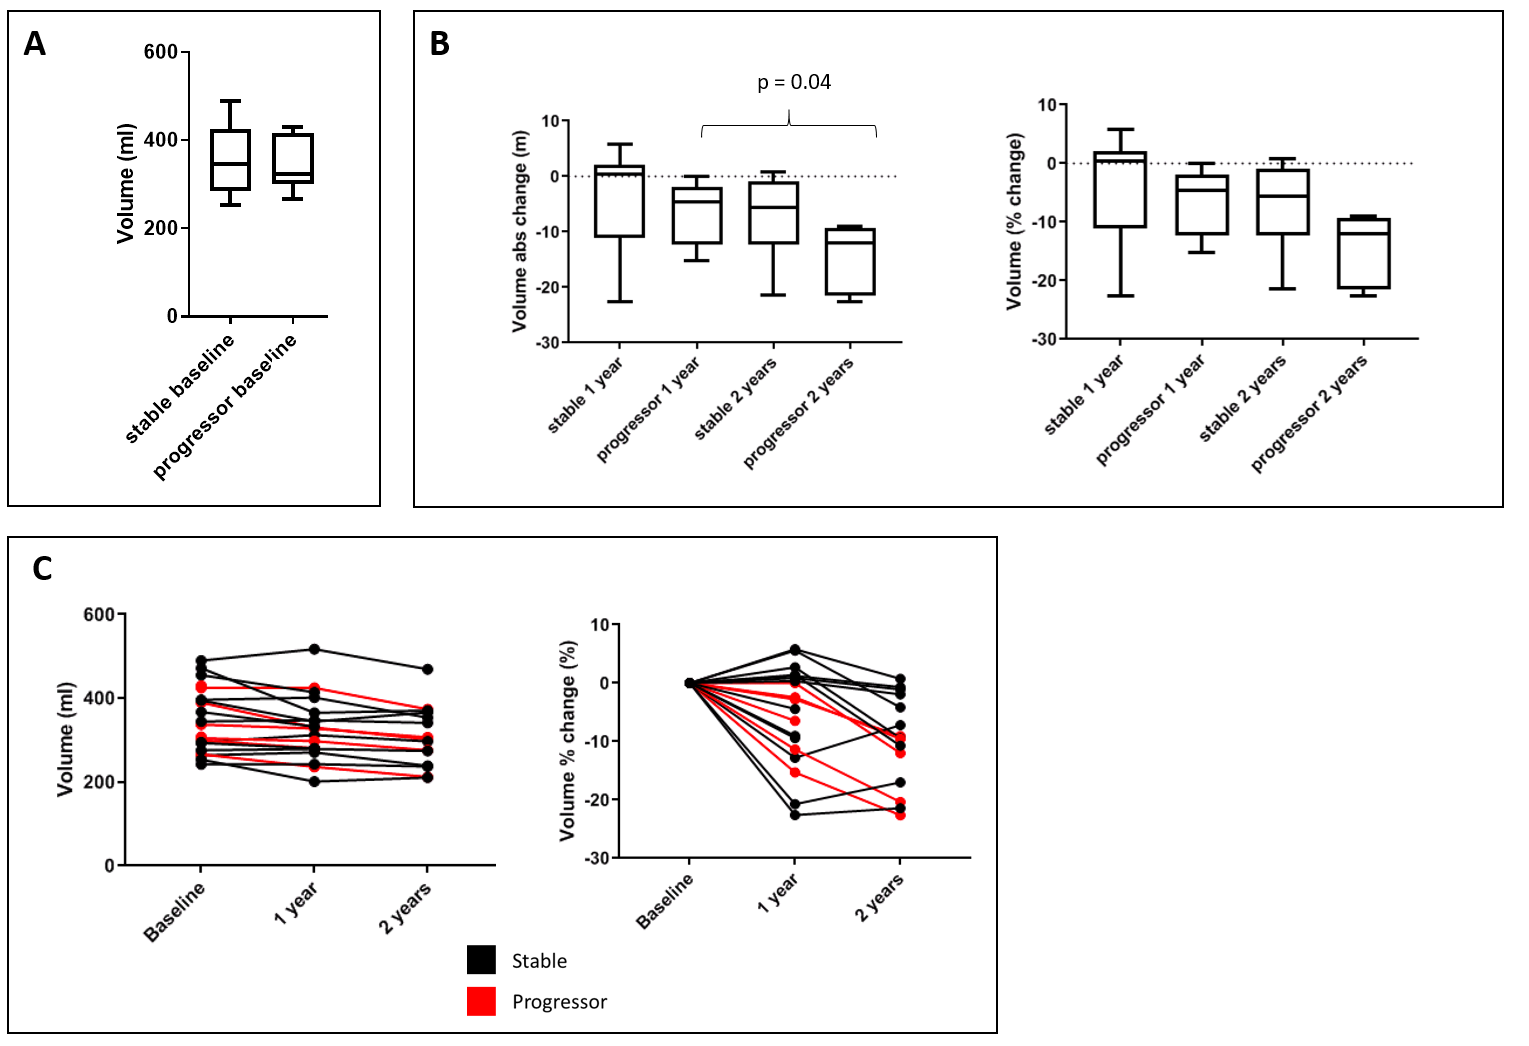
Figure 3:
Total kidney volume for the CKD cohort. Data is shown (A) at baseline divided
into ‘stable’ (n=13) and ‘progressors’ (n=9), (B) across each year with
absolute and percentage change in volume, and (C) each participant classified
as a ‘progressor’ (red) or ‘stable’ (black).
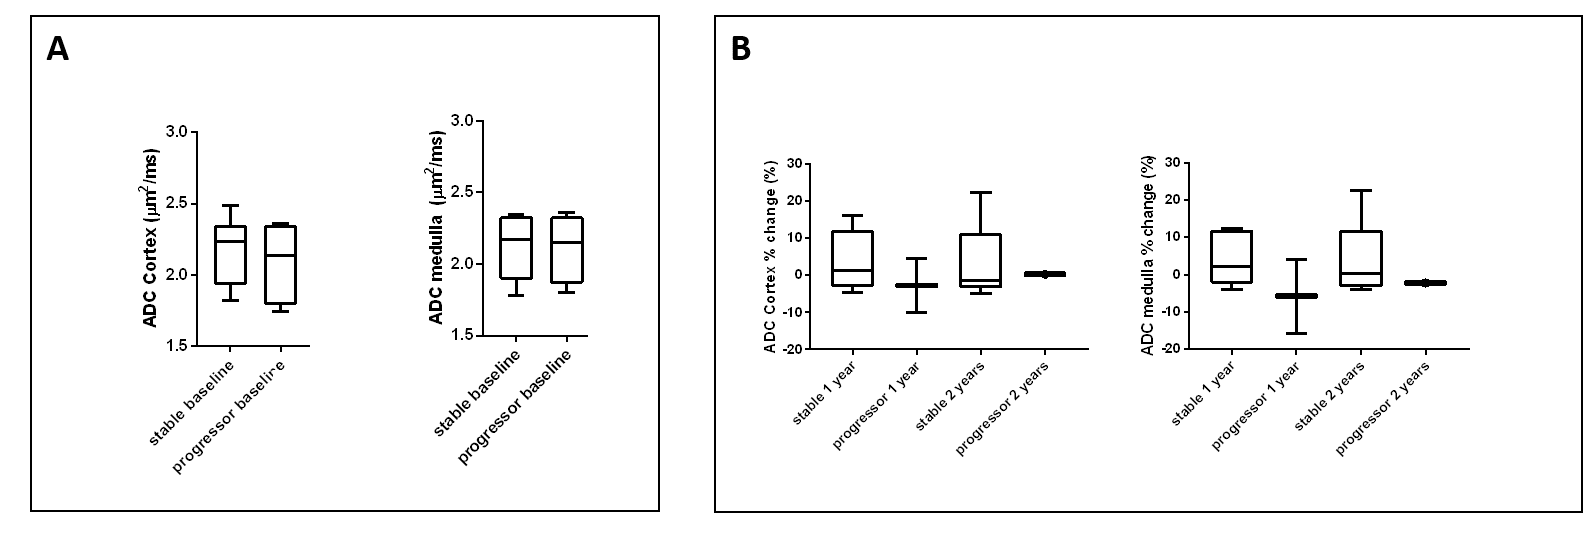
Figure 4: A) ADC for the CKD cohort at baseline divided into ‘stable’
(n=13) and ‘progressors’ (n=9), B) Percentage change in ADC at Year 1 and Year
2 as compared to baseline for the ‘stable’ and ‘progressor’ group.