0417
Harmonisation of Multiparametric Renal MRI for Multi-Centre Studies1Sir Peter Mansfield Imaging Centre, University of Nottingham, Nottingham, United Kingdom, 2Department of Radiology, University of Cambridge, Cambridge, United Kingdom, 3Great Ormond Street Institute of Child Health, University College London, London, United Kingdom, 4University of Sheffield, Sheffield, United Kingdom, 5Department of Radiology, Addenbrooke's Hospital, Cambridge, United Kingdom, 6Neuroradiological Academic Unit, UCL Queen Square Institute of Neurology, UCL, London, United Kingdom, 7Dementia Research Centre, UCL Queen Square Institute of Neurology, UCL, London, United Kingdom, 8Wellcome Centre for Human Neuroimaging, UCL Queen Square Institute of Neurology, UCL, London, United Kingdom
Synopsis
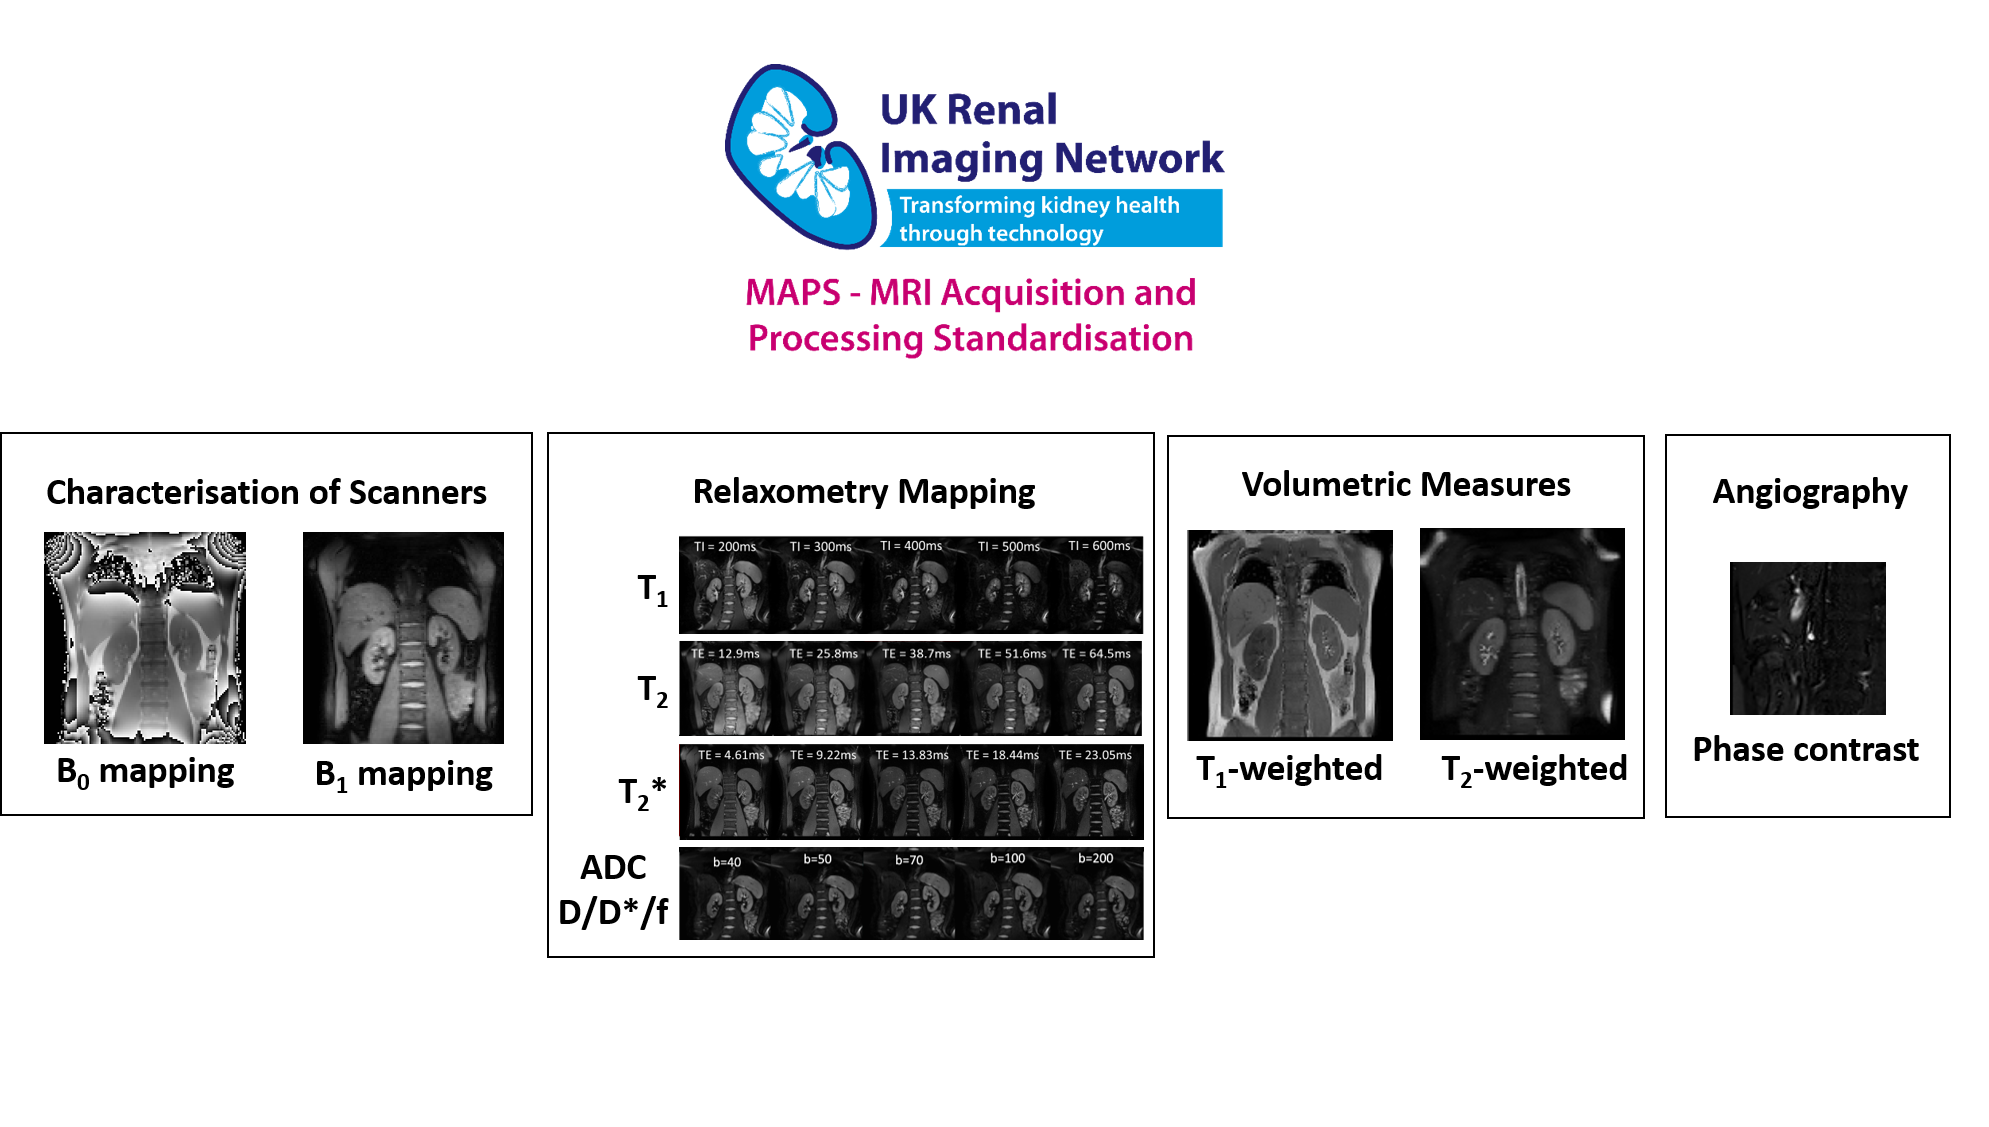
Standardisation and multicentre evaluation of renal MRI measures is crucial for clinical translation. Here we present a multiparametric renal MRI protocol comprising of B0 and B1 mapping, diffusion weighted imaging (DWI), T1, T2 and T2* mapping, phase contrast (PC-MRI) and volumetric T1- and T2-weighted scans that has been harmonised across GE, Philips and Siemens 3T scanners.
INTRODUCTION
Renal MRI has undergone significant developments in recent years. Now, standardisation and multicentre evaluation of measures is crucial for clinical translation. The UK Renal Imaging Network MRI Acquisition and Processing Standardisation (UKRIN-MAPS) [1,2] project aims to develop harmonized renal MRI protocols across MR vendors in line with recent consensus guidelines [3]. Here we present the process and resulting harmonised multiparametric renal 3T MRI acquisition protocols.METHODS
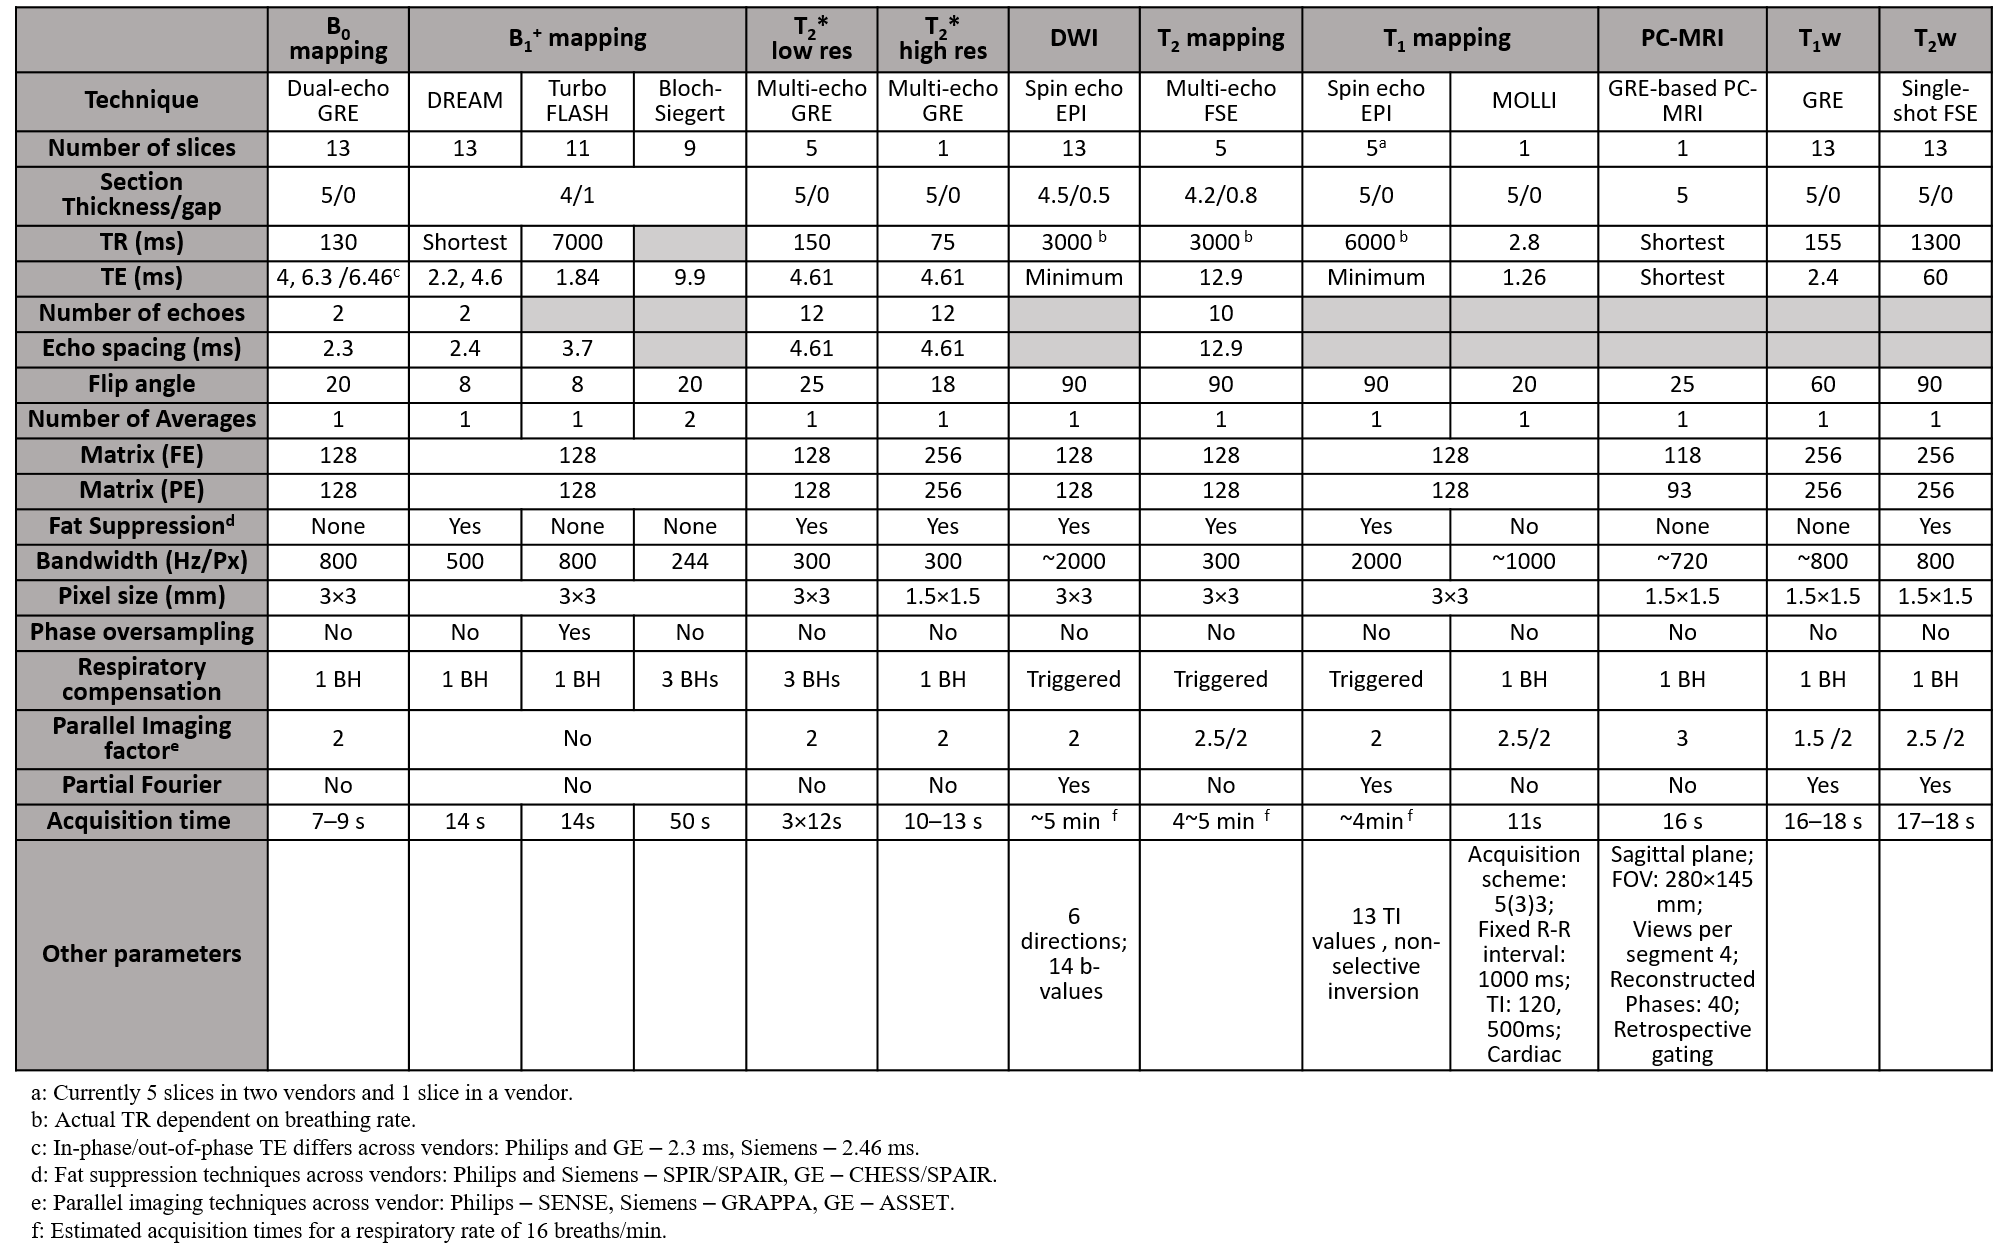
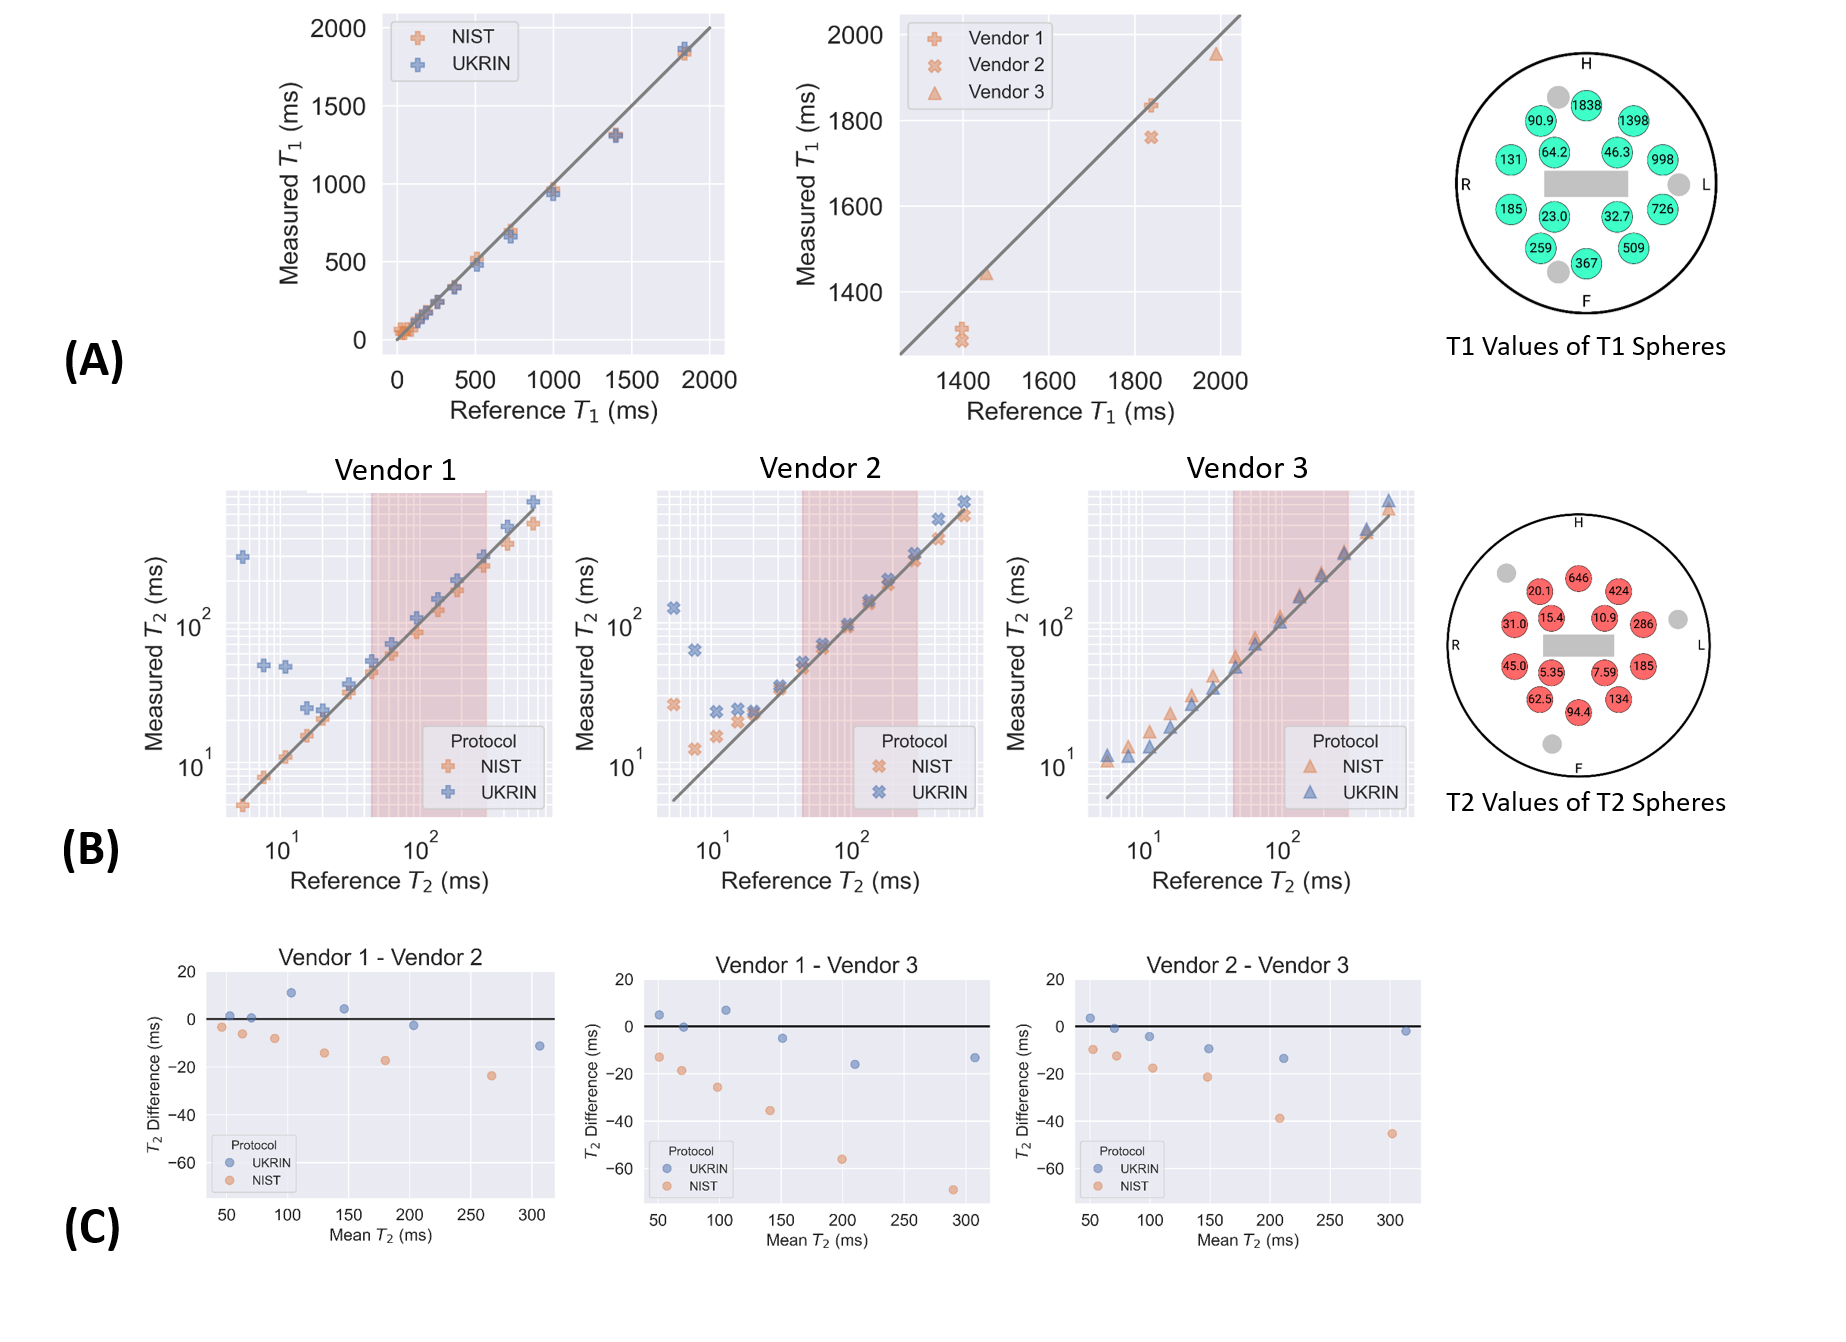
Multiparametric renal MRI protocols were optimised and harmonised across three MR vendors (Philips, Siemens and GE). This comprised of B0 and B1 mapping, diffusion weighted imaging (DWI), T1, T2 and T2* mapping, phase contrast (PC-MRI) and volumetric T1- and T2-weighted scans (Figure 1). Initial harmonisation was performed and assessed using a travelling kidney study to determine the differences between protocols across the vendors, with four healthy subjects scanned at three UK sites each on a different vendor 3T scanner. Phantoms were also used to validate harmonisation of sequences at each site. The ISMRM/NIST system phantom [4] was used for the standardization of T1 mapping, T2 mapping, T1 and T2 weighted scans. The Qalibre Diffusion phantom [5] was used for standardization of DWI. Between vendors, harmonization of MR sequences was performed for spatial resolution, field of view (FOV), slice orientation and ordering, sequence timings (repetition time – TR, echo time – TE, inversion time – TI and echo-spacing), bandwidth, flip angle, fat-suppression scheme and flow compensation. If matching was not possible, e.g. due to an imposed step size, values were set as close as possible. For sequences which used parallel imaging, vendor specific acceleration methods (ASSET, GRAPPA, SENSE) were used.RESULTS
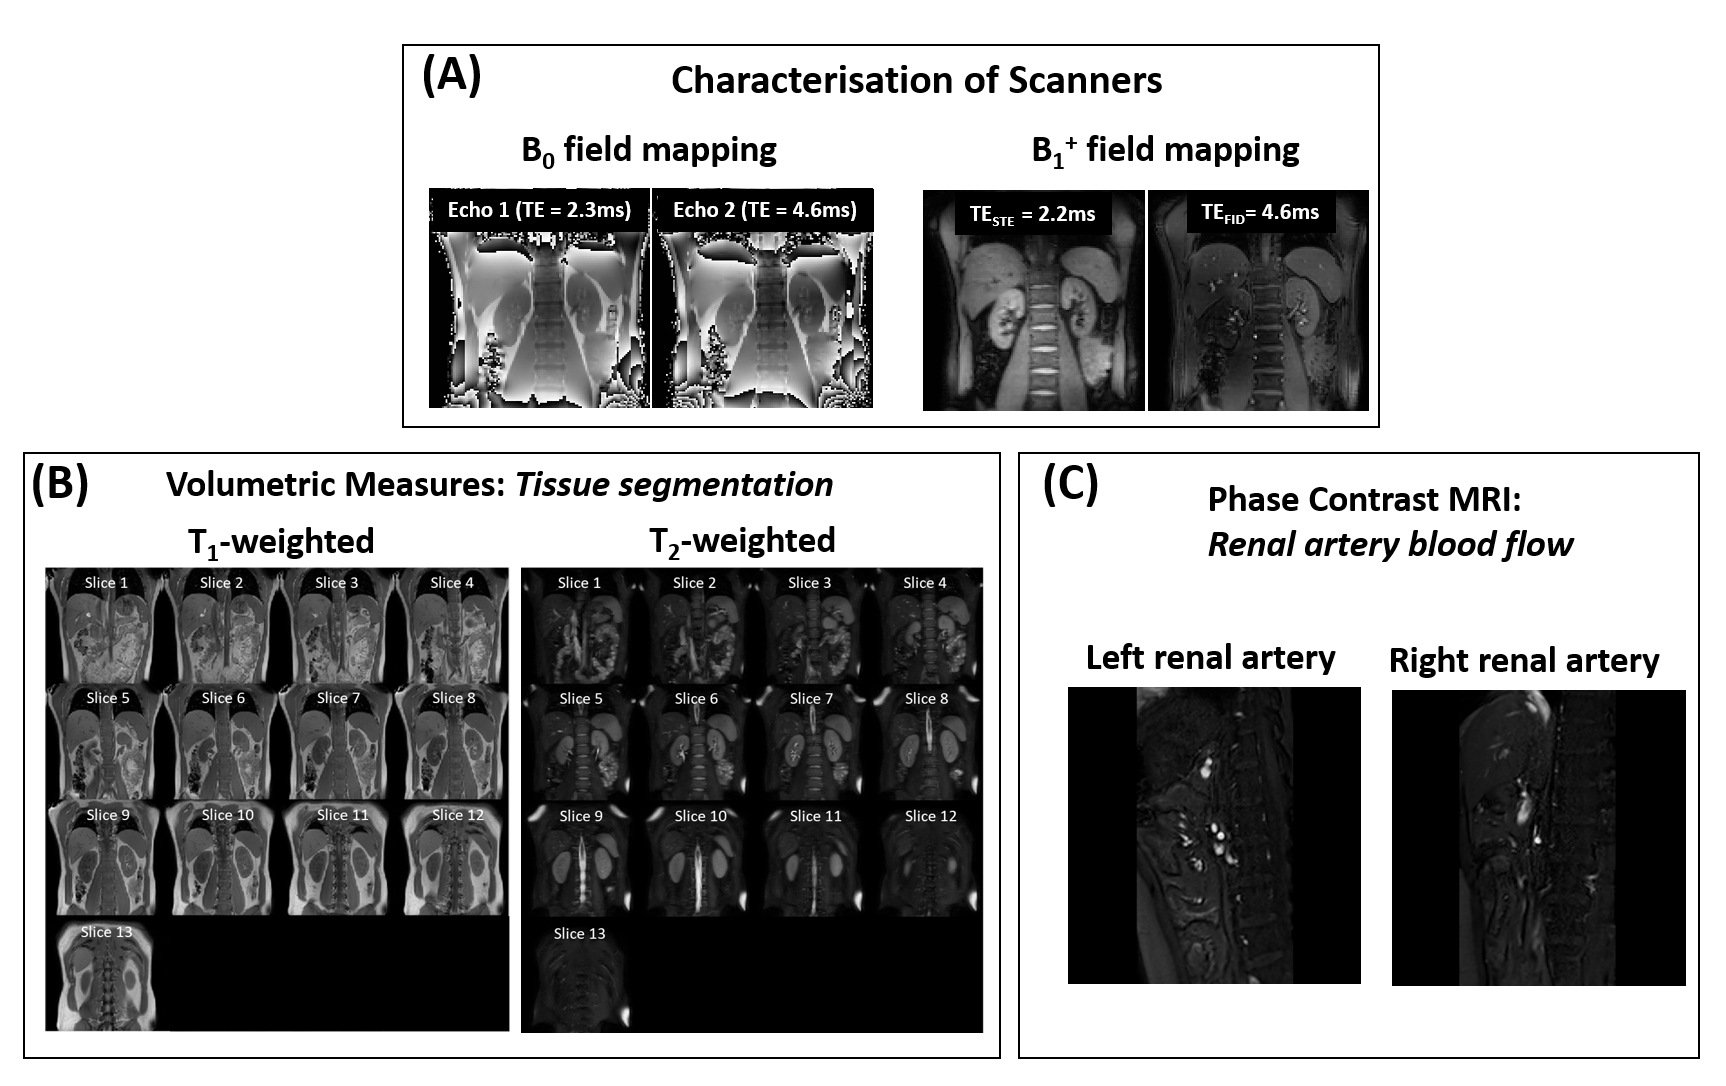
All sequences were acquired using a (i) 384×384 mm FOV to ensure sufficient coverage in patient groups (excluding PC-MRI which had a 280x145mm FOV); (ii) user-defined shim volume covering both kidneys; and (iii) 2D readout scheme in a coronal-oblique orientation (excluding PC-MRI which was collected sagitally). All images were acquired in matched native space, with breath-hold (BH) and respiratory triggered scans acquired at end-expiration to enable multiparametric analysis of scans. Phantom results are shown in Figure 2, illustrating the harmonised protocols result in comparable relaxometry measures across vendors. Detailed protocol parameters are listed in Table 1 with a qualitative description of choices outlined below. Example images collected on a given vendor are shown in Figure 3 and Figure 4.B0 mapping: used an in-phase dual-echo mapping scheme with phase images saved to generate B0 maps offline using processing software harmonised across vendors.
B1+ mapping: used the optimal sequence from each vendor: DREAM [6] for Philips, TurboFLASH B1 mapping [7] for Siemens and Bloch-Siegert [8] for GE.
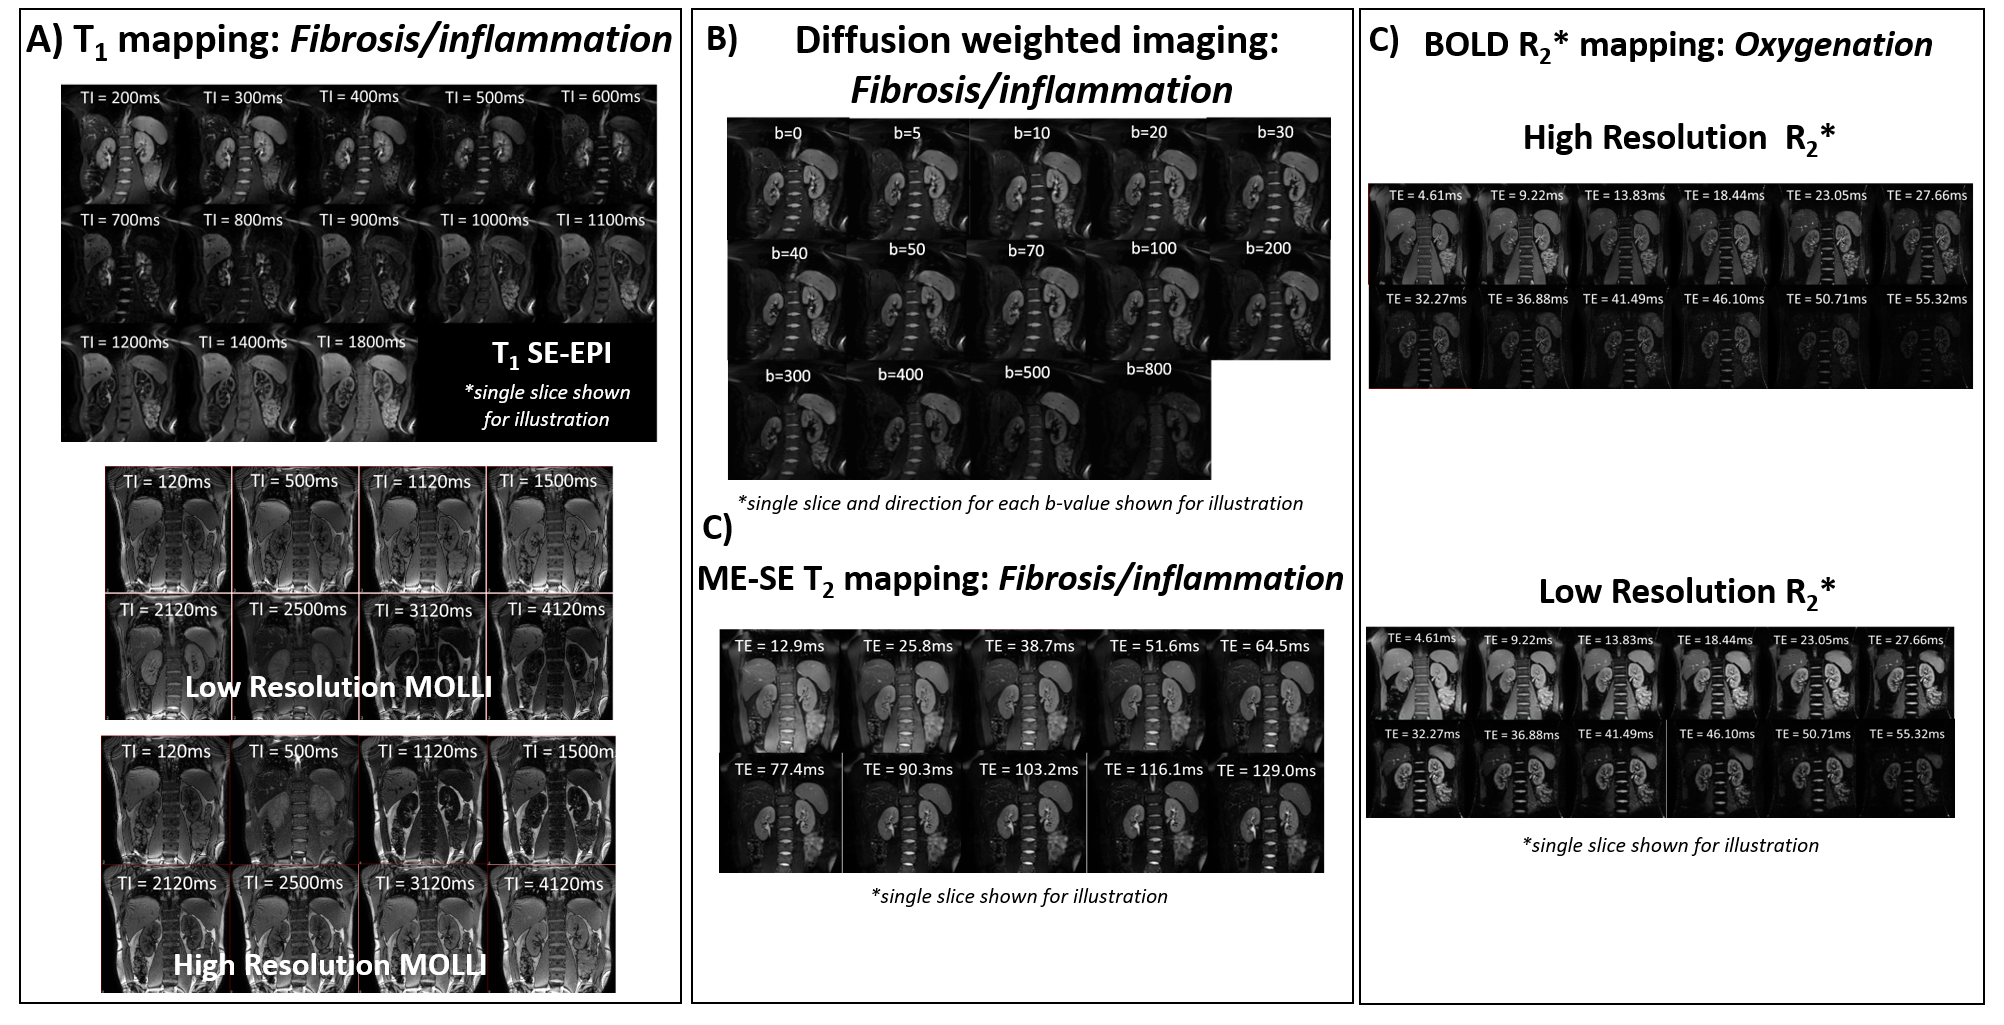
R2* mapping: was collected using both a multi-slice sequence with low in-plane resolution (3×3×5mm3) and a single-slice acquisition with high in-plane resolution (1.5×1.5×5mm3) for improved corticomedullary definition. The gradient echo (GRE) data was collected in-phase (TE/ΔTE = 4.61ms) to eliminate chemical shift effects and all slices were collected within one BH, with both magnitude and phase data saved.
DWI: data was collected using respiratory triggering with monopolar diffusion gradients in 6-directions and a spin echo-echo-planar-imaging (SE-EPI) readout at 14 b-values (0, 5, 10, 20, 30, 50, 100, 200, 300, 400, 500, 40, 70, 800 s/mm2).
T1 mapping: was acquired using a (non-selective) inversion-recovery SE-EPI sequence with a respiratory triggering scheme [9]. For optimisation of inversion time (TI) values, data was collected at TIs ranging from 100 to 2500 ms. On the phantom, the mean percentage error in the physiologically relevant range for cortex and medulla at 3T (1400-1900 ms) was 3.1%, 6.1% and 1.15% for the three vendors (Figure 2A). T1 mapping data was also collected using a single slice Modified Look-Locker Imaging (MOLLI) sequence [10] with a 5(3)3 acquisition scheme with fixed spacing at both low and high in-plane resolution to match the R2* mapping acquisition.
T2 mapping: a range of methods were evaluated [11]. Data was acquired using a multi-echo spin-echo sequence (TE=12.9–129 ms in 12.9 ms steps) with constant refocussing flip angle of 180°; this sequence was chosen based on its availability on all vendors. Figure 2B and C show the percentage error of T2 values in the physiologically relevant range (45–286 ms) across the different vendors and Bland-Altman plots demonstrating the agreement between the T2 measurements from different vendors.
PC-MRI: imaging datasets were acquired using a single sagittal oblique slice (FOV 280×145 mm) placed perpendicular to each renal artery. Each dataset was collected in one breath-hold with retrospective cardiac triggering using a peripheral pulse unit PPU.
T1w- and T2w- imaging: A whole kidney T1w-GRE sequence and a T2w-single-shot FSE sequence were collected to measure corticomedullary differentiation and kidney volume assessment respectively.
DISCUSSION AND CONCLUSION
We present a multiparametric renal MRI protocol, harmonised across GE, Philips and Siemens 3T scanners. Protocol parameters were chosen to be in line with recently published consensus statements, and to be well suited to both established and emerging processing methods (e.g. deep learning methods to assess kidney volume [12]). Future work will focus on optimisation and harmonisation of arterial spin labelling (ASL). We are currently scanning healthy volunteers to form a normative data set and will conduct a multi-centre CKD clinical study using this protocol.Acknowledgements
This work is funded by MRC Partnership grant MR/R02264X/1.References
1. Buchanan CE, Nery F, Priest AN., et al. Travelling kidneys: Multicentre multivendor variability of renal BOLD and T1 mapping – preliminary results. in Proc. Intl. Soc. Mag. Reson. Med. 28 vol. 28 2636 (2020).
2. Nery F., Buchanan CE, Priest AN et al. Travelling kidneys: Multicentre multivendor variability of renal diffusion-weighted imaging – preliminary results. in Proc. Intl. Soc. Mag. Reson. Med. 28 vol. 28 0945 (2020).
3. Mendichovszky I, Pullens P, Dekkers I et al. Technical recommendations for clinical translation of renal MRI: a consensus project of the Cooperation in Science and Technology Action PARENCHIMA. Magn. Reson. Mater. Physics, Biol. Med. 2019.
4. Russek SE, Boss M, Jackson EF, et al. Characterization of NIST/ISMRM MRI system phantom. In: Proc. Intl. Soc. Mag. Reson. Med. 20. Online; 2012 (p. 2456).
5. https://qmri.com/qmri-solutions/adc-dwi-imaging-phantom/
6. Nehrke K, Börnert P. DREAM-a novel approach for robust, ultrafast, multislice B1 mapping. Magn. Reson. Med. 2012;68:1517–1526.
7. Klose U. Mapping of the Radio Frequency Magnetic Field With A Mr Snapshot Flash Technique. Med. Phys. 1992.
8. Sacolick LI, Wiesinger F, Hancu I, Vogel MW. B1 mapping by Bloch-Siegert shift. Magn. Reson. Med. 2010;63:1315–1322.
9. Cox EF, Buchanan CE, Bradley CR, et al. Multiparametric renal magnetic resonance imaging: Validation, interventions, and alterations in chronic kidney disease. Front. Physiol. 2017;8:1–15.
10. Messroghli DR, Radjenovic A, Kozerke S, et al. Modified Look-Locker inversion recovery (MOLLI) for high-resolution T1 mapping of the heart. Magn. Reson. Med. 2004;52:141–6.
11. Daniel A, Cox E, Buchanan C, Francis S. A Comparison of T2 Mapping Methods in the Kidneys. In: Proc. Intl. Soc. Mag. Reson. Med. 28. Online; 2020.
12. Daniel A, Buchanan C, Allcock T, et al. Automated Renal Segmentation in Healthy and Chronic Kidney Disease Subjects Using A Convolutional Neural Network. In: Proc. Intl. Soc. Mag. Reson. Med. 28. Online; 2020.
Figures