0411
Numerical Body Model Inference for Personalized RF Exposure Prediction in Neuroimaging at 7T1C.J. Gorter Center, dept. of Radiology, Leiden University Medical Center, Leiden, Netherlands, 2Division of Image Processing, dept. of Radiology, Leiden University Medical Center, Leiden, Netherlands, 3Circuits and Systems, dept. of Microelectronics, Delft University of Technology, Delft, Netherlands
Synopsis
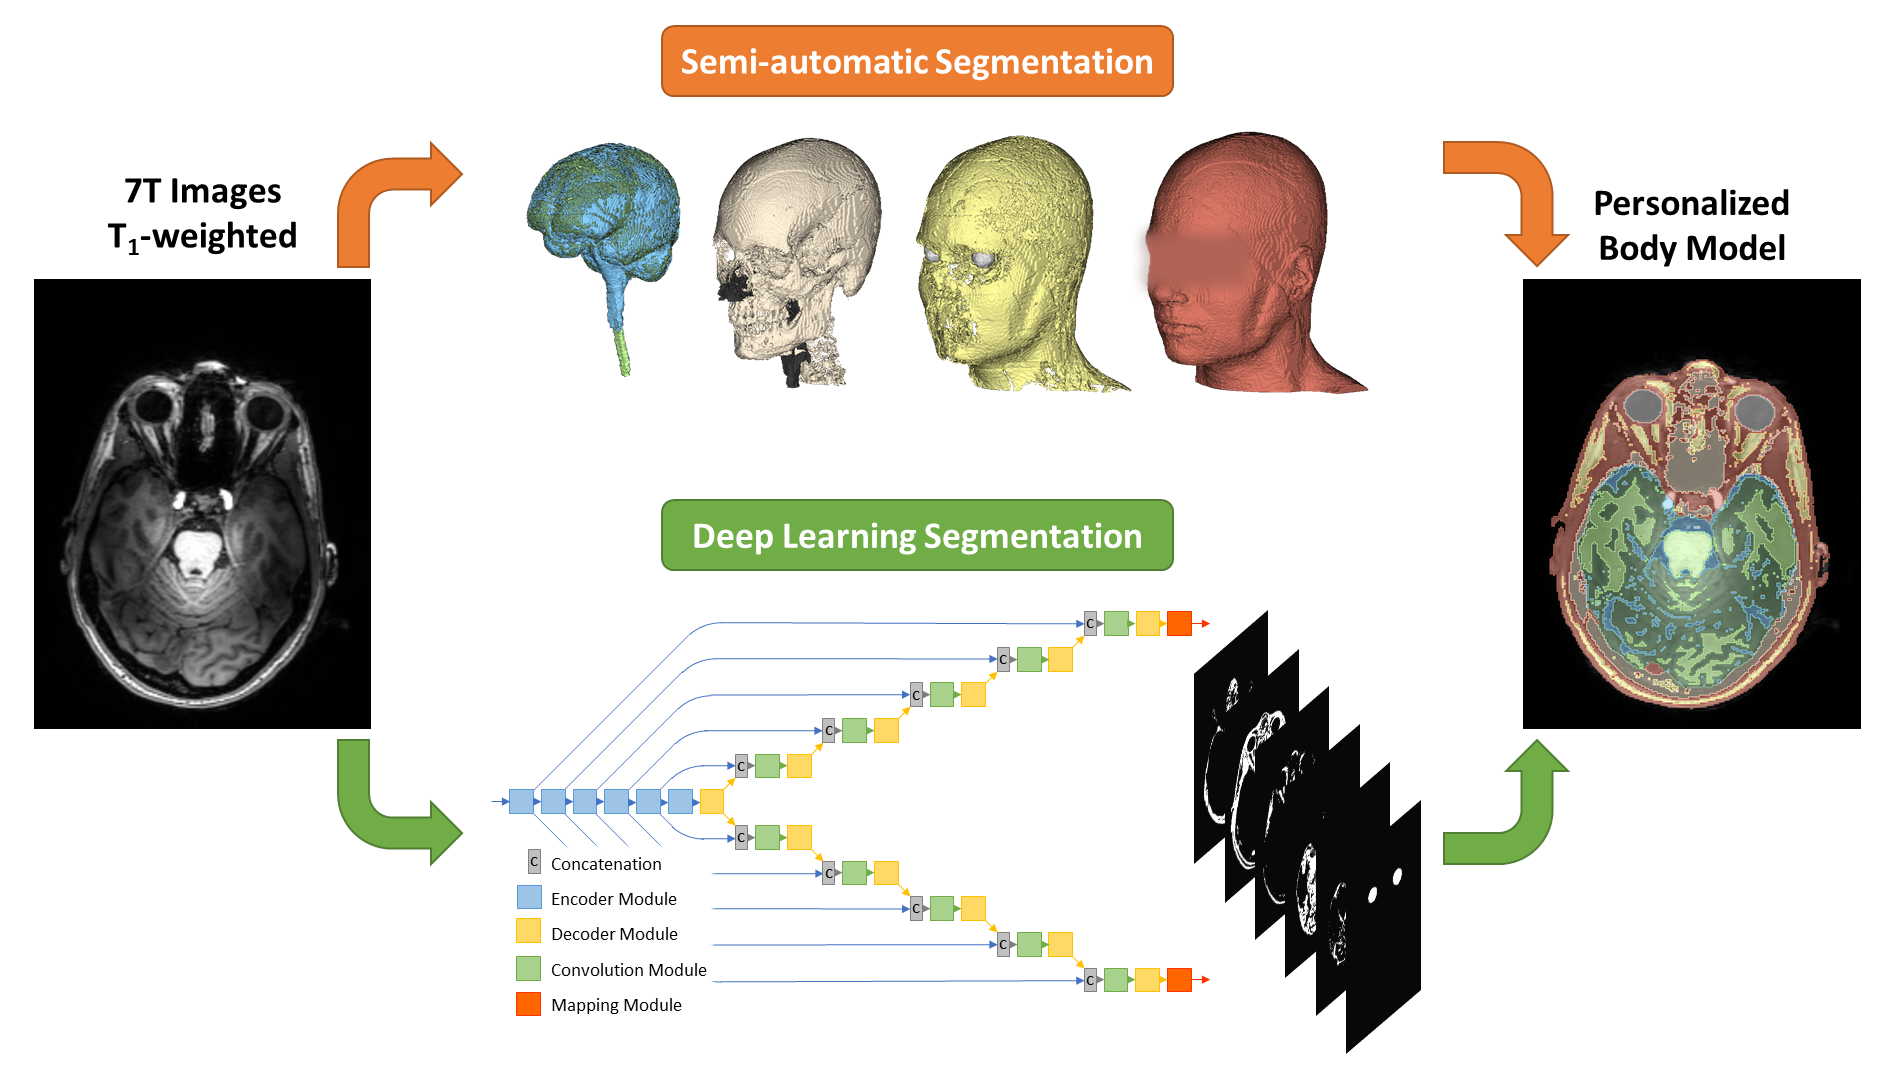
Compliance with RF exposure limits in ultra-high field MRI is typically based on “one-size-fits-all” safety margins to account for the intersubject variability of local SAR. In this work we have developed a semantic segmentation method based on deep learning, which is able to generate a subject-specific body model for personalized RF exposure prediction at 7T.
Introduction
Ultra-high field MRI (B0 ≥ 7T) has been shown to produce higher resolution structural and physiological information than at 3T, particularly in the brain. At ultra-high field, parallel transmission (PTx) is a key technology to address the increased non-uniformity of the radiofrequency (RF) field distribution. However, this improved flexibility comes at the cost of an increased uncertainty in the resulting local specific absorption rate (SAR). In addition, local SAR can vary by up to ~50% depending on the anatomy of the particular subject, including aspects such as tissue distribution and positioning within the RF coil.1,2 PTx systems are therefore operated with overly-conservative safety margins in order to account for these variations, which compromise system performance and limit utilization.We aim to improve SAR estimation by generating a subject-specific numerical body model directly from 7T neuroimaging data. Several groups have previously demonstrated such procedures at 3T using semi-automatic segmentation,3,4 computer vision5,6 or deep learning.7 These approaches are however not directly suited for 7T due to the increased image non-uniformities present, and hence would require either time-consuming manual corrections or an additional MR examination at 3T. We propose a deep learning-based method which accounts for the image non-uniformities observed at 7T, to generate a subject-specific numerical body model directly from a T1-weighted image dataset, enabling seamless integration into the MR examination workflow.
Methods
Semi-automatic Segmentation: A multi-contrast MR protocol was acquired at an isotropic spatial resolution of 1mm3 in 8 healthy volunteers (4 male, 4 female, age 26.7 ± 8.9) on a Philips Achieva 7T MRI system equipped with a Nova Medical quadrature birdcage head coil and a 32-channel receive coil array. The image data were segmented into 8 tissues to allow for accurate predictions of local SAR8 through a semi-automatic pipeline using Matlab, FSL and 3D Slicer. The pipeline started with B1-based intensity bias-correction9 and rigid registration.10 Brain tissues were segmented using FSL-FAST11 and the eyes were segmented through a region growing algorithm in 3D Slicer. A body tissue mask and its complementary bone and air segments were obtained by segmenting proton density-weighted images, followed by manual correction of image artefacts. Fat and water segments were finally assigned based on Dixon data.Deep Learning Segmentation: The convolutional neural network was based on the ForkNet architecture7 and was implemented using Tensorflow in Python. The 2D network had a single input and multiple outputs, each corresponding to one of the tissue labels. The network was trained on the semi-automatic segmentations using randomized slices of the T1-weighted images as the input, and corresponding ground truth tissue masks as the training and validation data. Cross-validation was performed following a leave-one-out strategy in which one subject was removed from the dataset and used for testing. The network was trained in 20 epochs and used Dice Loss as a loss function. A schematic illustration of the workflow is shown in Figure 1.
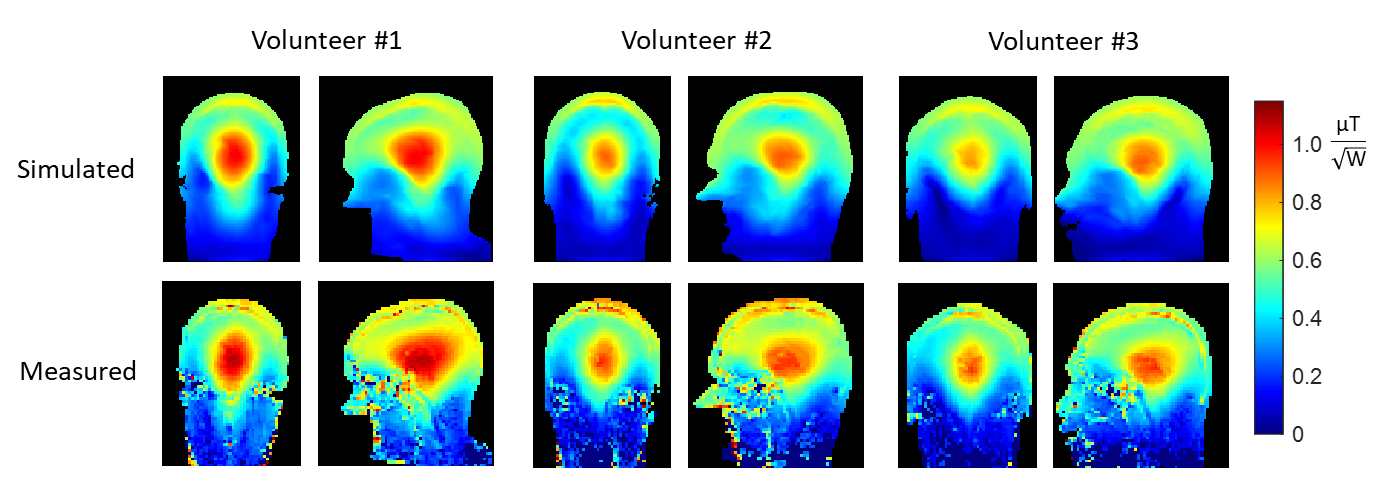
RF Exposure Prediction: The B1+ field and 10g-averaged SAR distribution (SAR10g) in the ground truth and network-generated body models were simulated in Remcom XFdtd, using a 2-mm isotropic grid within the model. The RF coil model was a 30-cm diameter 16-rung shielded high pass birdcage structure driven in quadrature mode, which was validated in a head-sized phantom with known properties.12 The ground truth body models were validated using measured B1+ maps, since the actual SAR10g distribution cannot be measured. All RF field data were normalized to an accepted power of 1 W, and simulations took around 2 min per body model.
Results
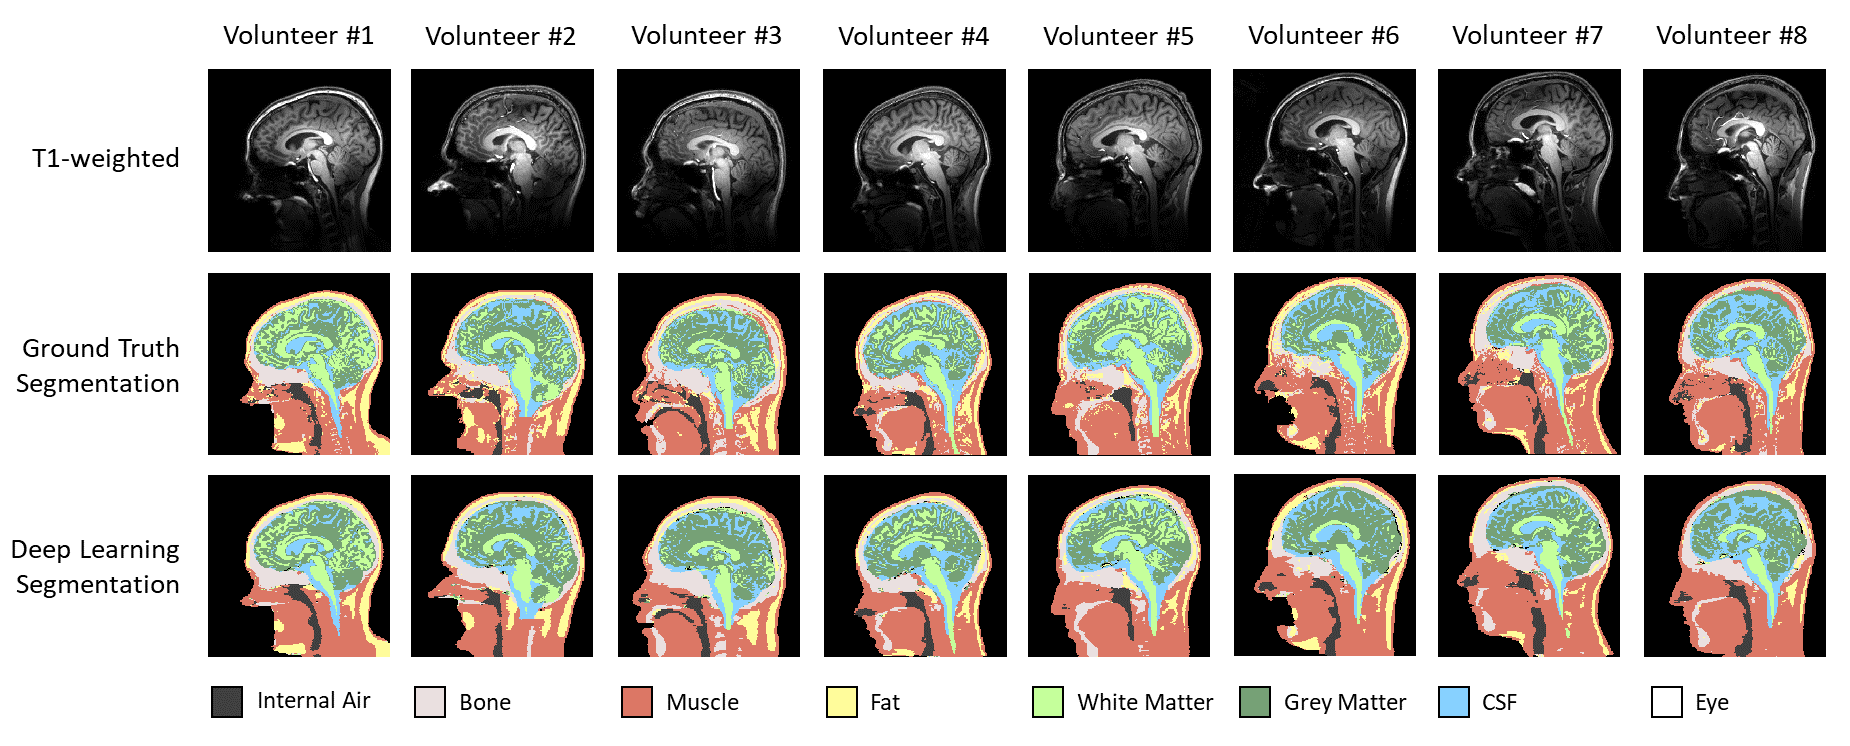
The experimental validation of the ground truth models is shown in Figure 2. As can be seen, the relative B1+ distribution as well as the peak B1+ efficiency is accurately modelled.The training of the network took approximately 1 hour using a Tesla K40 GPU, reaching an overall Dice coefficient value of 0.81±0.09 (mean±standard deviation) over all segments. The final inference of a 3D body model took around 2 s per subject. A comparison between ground truth and network-generated segmentations is shown in Figure 3.
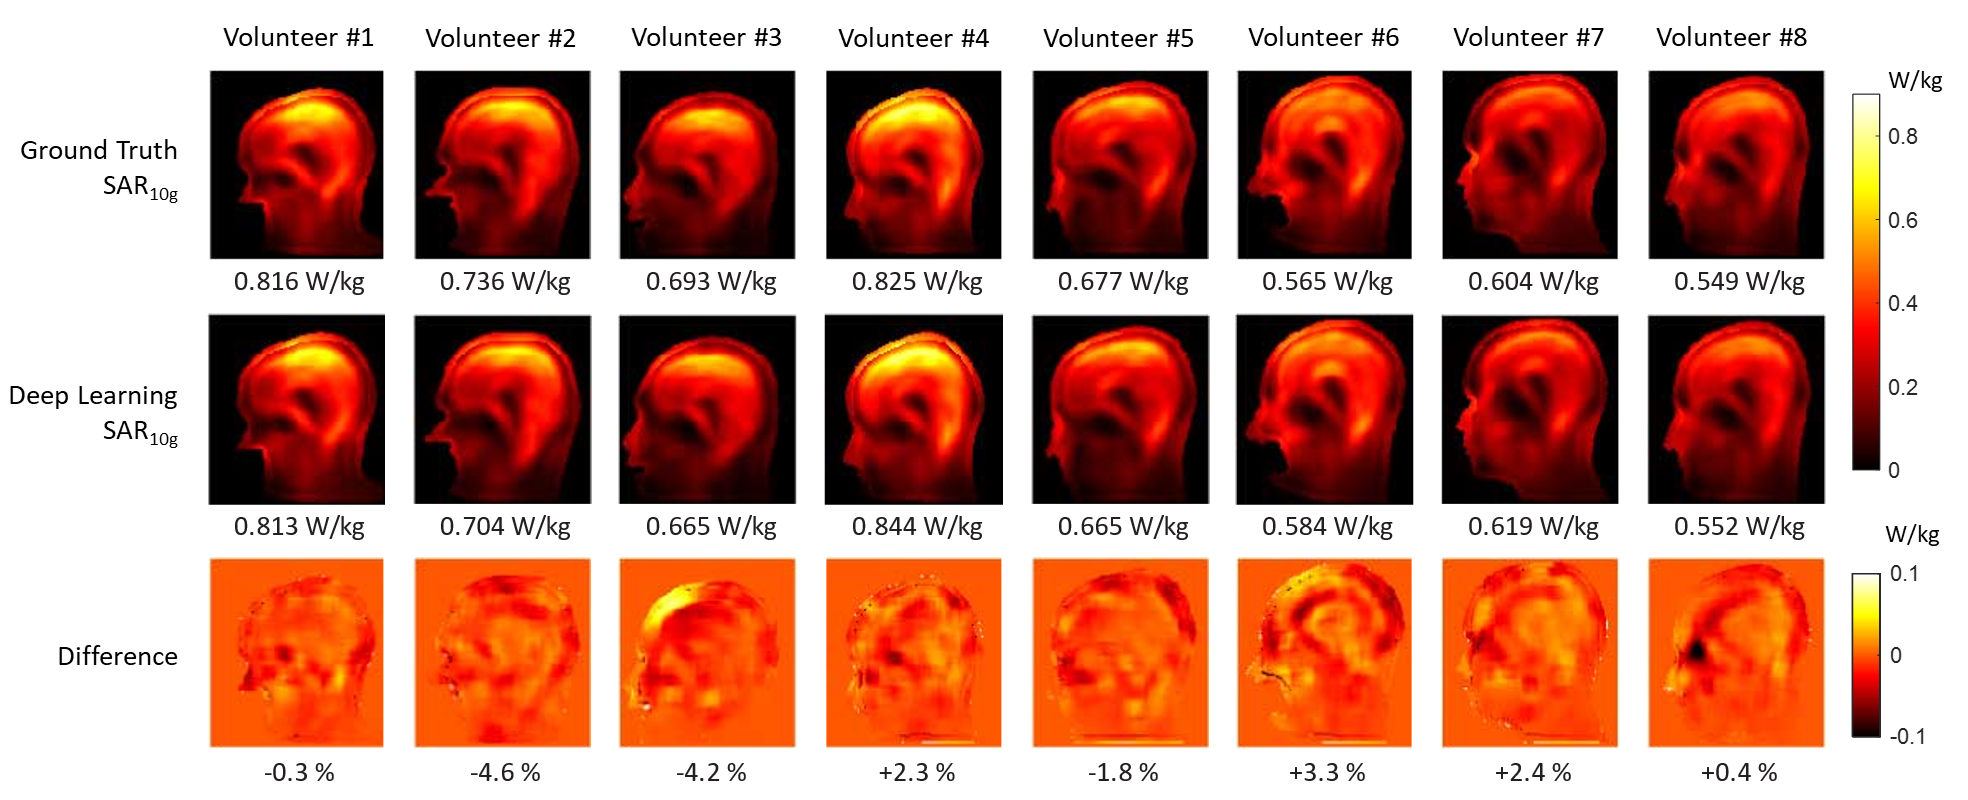
Simulated SAR10g distributions in the ground truth and network-generated body models are shown in Figure 4. The peak SAR10g in the network-generated body models is within 5% of the peak value obtained in the corresponding ground truth body models for all cases, with an overall mean ± standard deviation of 0.683±0.106 W/kg. This is well within the expected uncertainty margin of around ~10% for RF exposure predictions.12
Discussion and Conclusion
This work demonstrates that a body model for personalized RF exposure prediction can be derived from a T1-weighted 7T image dataset, which is often already included in neuroimaging protocols as a basic anatomical reference. The total RF exposure assessment took under 5 min., with the deep learning segmentation proposed here only taking 2 s. Future work will therefore aim to reduce the acquisition and RF simulation time required, to further improve integration into the MR examination workflow. In a PTx setting, the B1+ predictions obtained from the RF simulation may also be used in subsequent PTx pulse calculations, potentially saving time by avoiding B1+ calibration procedures. Future work will also include extending the SAR10g analysis to PTx excitations using a RF transmit array.Acknowledgements
This work was supported by the Netherlands Organization for Scientific Research (NWO) through a VENI fellowship (TTW.16820).References
1. Le Garrec M, Gras V, Hang MF, Ferrand G, Luong M, Boulant N. Probabilistic analysis of the specific absorption rate intersubject variability safety factor in parallel transmission MRI. Magn. Reson. Med. 2017;78:1217–1223 doi: 10.1002/mrm.26468.
2. Ajanovic A, Hajnal J V, Malik S. Positional Sensitivity of Specific Absorption Rate in Head at 7T. In: Proceedings of the 28th Annual Meeting of ISMRM.; 2020. p. 4251.
3. Homann H, Börnert P, Eggers H, Nehrke K, Dössel O, Graesslin I. Toward individualized SAR models and in vivo validation. Magn. Reson. Med. 2011;66:1767–76 doi: 10.1002/mrm.22948.
4. Laakso I, Tanaka S, Koyama S, De Santis V, Hirata A. Inter-subject variability in electric fields of motor cortical tDCS. Brain Stimul. 2015;8:906–913 doi: 10.1016/j.brs.2015.05.002.
5. Torrado-Carvajal A, Eryaman Y, Turk EA, et al. Computer-Vision Techniques for Water-Fat Separation in Ultra High-Field MRI Local Specific Absorption Rate Estimation. IEEE Trans. Biomed. Eng. 2019;66:768–774 doi: 10.1109/TBME.2018.2856501.
6. Milshteyn E, Guryev G, Torrado‐Carvajal A, et al. Individualized SAR calculations using computer vision‐based MR segmentation and a fast electromagnetic solver. Magn. Reson. Med. 2021;85:429–443 doi: 10.1002/mrm.28398.
7. Rashed EA, Gomez-Tames J, Hirata A. Development of accurate human head models for personalized electromagnetic dosimetry using deep learning. Neuroimage 2019;202:116132 doi: 10.1016/j.neuroimage.2019.116132.
8. de Buck MHS, Jezzard P, Jeong H, Hess AT. An investigation into the minimum number of tissue groups required for 7T in-silico parallel transmit electromagnetic safety simulations in the human head. Magn. Reson. Med. 2021;85:1114–1122 doi: 10.1002/mrm.28467.
9. Brink WM, Webb AG. DREAM-Based Receive Uniformity Correction for Whole Body MRI at 3T. In: Proceedings of the 24th Annual Meeting of ISMRM, Singapore. ; 2016. p. 0938.
10. Klein S, Staring M, Murphy K, Viergever MA, Pluim JPW. Elastix: A Toolbox for Intensity-Based Medical Image Registration. IEEE Trans. Med. Imaging 2010;29:196–205 doi: 10.1109/TMI.2009.2035616.
11. Zhang Y, Brady M, Smith S. Segmentation of brain MR images through a hidden Markov random field model and the expectation-maximization algorithm. IEEE Trans. Med. Imaging 2001;20:45–57 doi: 10.1109/42.906424.
12. Brink WM, Wu Z, Webb AG. A Simple Head-sized Phantom for Realistic Static and Radiofrequency Characterization at High Fields. Magn. Reson. Med. 2018 doi: 10.1002/mrm.27153.
Figures