0407
Going Below The Neck: Physiological limits on use of 300 mT/m gradients in the human body1Cardiff University Brain Research Imaging Centre (CUBRIC), Cardiff University, Cardiff, United Kingdom, 2Siemens Healthcare Ltd, Camberly, United Kingdom, 3Siemens Healthcare GmbH, Erlangen, Germany, 4Mary McKillop Institute for Health Research, Faculty of Health Sciences, Australian Catholic University, Melbourne, Australia, 5Image Sciences Institute, University Medical Center Utrecht, Utrecht, Netherlands
Synopsis
Increasing-available ultra-strong gradient systems introduce a new challenge in MRI: the unknown interaction of time-varying magnetic fields with the human body. We characterise the physiological effects of deploying 300 mT/m gradients Siemens Connectom system when imaging regions below the neck (i.e., heart and prostate). We show gradient amplitude thresholds for PNS (ramp times < 2ms) are first reached on the Y-gradient. Moreover, landmarking on the heart gives the highest probability of generating magnetophosphenes (all gradient-axes). This study establishes: (i) limitations in greatest system performance; and (ii) that the so-far head-only Connectom system can be safely used in ‘below-the-neck’ applications.
Introduction
Recently developed whole body MRI systems with ultra-strong gradients e.g. Siemens 3T Connectom1,2 have led to exciting opportunities for tissue microstructure characterisation3-9. However, rapidly varying magnetic fields can result in peripheral nerve stimulation (PNS)10 and other effects such as magnetophosphenes (sensations of flashing or flickering lights)11, or in extreme cases, respiratory12 or cardiac muscle stimulation i.e. an ectopic heartbeat13,14. While these effects have been assessed when imaging the head, they may be amplified when scanning other body parts e.g. prostate or heart. In this work, we assess the presence of PNS and magnetophosphenes in non-head imaging positions on a 300 mT/m system, to provide safety guidelines for heart and prostate microstructural imaging with ultra-strong gradients.Methods
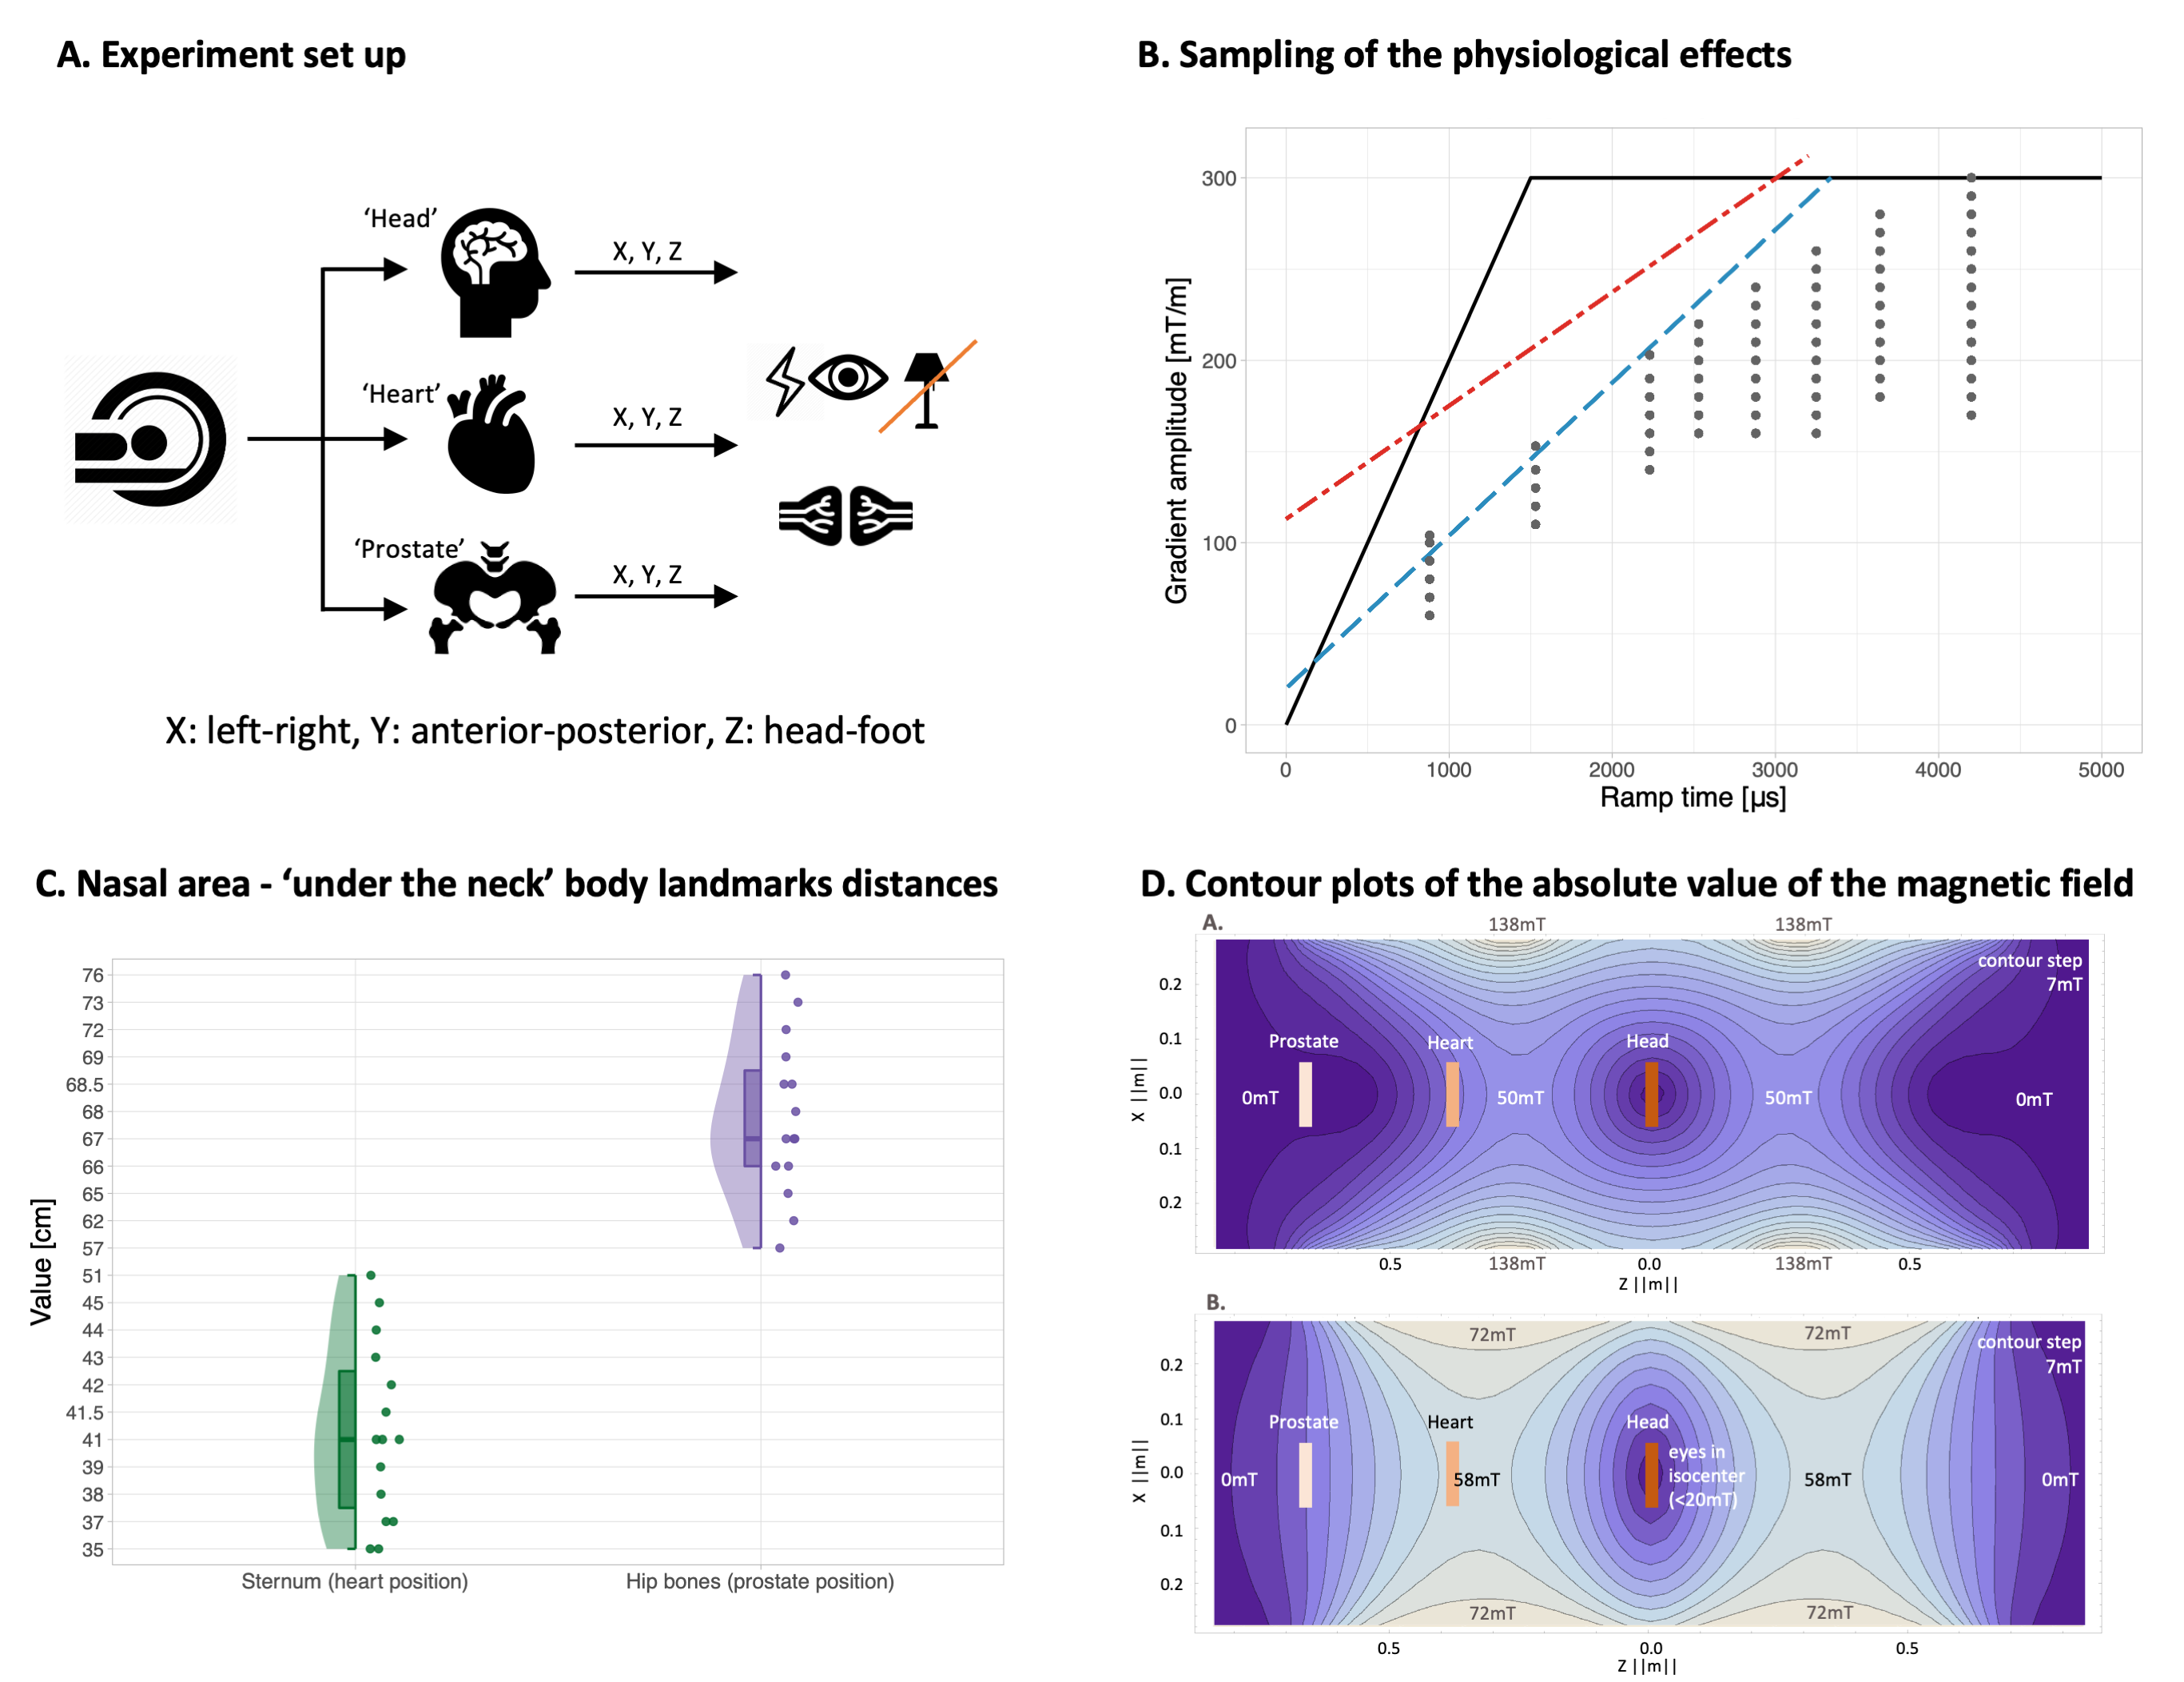
15 healthy control MR-experienced males (77.73 $$$\pm$$$ 9.59 kg, 178.6 $$$\pm$$$ 6.39 cm, 38.87 $$$\pm$$$ 7.17 yo) participated in the study. They had no disclosed medical problems and were briefed on possible effects from strong gradients. The MR experiment was performed on a Siemens research-only 3T Connectom scanner (Siemens Healthcare GmbH, Erlangen, Germany) where a localiser using the whole-body RF coil provided anatomical landmarks. Participants were placed in supine with head, heart, and prostate at isocentre (for the latter, participant was placed feet first). The participants' right arm was placed on a response box to provide feedback on possible effects experienced after each gradient stimulus. To facilitate detection of any magnetophosphenes, the room lights were switched off and any remaining light was due to monitor displays (Fig. 1A.).As in previous studies1,15, we applied continuous trains of 128 trapezoidal bipolar gradient pulses along each gradient axis (X, Y, Z) separately. A range of amplitude/ramp times, constrained by cardiac (ISO/IEC-60601-2-3) and PNS (SAFE model15) curves (Fig. 1B.), was sampled across the cohort. An estimate of the percentage (per ramp time and gradient amplitude combination) of the study population that had reported a physiological effect was established. To control for relative distances between imaging landmarks, measurements between the nasal area and the sternum and hip bones were taken (Fig. 1C.). The vendor supplied maps of the maximum absolute magnetic field for the gradient coil for estimation of the peak dB/dt during the experiment (Fig. 1D). To capture any other physiological effects, a post-scan questionnaire was completed by each participant after the experiment.
Results
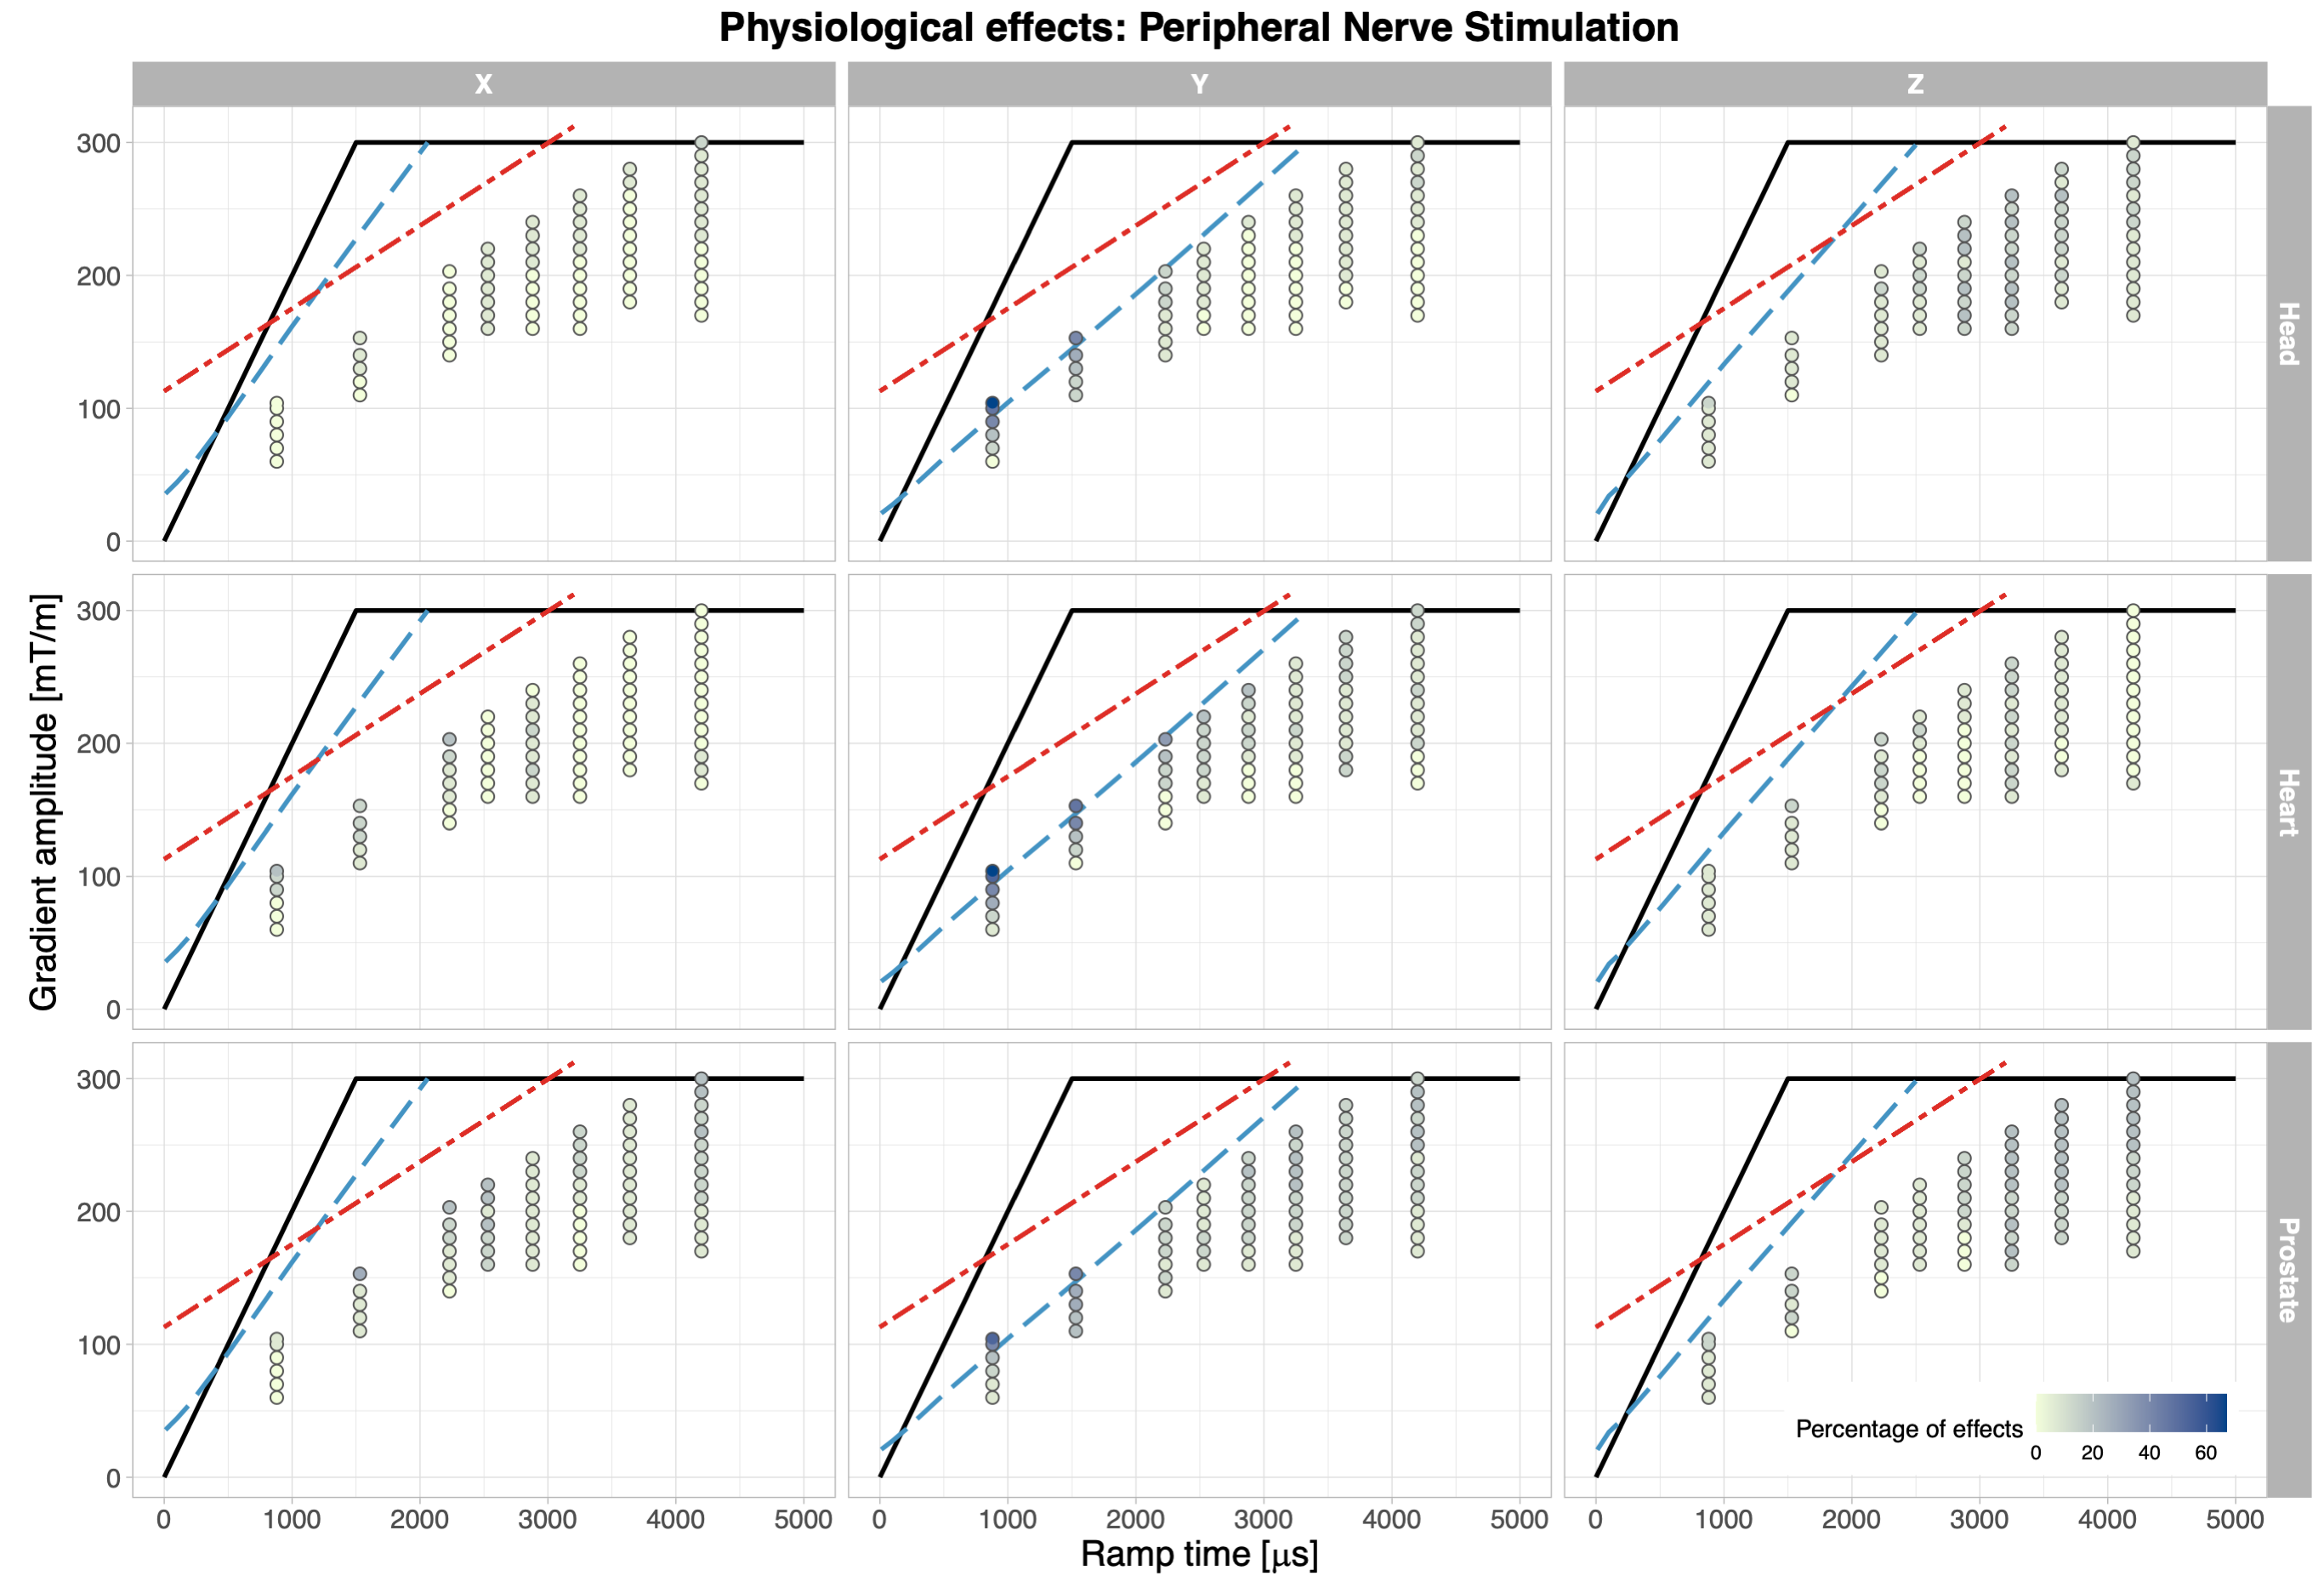
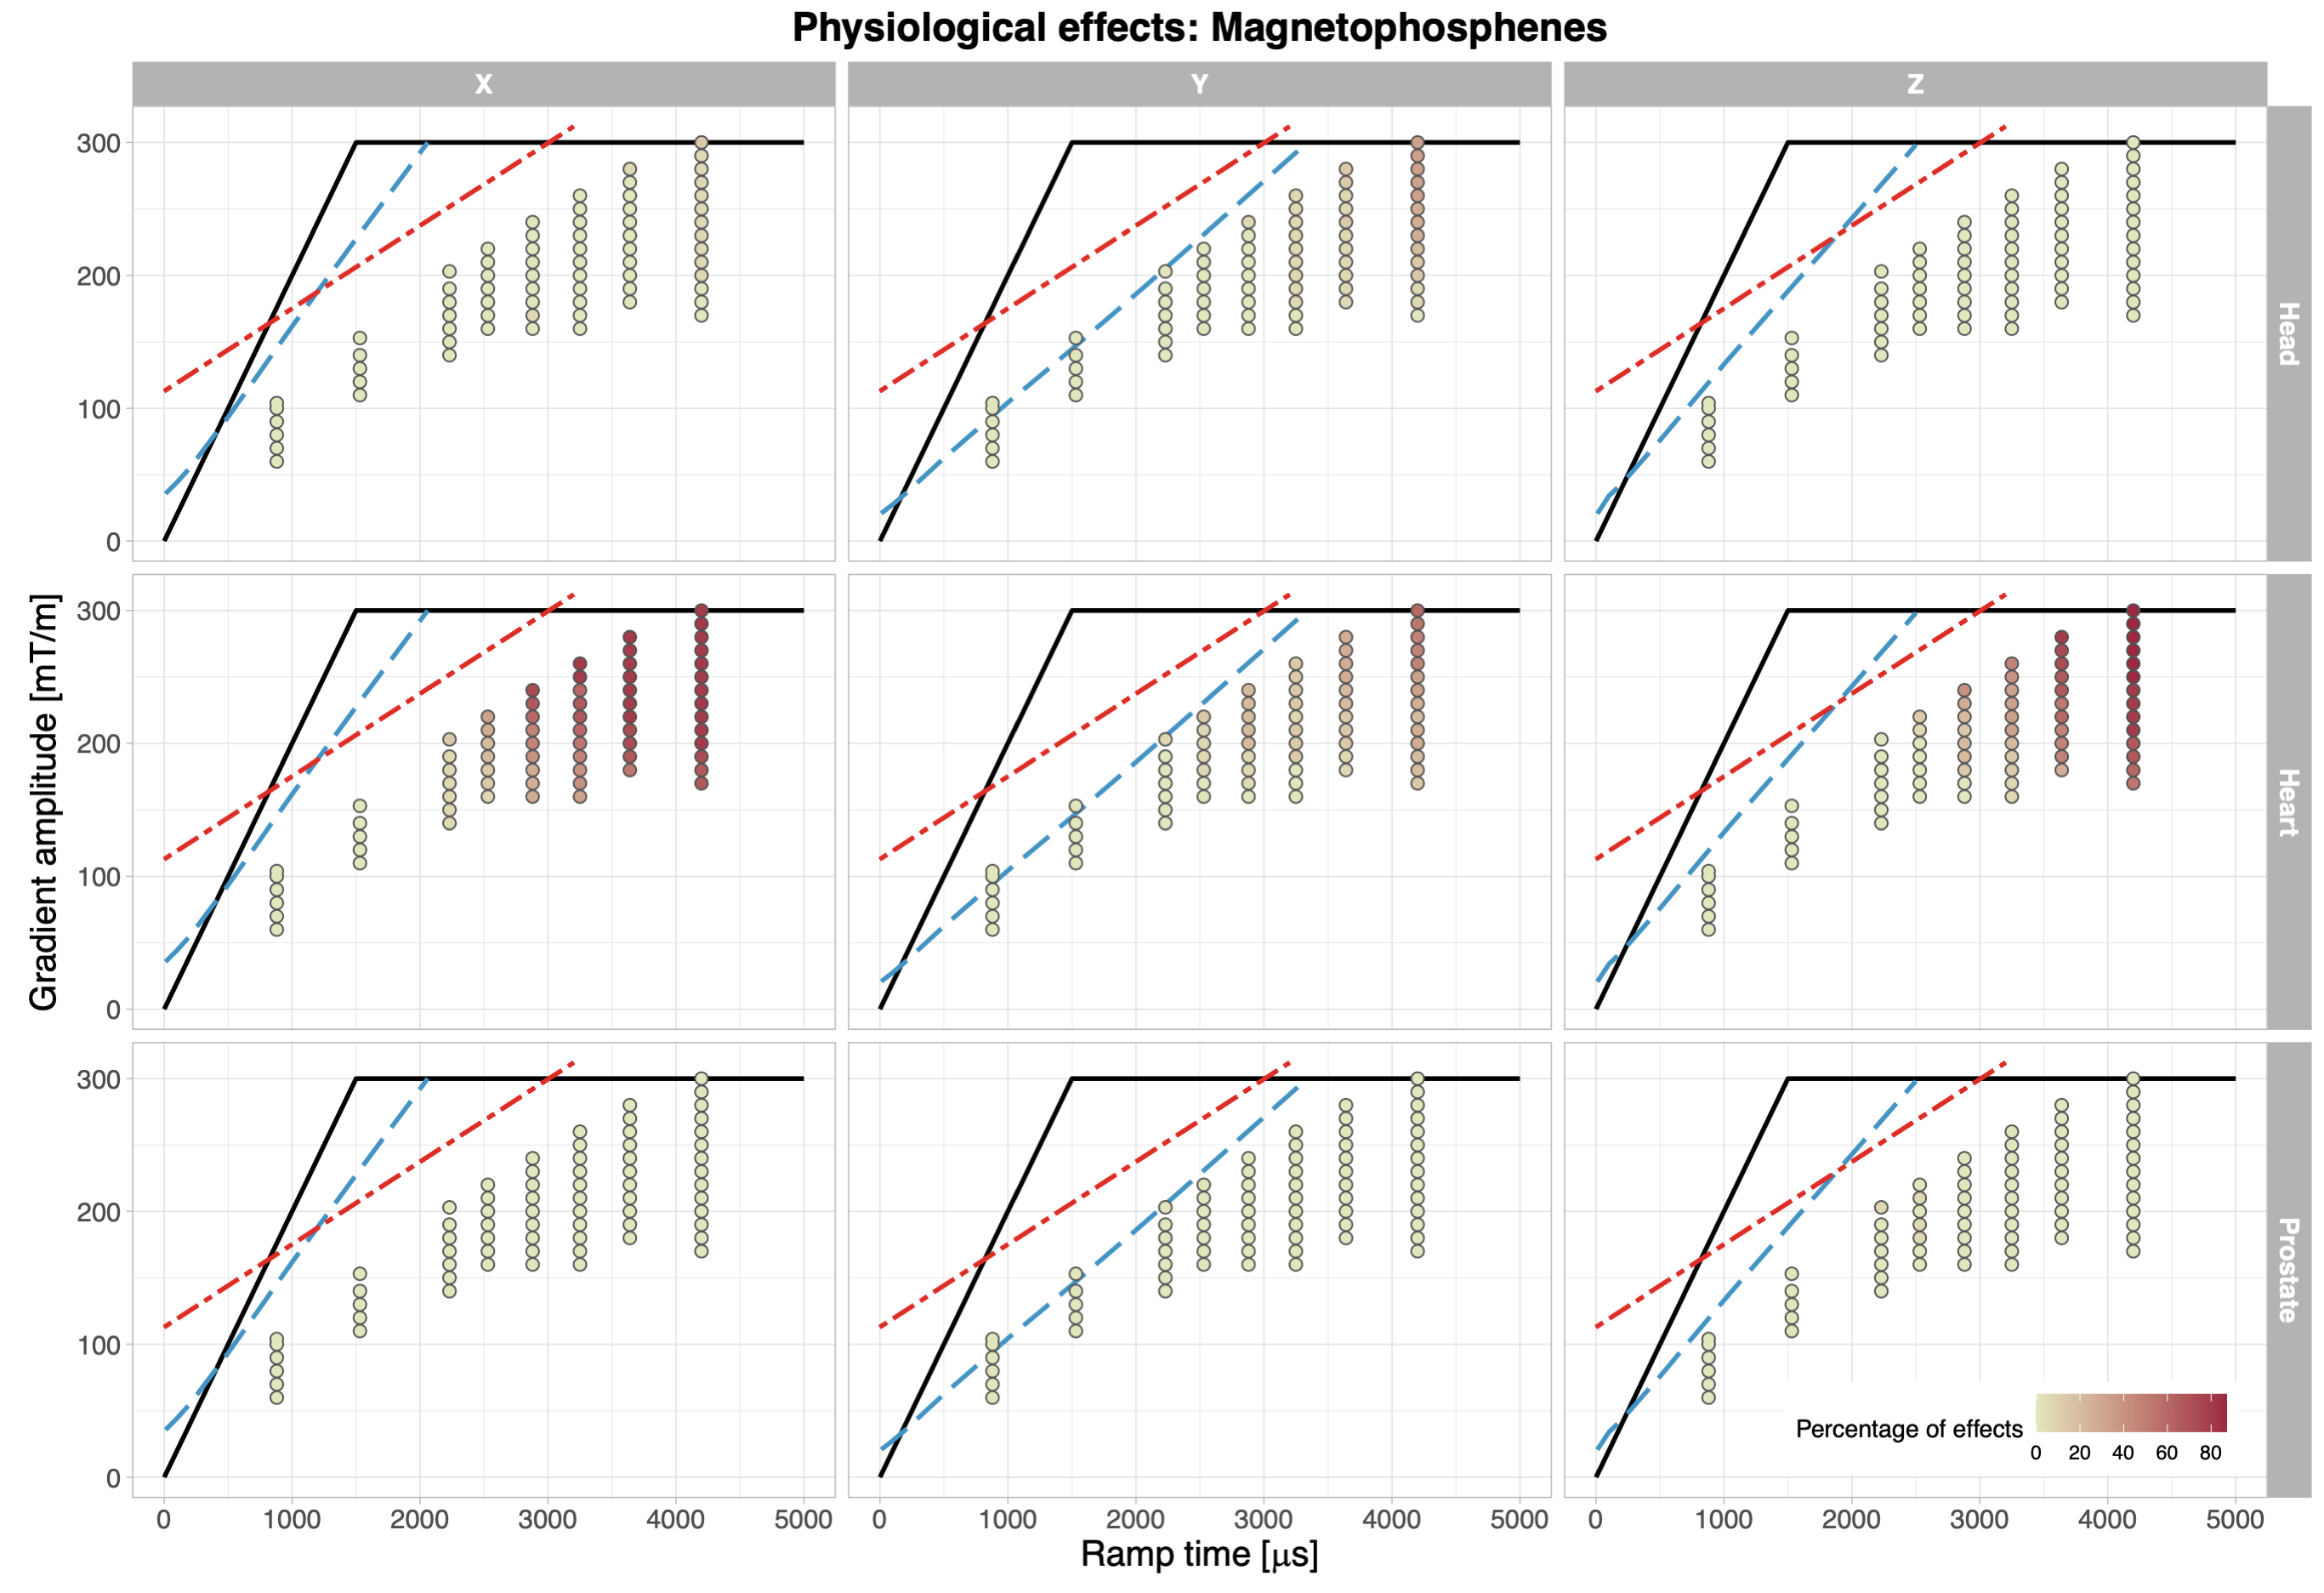
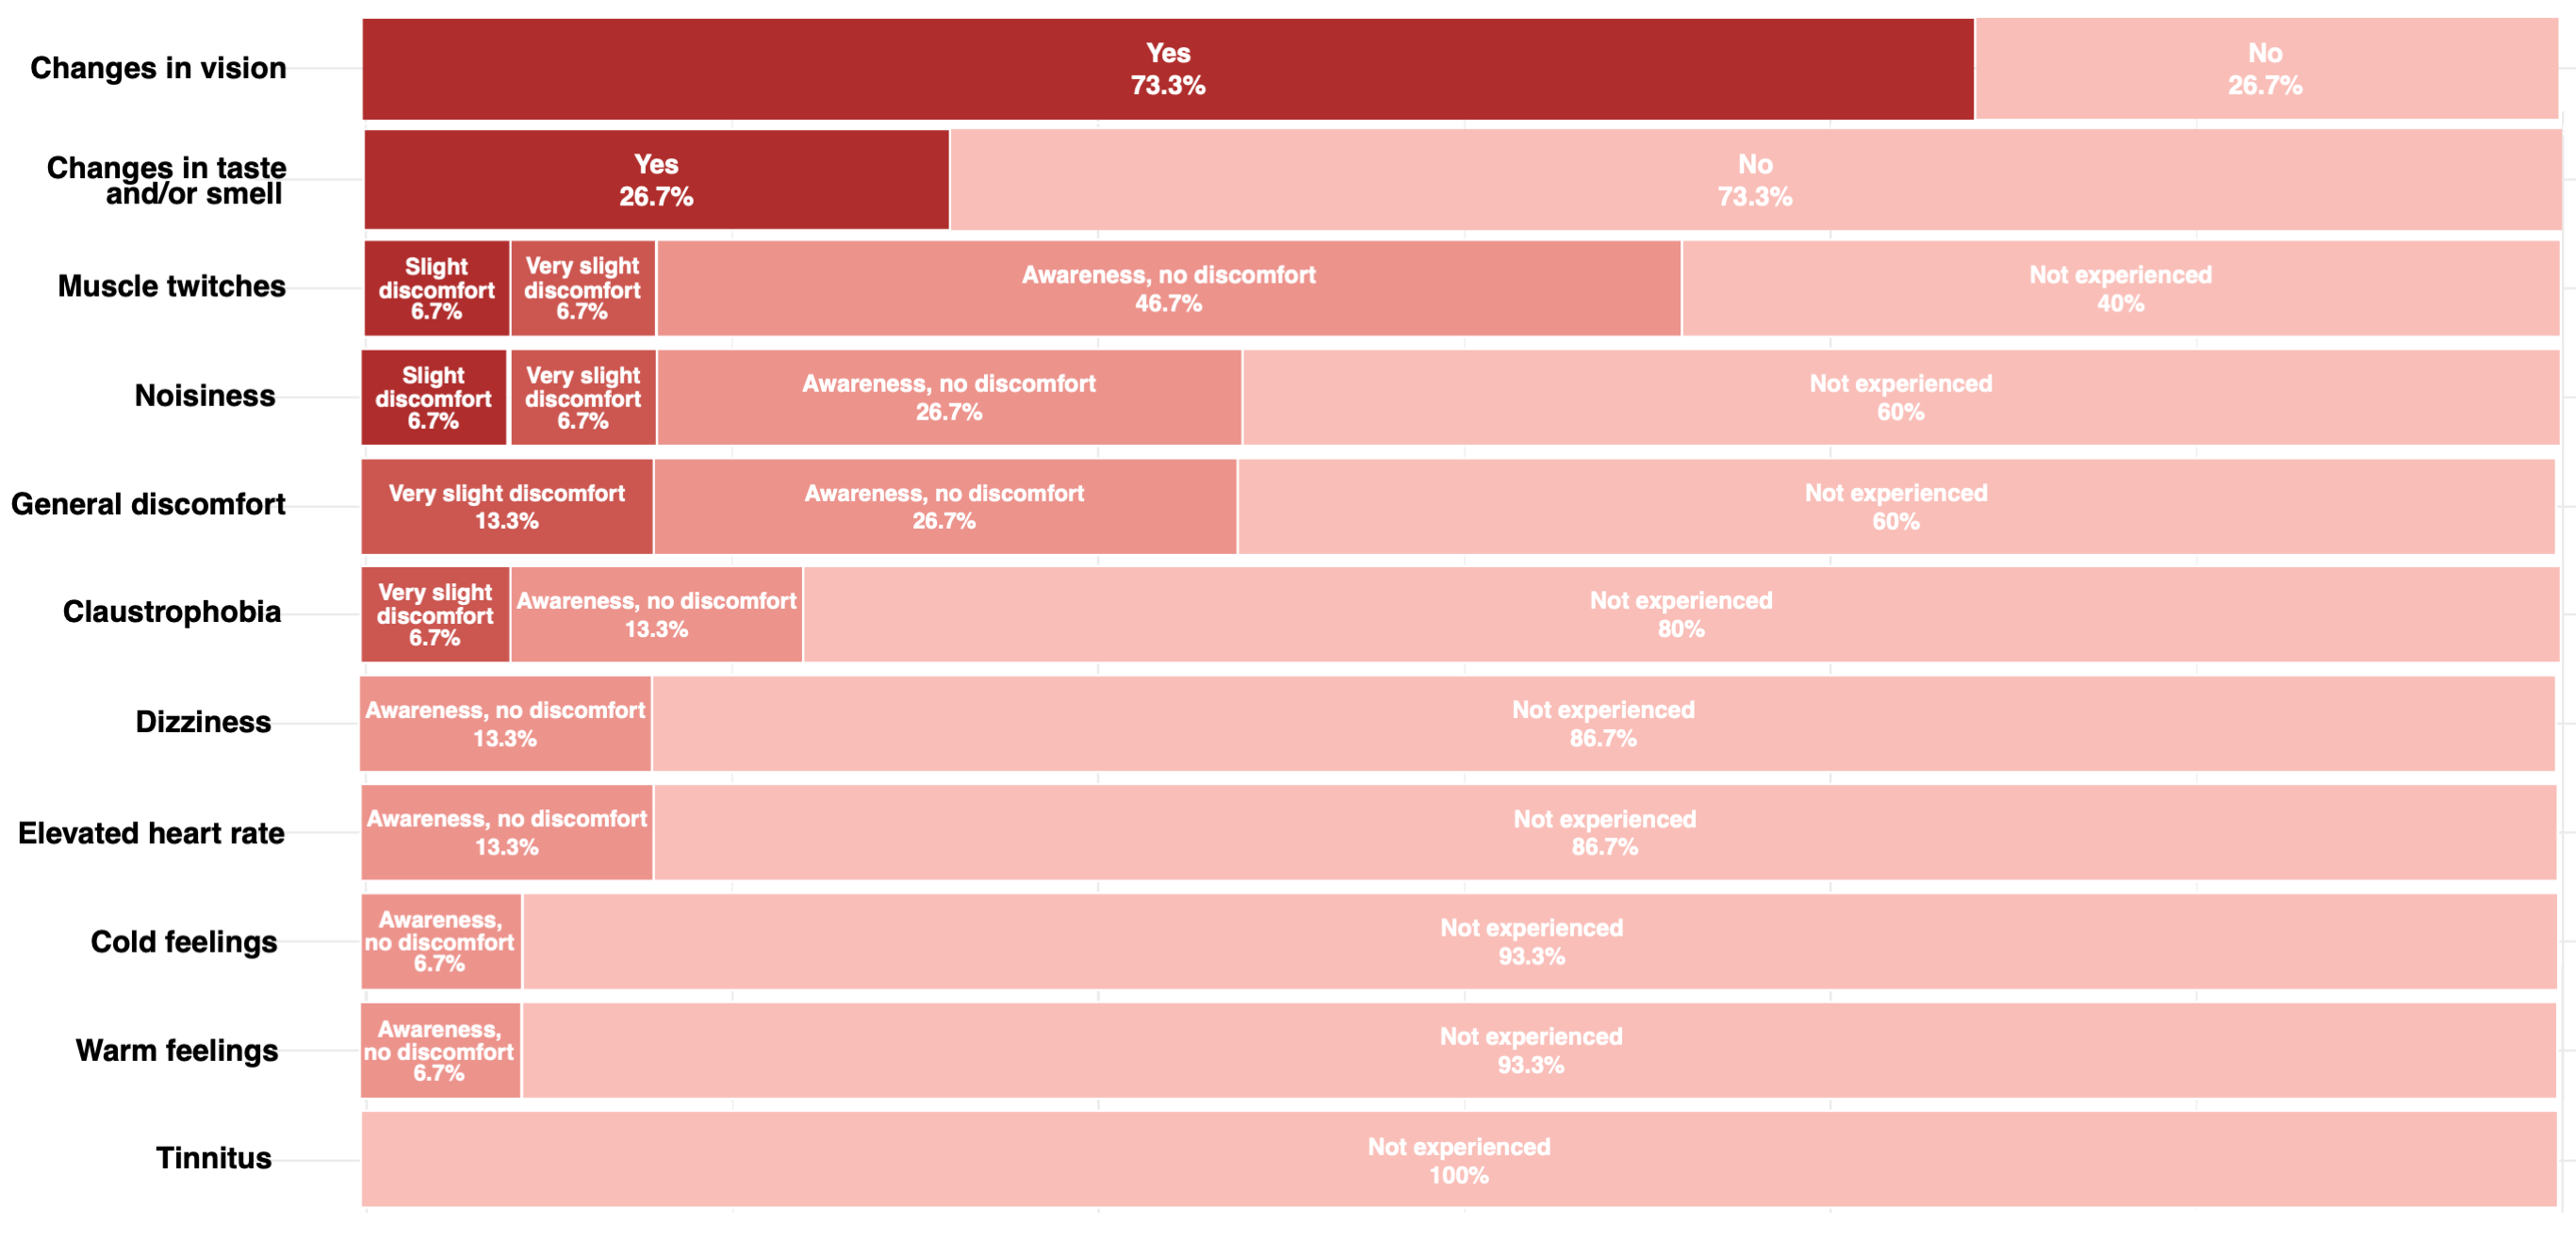
The reported PNS and visual effects are depicted in Fig.2 and Fig. 3, respectively. The highest incidence of PNS (Fig.2) occurred when the stimulus was presented on the Y-axis (66.7%) in the heart and prostate positions. The frequency of PNS reports was lower (< 20%) when applying gradient stimuli with longer ramp times (> 3ms). When the stimulus was applied on the X or Z gradient axis, PNS was less prominent: 26.7% and 20%, respectively, across all landmarks. The influence of imaging position on the PNS probability was less clear. The range of PNS locations in the body varied (e.g. shoulders, chest, abdomen, arms, fingers, feet).Visual effects (Fig.3) were more widely reported when the gradient amplitude was above ~150mT/m, where the gradient ramp times are necessarily longer. When the gradient stimulus ramp times were > 3ms, visual effects were reported by at up to 86.7% of the participants (heart landmark); for ramp times < 3ms, the effect was reported to a smaller extent. For the heart landmark, at least 60% of the study participants reported perceivable changes in vision during the experiment for all axes. In the other positions, there were fewer occurrences of the visual effects e.g. in the prostate position 6.7% in Z-axis only. In the head position these were: 33.3% for the Y-axis at longer ramp times, 13.3% for the X-axis, and not reported for the Z-axis. According to the post-scan questionnaire responses (Fig.4), the most commonly reported effects were ‘changes in vision’ and ‘muscle twitches’.
Discussion
Previous studies reported the detection of phosphenes in participants upon gradient switching in a similar system1 and from a head-only gradient coil16. The magnetophosphene-probability measured here is consistent with earlier work17, showing a reduction in the phosphene threshold with a reduction in the switching frequency (longer ramp time). This effect was observed for all axes where magnetophosphenes were detectable.The estimated maximum absolute magnetic fields at the location of the eyes for 300 mT/m would be ~20mT, ~50mT and ~20mT for the head, heart, and prostate positions, respectively (Fig. 1D.). The reported magnetophosphene occurrences are consistent with this - the stimulation threshold is lower for the heart position than head or prostate position. No participants suffered discomfort due to the experience of magnetophosphenes, and they are not believed to be associated with any long-term health effects18.
Results of PNS occurrences presented here are in line with previous findings20,21, namely that thresholds are lower along the Y-axis, most likely due to the larger cross-sectional area normal to the gradient direction. Possibly some PNS reports were actually sensations of gradient coil vibrations.
Conclusions
This study established the safety limits for the first ever operation of the 300 mT/m whole body system for body parts below the neck, and paves the way for unprecedented microstructural characterisation of heart and prostate tissue.Acknowledgements
CMWT is supported by a Sir Henry Wellcome Fellowship (215944/Z/19/Z) and a Veni grant (17331) from the Dutch Research Council (NWO). This work was supported by a Wellcome Trust Investigator Award (096646/Z/11/Z), a Wellcome Trust Strategic Award (104943/Z/14/Z), and an EPSRC equipment grant (EP/M029778/1) to DKJ. MM is supported by Siemens Healthcare Limited grant. We are grateful to Siemens Healthineers and FF, RK, as well as UR, SK and CJE for the support.
References
1. Setsompop, Kawin, et al. "Pushing the limits of in vivo diffusion MRI for the Human Connectome Project." Neuroimage 80 (2013): 220-233.
2. Kimmlingen, Ralph. "Pioneers of connectome gradients." Magnetom FLASH 68.2 (2017): 122-136.
3. Jones, Derek K., et al. "Microstructural imaging of the human brain with a ‘super-scanner’: 10 key advantages of ultra-strong gradients for diffusion MRI." NeuroImage 182 (2018): 8-38.
4. Veraart, Jelle, Els Fieremans, and Dmitry S. Novikov. "On the scaling behavior of water diffusion in human brain white matter." NeuroImage 185 (2019): 379-387.
5. Alexander, D. C., and D. K. Jones. "Limits on measuring axon diameters in vivo using diffusion MRI." Proc. Intl. Soc. Mag. Reson. Med. Vol. 15. 2007.
6. Nilsson, Markus, et al. "Resolution limit of cylinder diameter estimation by diffusion MRI: The impact of gradient waveform and orientation dispersion." NMR in Biomedicine 30.7 (2017): e3711.
7. Wedeen, V., and G. Dai. "Diffusion-limited diffusion MRI and a universal optimum b-value." Proc Intl Soc Mag Reson Med. Vol. 19. 2011.
8. Tax, Chantal MW, et al. "The dot-compartment revealed? Diffusion MRI with ultra-strong gradients and spherical tensor encoding in the living human brain." NeuroImage 210 (2020): 116534.
9. Kleban, Elena, et al. "Strong diffusion gradients allow the separation of intra-and extra-axonal gradient-echo signals in the human brain." NeuroImage (2020): 116793.
10. Reilly, J. Patrick. "Peripheral nerve stimulation by induced electric currents: exposure to time-varying magnetic fields." Medical and Biological Engineering and Computing 27.2 (1989): 101.
11. Brindley, G. S. "The site of electrical excitation of the human eye." The Journal of physiology 127.1 (1955): 189.
12. Bourland, J. D., et al. "Physiologic indicators of high MRI gradient-induced fields." Society Mag. Res. Medicine, Proceedings of the 10th Annual Meeting. San Francisco: Soc Mag Res in Medicine. Vol. 1276. 1991.
13. Irwin, D., et al. "Stimulation of cardiac muscle by a time-varying magnetic field." IEEE Transactions on Magnetics 6.2 (1970): 321-322.
14. Reilly, J. P. "Peripheral nerve stimulation and cardiac excitation by time-varying magnetic fields: a comparison of thresholds." Report MT90-100 for The Office of Science and Technology, Center for Devices and Radiological Health, U. S Food and Drug Administration (Apr. 1990) (1990).
15. Hebrank, Franz X., and Matthias Gebhardt. "SAFE model—a new method for predicting peripheral nerve stimulation in MRI." Proc Intl Soc Mag Res Med. Vol. 8. 2000.
16. McCurdy, Colin M., et al. "Magneto-phosphenes in head-only gradient coils" Proceedings of the 29th Annual Meeting. Paris: Soc Mag Res in Medicine. Vol. 1276. 1991.
17. Lövsund, P., et al. "Magnetophosphenes: a quantitative analysis of thresholds." Medical and Biological Engineering and Computing 18.3 (1980): 326-334.
18. International Commission on Non-Ionizing Radiation Protection. "Guidelines for limiting exposure to electric fields induced by movement of the human body in a static magnetic field and by time-varying magnetic fields below 1 Hz." Health physics 106.3 (2014): 418-425.
19. Schutter, Dennis JLG, and Ruud Hortensius. "Retinal origin of phosphenes to transcranial alternating current stimulation." Clinical Neurophysiology 121.7 (2010): 1080-1084.
20. Schaefer, D. J., Bourland, J. D., & Nyenhuis, J. A. (2000). Review of patient safety in time‐varying gradient fields. Journal of magnetic resonance imaging, 12(1), 20-29.
21. Ham, C. L. G., et al. "Peripheral nerve stimulation during MRI: effects of high gradient amplitudes and switching rates." Journal of Magnetic Resonance Imaging 7.5 (1997): 933-937.
Figures