0406
A time-efficient OGSE sequence with spiral readout for an improved depiction of diffusion dispersion1Institute for Biomedical Engineering, ETH Zurich and University of Zurich, Zurich, Switzerland
Synopsis
Oscillating gradient spin-echo (OGSE) sequences typically suffer low diffusion sensitization and long echo times, thereby compromising the diffusion-to-noise ratio (DNR). To address these issues, recently proposed OGSE shapes providing increased diffusion sensitization were combined with single-shot spiral readout trajectories using a high-performance gradient system. This implementation was used to study the frequency dependence of diffusivity in the in-vivo human brain for OGSE frequencies up to 125 Hz and b-values up to 1000 s/mm2, yielding an improved depiction of diffusion dispersion. The results indicate the significance of higher b-values in characterizing this relationship.
Introduction
Oscillating gradient spin-echo (OGSE) sequences offer additional insight into tissue microstructural properties compared to their pulsed gradient counterparts but are limited by relatively low diffusion sensitization. Recent works have overcome this sensitivity disadvantage by implementing OGSE with high-performance gradient systems,1,2 but diffusion information remains susceptible to noise due to the lengthy echo time (TE) required (typically, 115 ms or more) to achieve both adequate diffusion sensitization and high OGSE frequencies.Spiral readouts can reduce TE with respect to EPI readouts (the latter have exclusively been used in OGSE studies to date) owing to the center-out design of the former; as such, spirals provide a substantial signal-to-noise ratio (SNR) benefit.3 However, spirals are more sensitive to static B0 inhomogeneities and gradient imperfections, which is likely why spirals are rarely used in practice4 and have not yet been used in OGSE acquisitions. In this work, spiral readouts were utilized in OGSE imaging of the in-vivo human brain for the first time, in an implementation that utilized a high-performance gradient insert5 and a recently developed diffusion sensitization scheme,2 which was shown to improve sensitivity and specificity in OGSE measurements. This methodology was used to investigate the frequency dependence of diffusivity and the impact of flow compensation in OGSE waveforms for frequencies up to 125 Hz and b-values up to 1000 s/mm2.
Methods
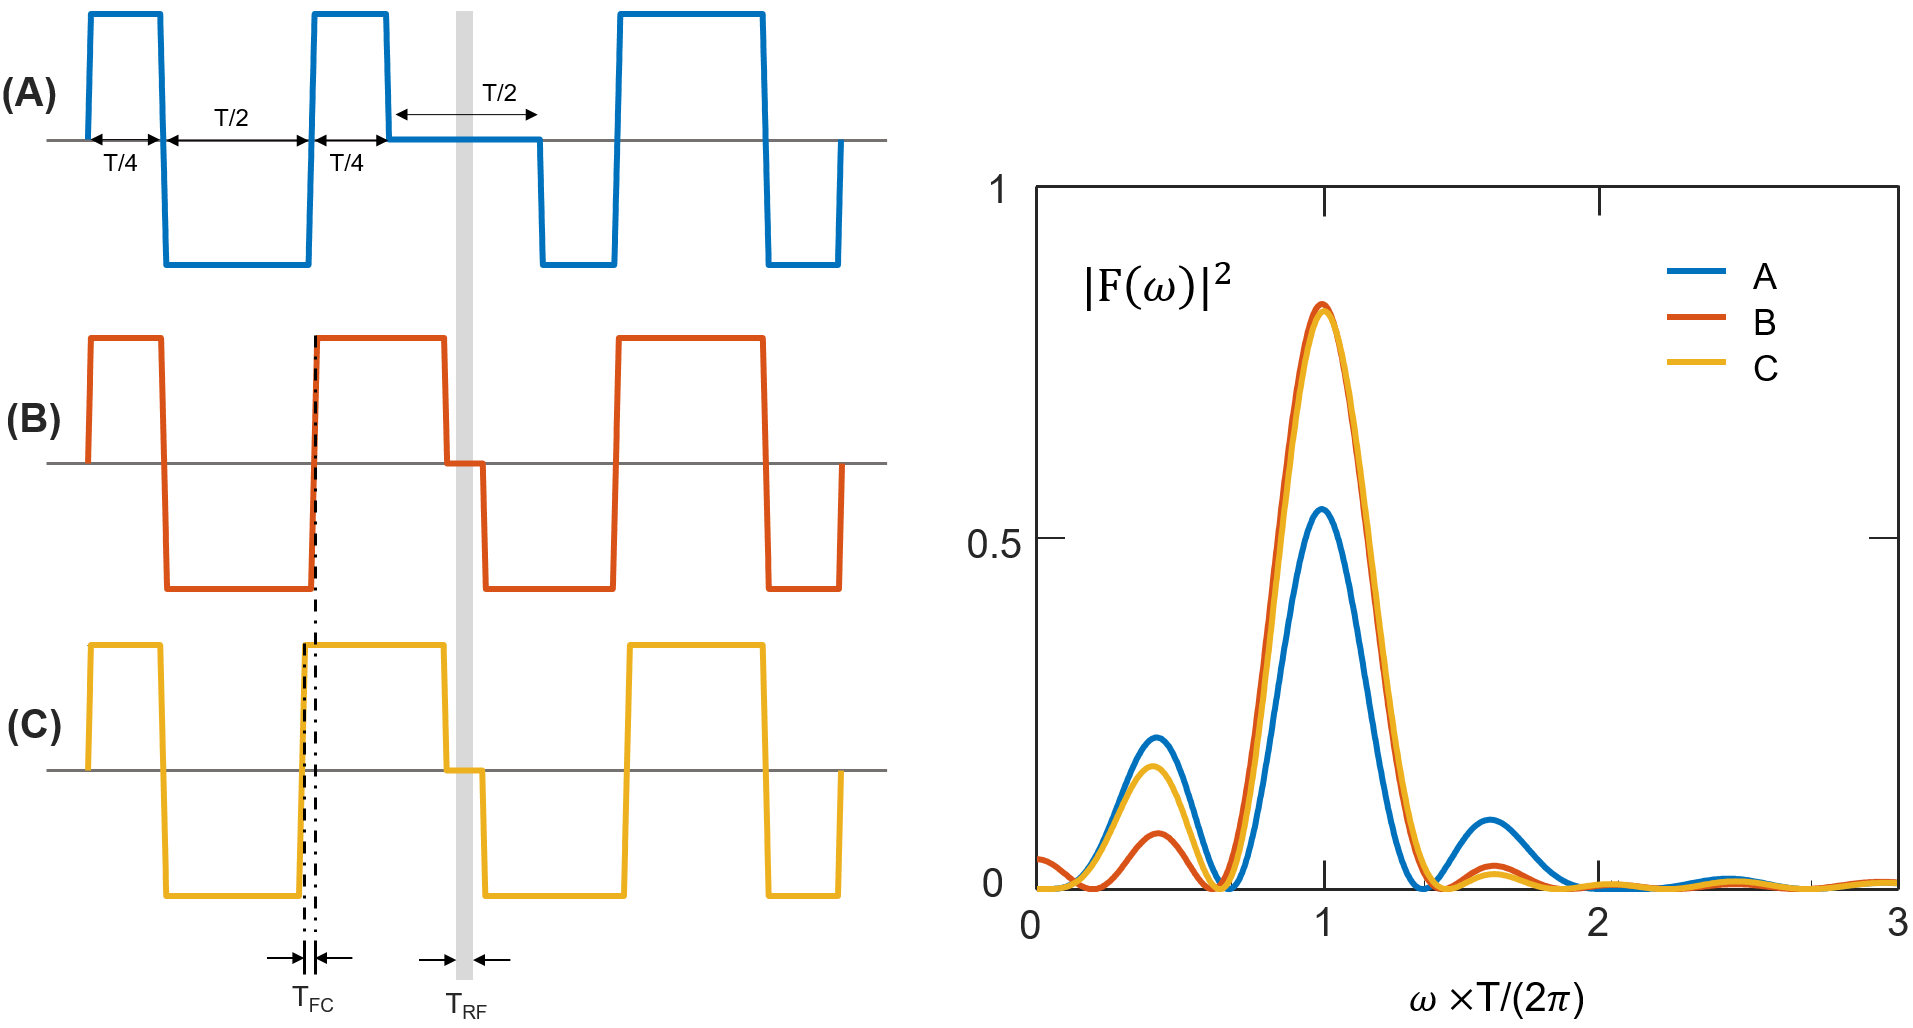
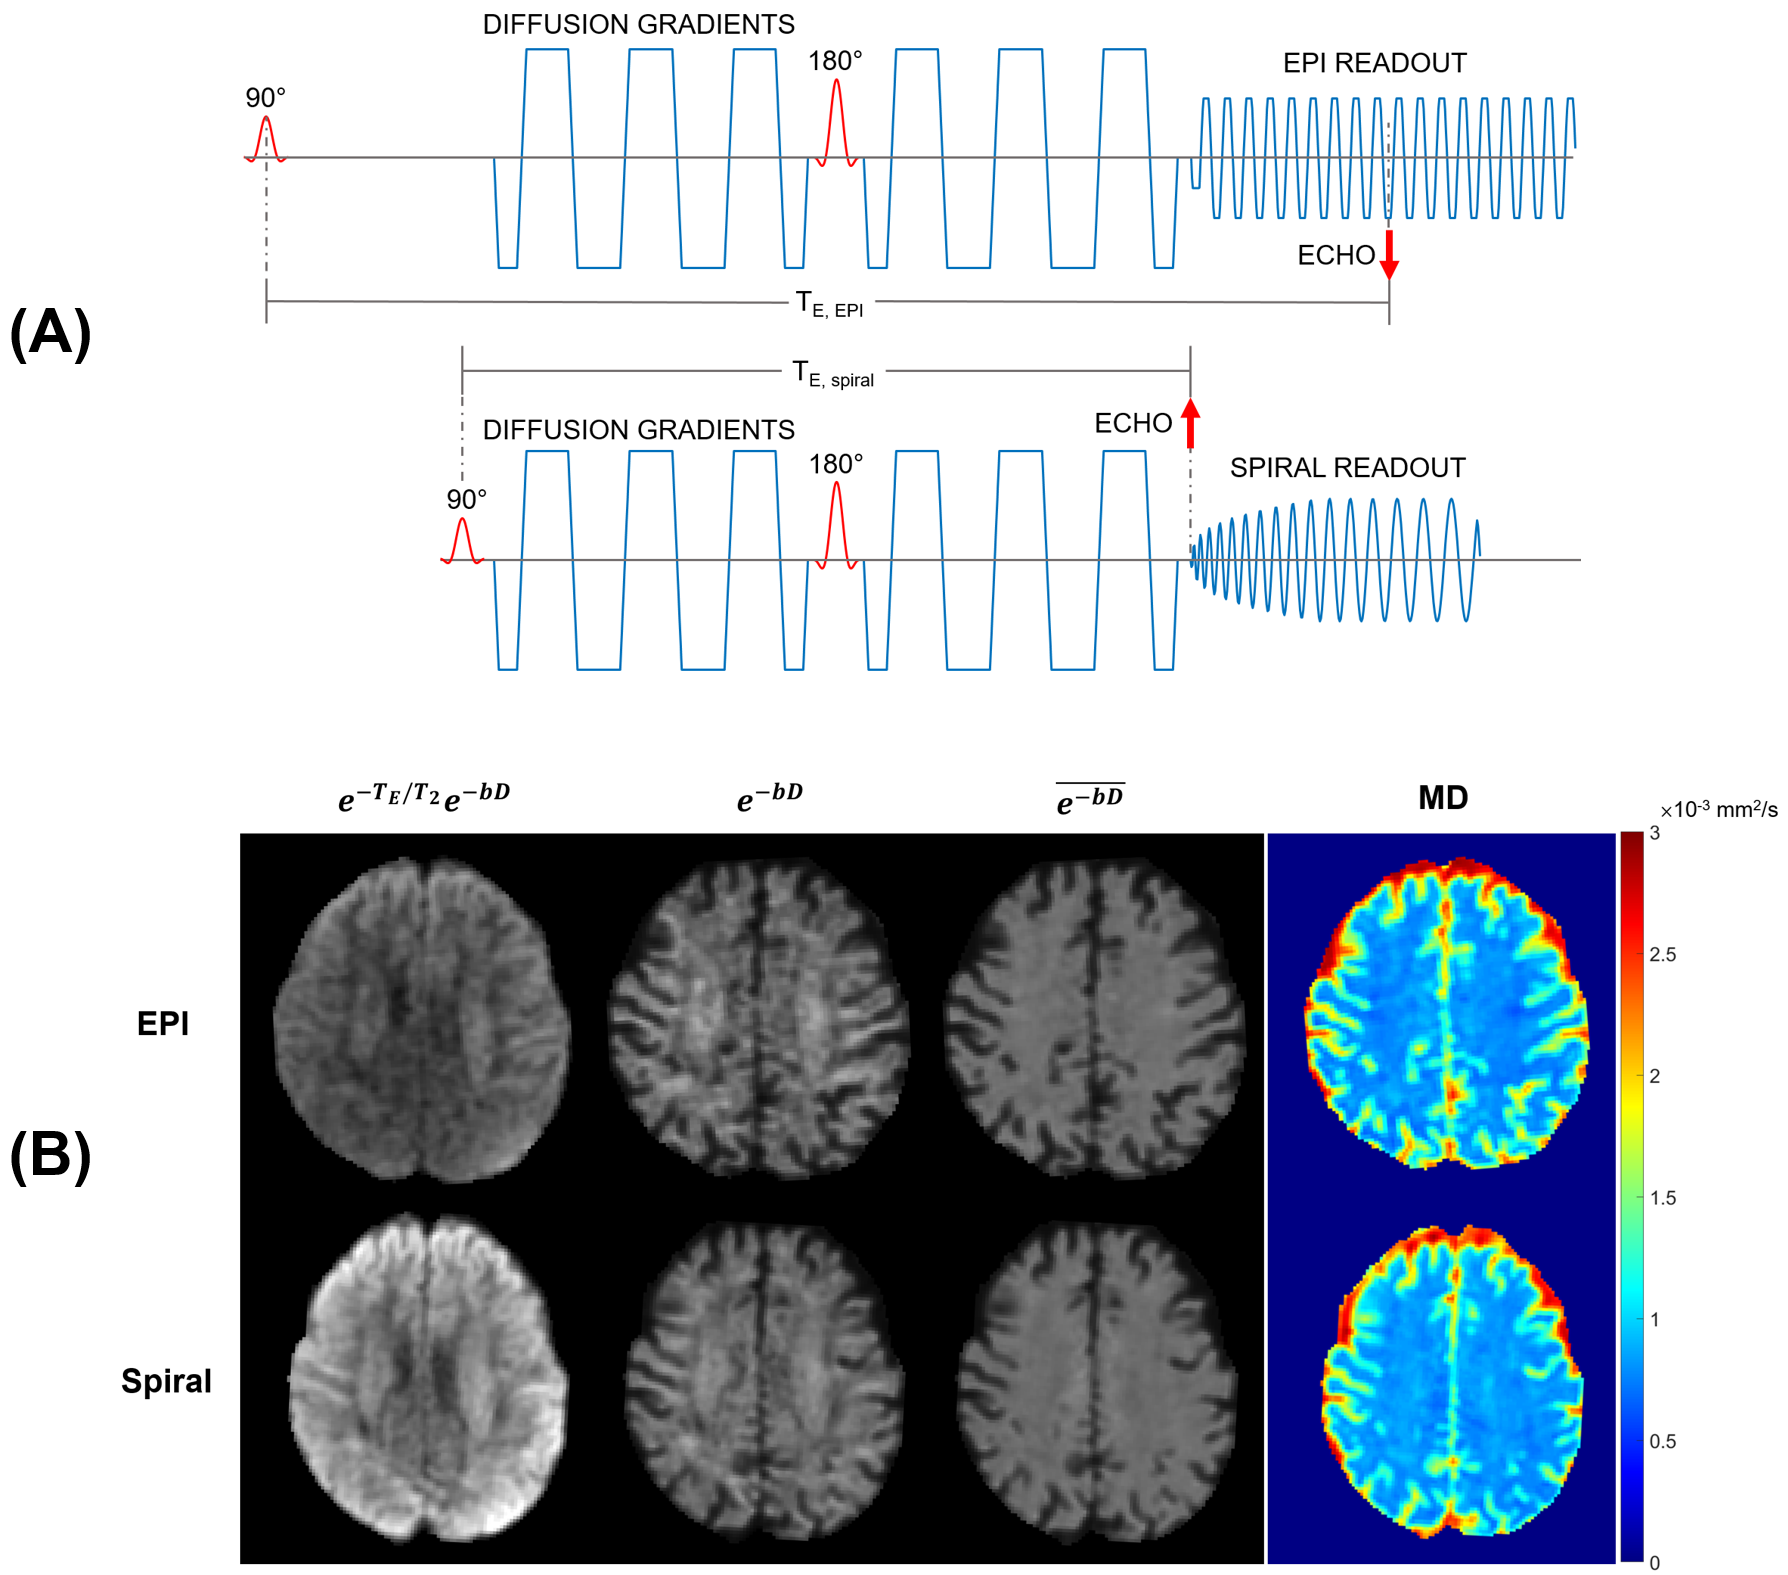
Experiments were performed with a 3T Philips Achieva system (Philips Healthcare, Best, the Netherlands) equipped with the abovementioned high-performance gradient insert. Two healthy volunteers and a bottle-shaped phantom were scanned with PGSE DTI and OGSE DTI sequences with spiral readouts at b-values of 300, 500, and 1000 s/mm2 and frequencies up to 125, 100, and 75 Hz, respectively (10 slices, 3 mm slice thickness, 2 mm gap, 2 mm in-plane resolution, TR/TE = 5600/95 ms, five b = 0 acquisitions, 16 DTI directions at b > 0). OGSE scans were performed with improved oscillating gradient waveforms providing increased diffusion sensitivity.2 Because these waveforms introduce a residual flow sensitivity, OGSE scans were repeated for a further modification to the shapes providing flow compensation (FC) (see Figure 1). The flow-compensated 50 Hz, 1000 s/mm2 sequence was also performed using EPI readouts with the minimum achievable TE (128 ms) for an equivalent nominal resolution.Following scanning, the readout k-space trajectories of each sequence were monitored using a field camera6 (Skope Magnetic Resonance Technologies, Zurich, Switzerland). Images were reconstructed using the resulting information, as well as off-resonance maps, in a reconstruction algorithm accounting for a third-order spherical harmonic model of the spatiotemporal magnetic field dynamics.7 Reconstructed images were smoothed with a Hamming filter and co-registered, and mean diffusivity (MD) was calculated voxel-wise based on diffusion tensor fits. Scaling factors were applied to MD values to account for possible deviations between the intended and applied b-values, determined empirically based on the phantom data. Among PGSE/OGSE scans at the same b-value, diffusion dispersion maps were computed via voxel-wise fitting of the power law relationship $$$D(\omega)=\Lambda\omega^\theta+D_{\omega=0}$$$, where $$$\Lambda$$$ is the diffusion dispersion rate, $$$D(\omega)$$$ is MD at frequency $$$\omega$$$, $$$D_{\omega=0}$$$ is the 0 Hz diffusivity, and structural disorder parameter $$$\theta$$$ = 0.5 is assumed.8,9 The power law relationship was also fitted to average MD values of several white matter tracts.
Results
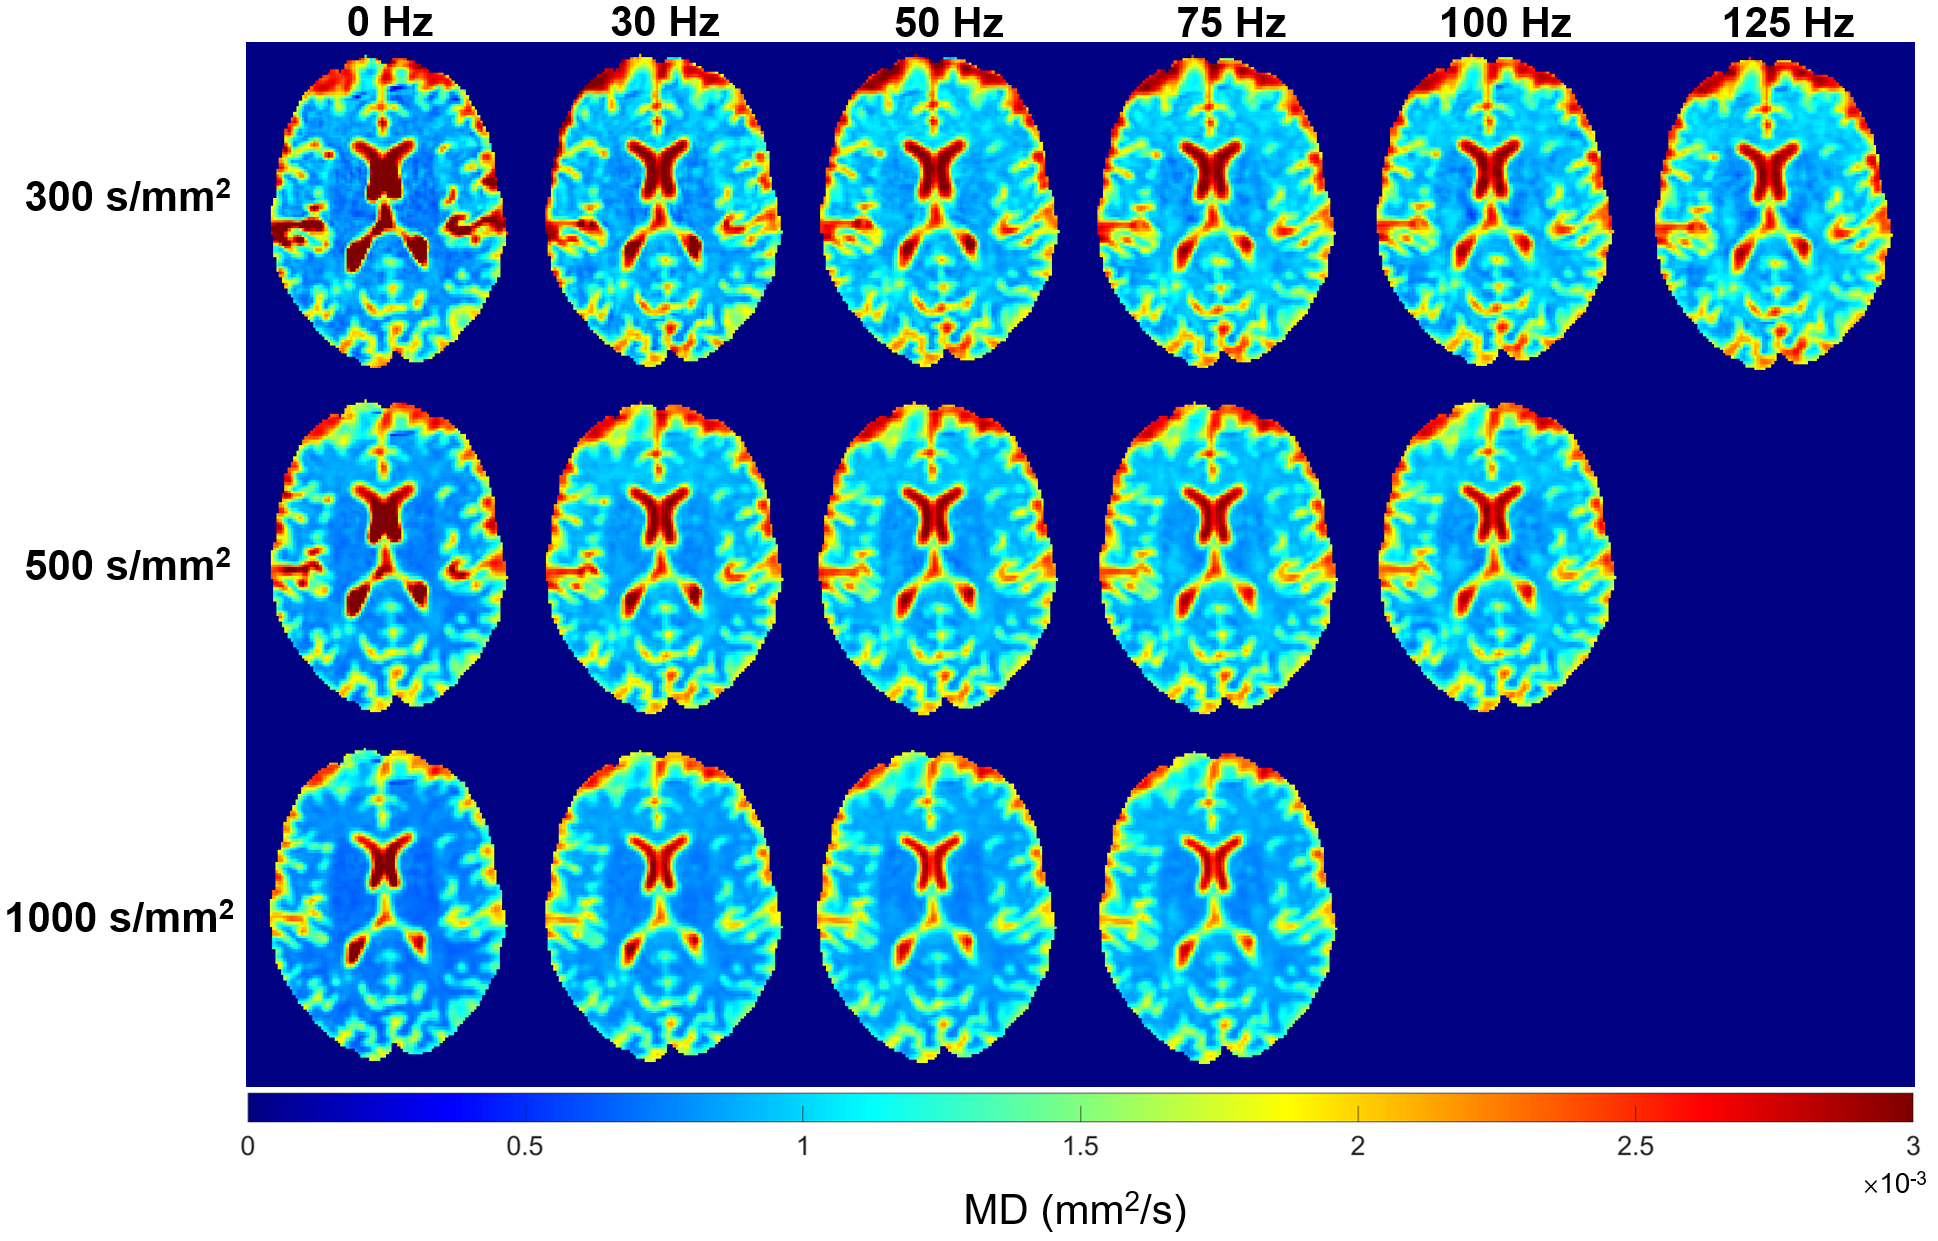
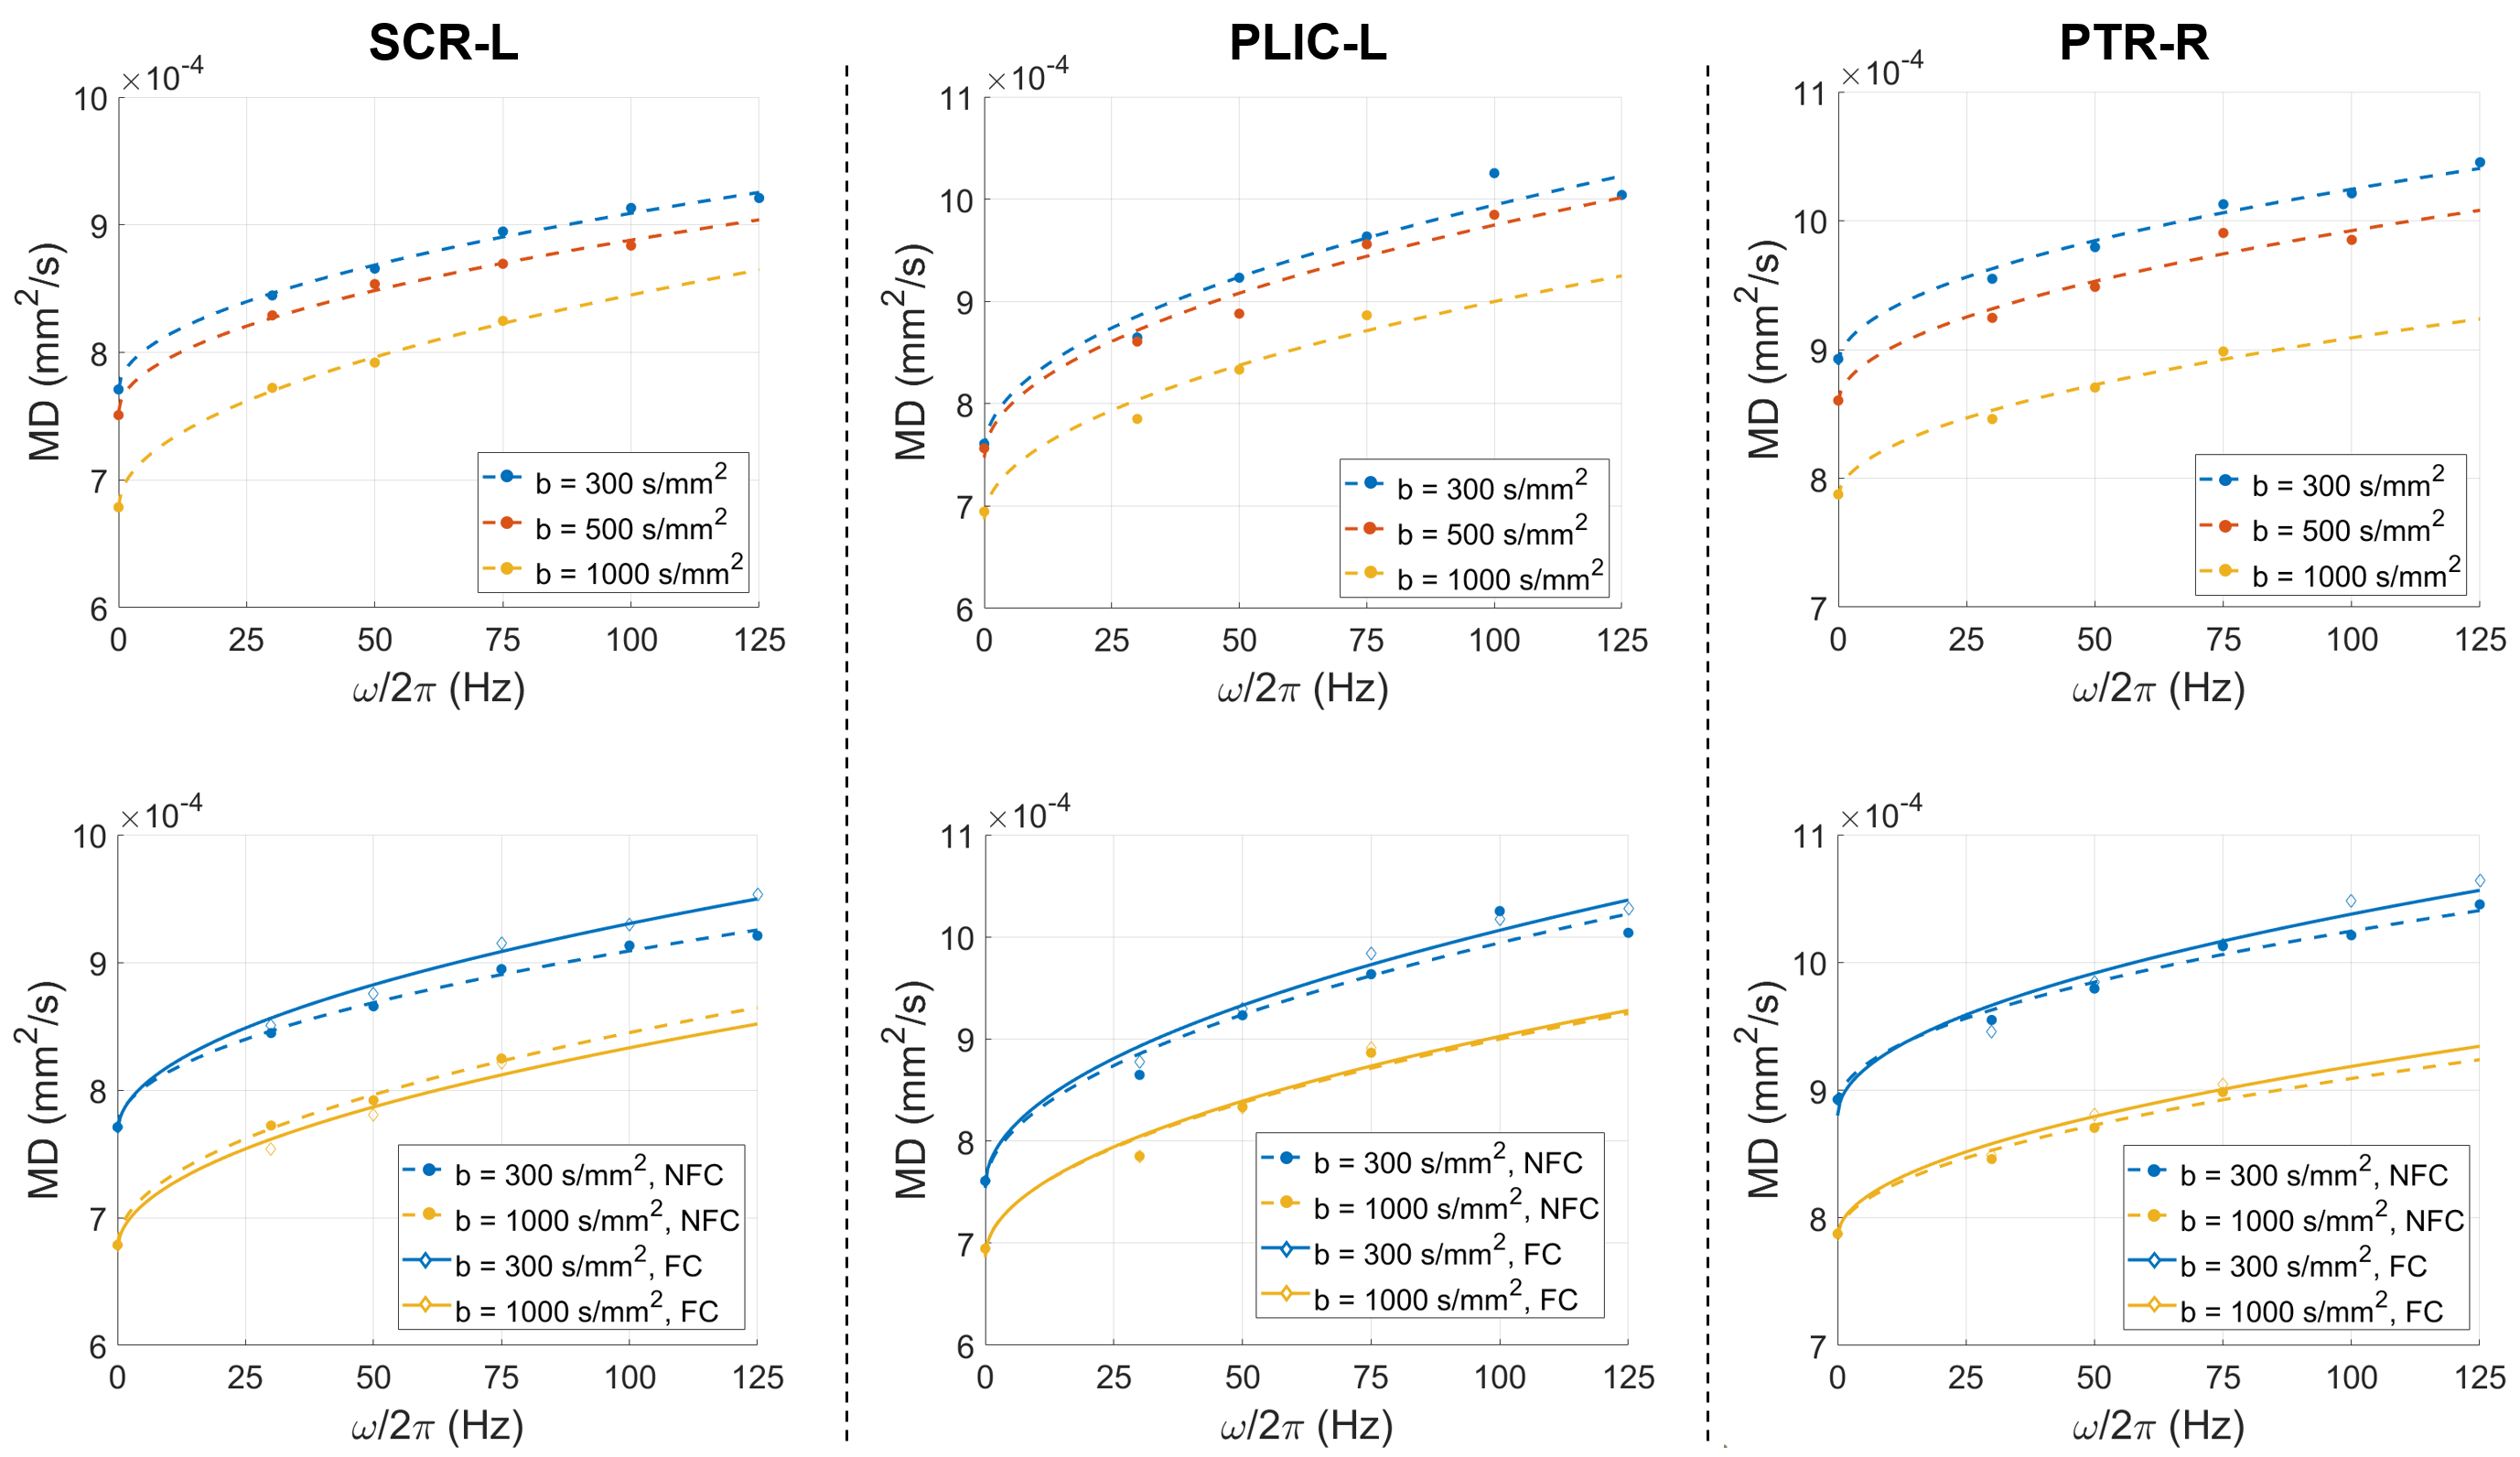
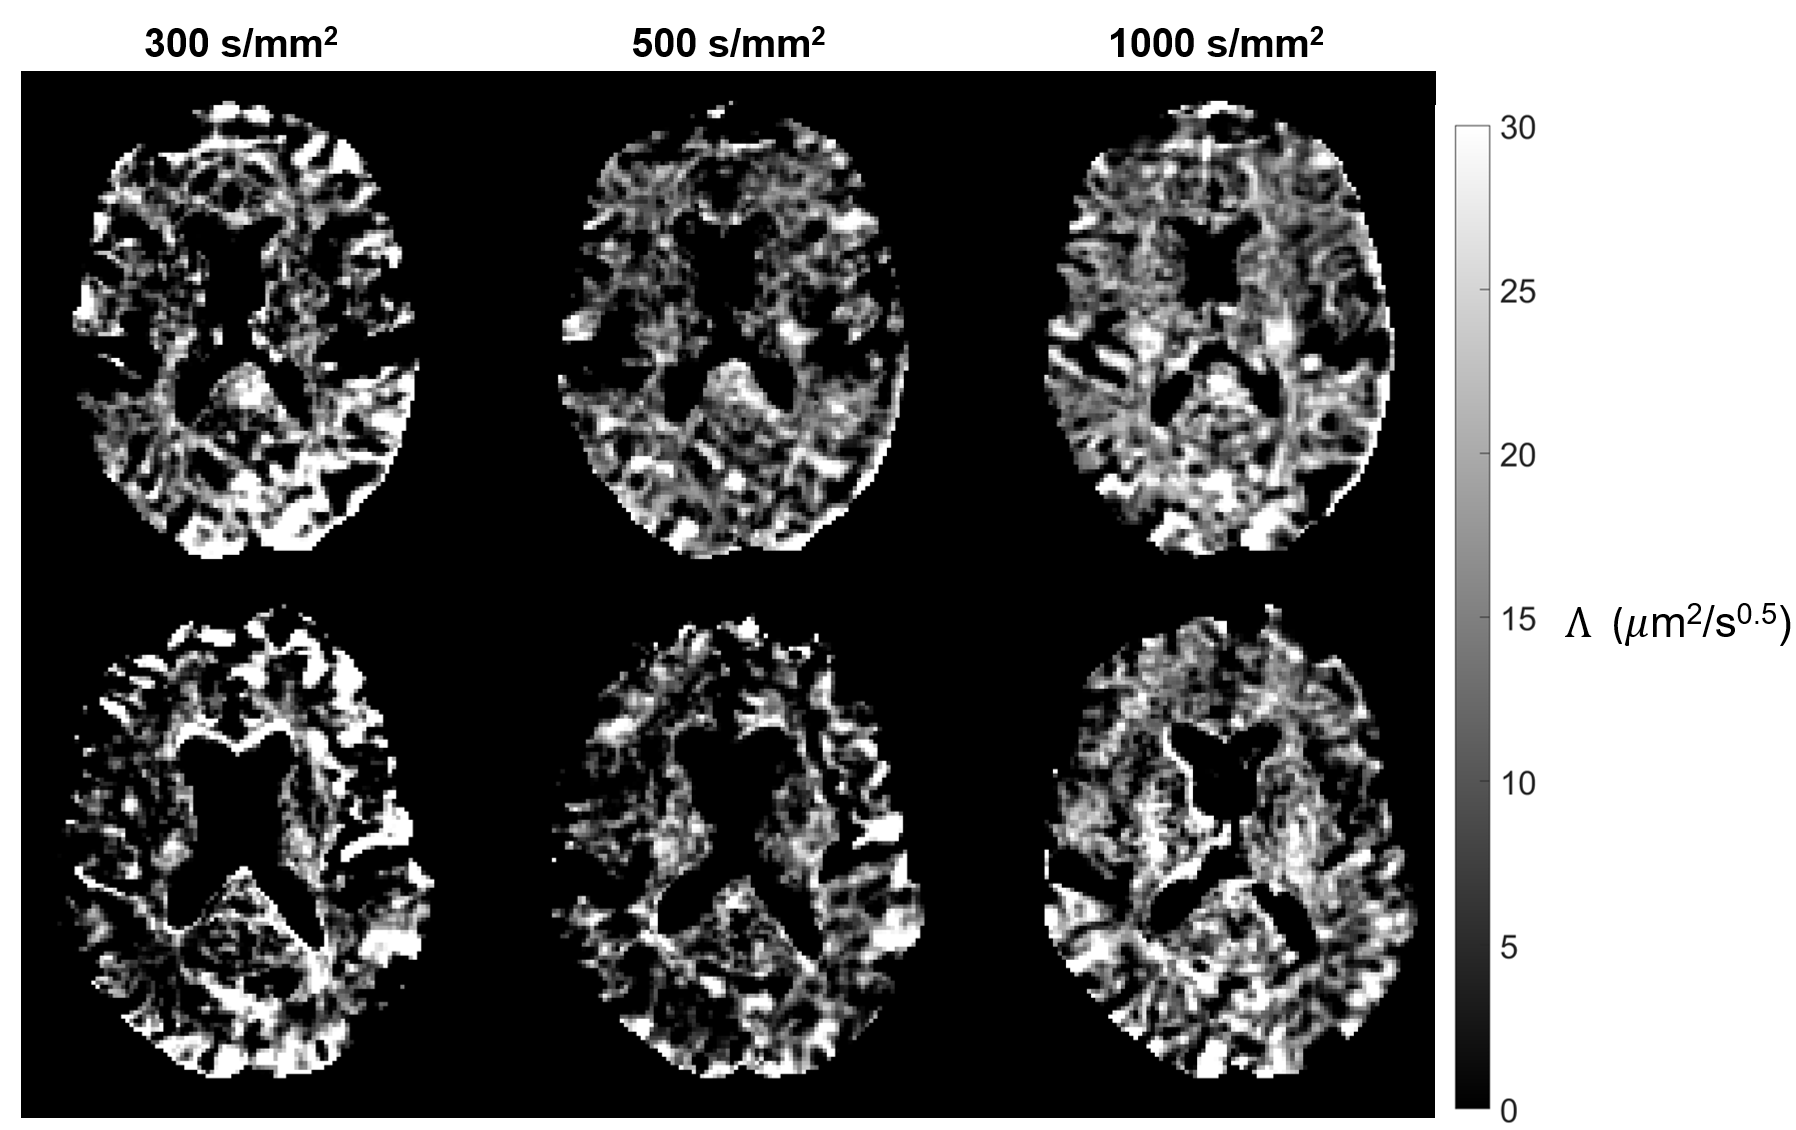
Figure 2 illustrates the TE and subsequent diffusion-to-noise ratio (DNR) advantage of spiral readouts with respect to EPI. Figure 3 depicts MD maps corresponding to OGSE acquisitions without FC; MD clearly increases with rising frequency and with decreasing b-value. Figure 4 captures these trends, fitted to the diffusion dispersion model, for select white matter regions and compares the diffusivity trends for OGSE shapes with and without FC. Figure 5 shows maps of the diffusion dispersion rate across b-values, again for OGSE sequences without FC; the clearest maps are seen for b = 1000 s/mm2.Discussion
In terms of resolving diffusion dispersion, the data indicate a clear advantage of higher b-values in the tradeoff between maximizing b-value or OGSE frequency for a given TE. The underlying MD maps at higher b-values exhibit a clear DNR advantage, thereby benefitting the stability of region-wise and, more significantly, voxel-wise fits of the diffusion dispersion model (see Figures 4-5) despite fitting to fewer sampled frequencies.Noise sensitivity aside, lower b-values are associated with an increased sensitivity to perfusion in OGSE measurements,10 an effect which appears to have manifested in the data as higher MD values at lower b-values. As such, the b = 1000 s/mm2 data likely contains contrast that best represents pure diffusion. A further reduction in perfusion bias could be expected by introducing flow-compensation.11 The data, however, offer no evidence of this effect; there is no clear relationship between the MD values of OGSE data with and without FC. These findings suggest that increasing the b-value has a more significant impact than fully eliminating the first moment for the reduction of perfusion bias in OGSE experiments.
Conclusion
The OGSE implementation employed here permitted both a TE reduction and b-value improvement, forming an altogether time-efficient sequence that boosts DNR over an expanded range of b-values and frequencies. This scheme provided an enhanced depiction of diffusion dispersion and can enable further exploration of human brain microstructure.Acknowledgements
No acknowledgement found.References
1. Tan ET, Shih RY, Mitra J, et al. Oscillating diffusion-encoding with a high gradient-amplitude and high slew-rate head-only gradient for human brain imaging. Magn Reson Med. 2020;84(2):950-965.
2. Hennel F, Michael ES, Pruessmann KP. Improved gradient waveforms for oscillating gradient spin-echo (OGSE) diffusion tensor imaging. NMR Biomed. 2020;e4434. DOI: 10.1002/nbm.4434.
3. Lee Y, Wilm BJ, Brunner DO, et al. On the signal-to-noise ratio benefit of spiral acquisition in diffusion MRI. Magn Reson Med. 2020;00:1-14. DOI: 10.1002/mrm.28554.
4. Wilm BJ, Barmet C, Gross S, et al. Single-shot spiral imaging enabled by an expanded encoding model: Demonstration in diffusion MRI. Magn Reson Med. 2017;77(1):83-91.
5. Weiger M, Overweg J, Rösler MB, et al. A high-performance gradient insert for rapid and short-T2 imaging at full duty cycle. Magn Reson Med. 2018;79(6):3256-3266.
6. Dietrich BE, Brunner DO, Wilm BJ, et al. A field camera for MR sequence monitoring and system analysis. Magn Reson Med. 2016;75(4):1831-1840.
7. Wilm BJ, Barmet C, Pavan M, Pruessmann KP. Higher order reconstruction for MRI in the presence of spatiotemporal field perturbations. Magn Reson Med. 2011;65(6):1690-1701.
8. Novikov DS, Jensen JH, Helpern JA, Fieremans E. Revealing mesoscopic structural universality with diffusion. Proc Natl Acad Sci U S A. 2014;111(14):5088-5093.
9. Arbabi A, Kai J, Khan AR, Baron CA. Diffusion dispersion imaging: Mapping oscillating gradient spin-echo frequency dependence in the human brain. Magn Reson Med. 2020;83(6):2197-2208.
10. Wu D, Zhang J. The effect of microcirculatory flow on oscillating gradient diffusion MRI and diffusion encoding with dual-frequency orthogonal gradients (DEFOG). Magn Reson Med. 2017;77(4):1583-1592.
11. Ahlgren A, Knutsson L, Wirestam R, et al. Quantification of microcirculatory parameters by joint analysis of flow-compensated and non-flow-compensated intravoxel incoherent motion (IVIM) data. NMR Biomed. 2016;29(5):640-649.
Figures