0405
Random matrix theory denoising minimizes cross-scanner,-protocol variability and maximizes repeatability of higher-order diffusion metrics1Radiology, NYU School of Medicine, New York, NY, United States
Synopsis
Translation of diffusion MRI-derived quantitative biomarkers into clinical decision making has been hampered by within-scanner and cross-scanner variability. We compare intra-scan, cross-scan, and cross-protocol variability of multi-shell diffusion MRI for three subjects and evaluated two Random Matrix Theory (RMT)-based denoising techniques to enhance repeatability. Without denoising, best scan-rescan repeatability was found for intra-scanner measurements with the highest SNR (shortest TE), RMT-based denoising greatly reduced variability across scanners and TE, resulting in coefficients of variation about 5% for all comparisons. Increased precision across scanners and protocols should increase statistical power and further enable clinical trials of quantitative higher-order diffusion MRI.
Introduction
Intra-scanner and cross-scanner variability are fundamental obstacles for translating diffusion (d)MRI-derived biomarkers into clinical studies due to coupled effects of differing protocols with scan-specific gradients and field strength1. Processing techniques that aim to reduce sources of artificial variability and isolate biological signal are essential to investigate tissue changes due to development, function, or disease. This study characterizes intra-scan, cross-scan, and cross-protocol variability, then evaluates the role of denoising based on Random Matrix Theory (RMT): Marchenko-Pastur principal component analysis (MPPCA)2 on magnitude images, and RMT reconstruction from raw data3, on the precision of estimating conventional DTI and higher-order diffusion metrics.Materials and Methods
After informed consent, three healthy volunteers (1 female, mean age = 35.5 ± 14.3 yrs) underwent brain dMRI on Siemens Magnetom Prisma and Skyra 3T systems, by acquiring monopolar spin-echo EPI with b ranging from 0 up to 2000 s/mm2 along 63 directions (voxel size 2-mm isotropic, matrix 110x110, 72 slices, multiband=2, PF=6/8, GRAPPA=2). On Skyra, scan(1)-rescan(2) of this protocol was acquired with TR/TE=6.7/128ms, while on Prisma, scan(1)-rescan(2) was acquired with TR/TE=5300/92ms in addition to one scan(3) with TR/TE=5300/128ms. Each scan included a reverse phase encoding b=0 image to correct for EPI-induced distortions. Subjects were repositioned between scans.dMRI was preprocessed using three approaches: No denoising, MPPCA2, or RMT3, followed by corrections for Gibbs ringing, Rician bias, eddy currents, EPI distortion, and motion artifacts using the DESIGNER4 pipeline. Zeroth and second order rotationally invariant spherical harmonic features5, R0 and R2 were computed from normalized dMRI signals at b = 1000, 2000 s/mm2. Diffusion and kurtosis tensors were estimated using a weighted linear least squares fit6 in order to derive mean, axial, radial diffusivity (MD, AD & RD), fractional anisotropy (FA), mean, axial, radial kurtosis (MK, AK & RK), and axonal water fraction (AWF)7.
Test-retest variability was compared on a region-of-interest (ROI) level and voxel-wise. 48 white matter ROIs were mapped from the JHU-ICBM-1mm template to an FA image from each scan using FSL-FNIRT. Histogram analysis and the coefficient of variation (CV) were used to compare variability across pairs of scans. For ROI-analysis, CV was computed by:
$$$CV_{ROI} = \frac{1}{N}\sum_{s=1}^{N}\frac{\sigma(ROI_1^{s},\ ROI_2^s)}{\mu(ROI_1^s,\ ROI_2^s)}$$$,
where $$$N\ =$$$ number of subjects, $$$\sigma$$$ the pooled standard deviation over from the same ROI for both scan and rescan, and $$$\mu$$$ the corresponding mean over preprocessing methods (no denoising, MPPCA, RMT). For voxel-wise analysis, B0-images from each of the five scans were registered to a midpoint space by computing an affine transform in ANTs, and CV was computed by:
$$$CV_{voxel} = \frac{2}{N}\sum_{s=1}^{N}\frac{|x_1^s-x_2^s|}{|x_1^s+x_2^s|}$$$,
where $$$x$$$ is a dMRI metric at each voxel for each scan. CVs were compared for each rotational invariant and each tensor parameter for pairs of the five acquired datasets, where Prisma 1 (P1) vs. Prisma 2 (P2) and Skyra 1 (S1) vs. Skyra 2 (S2) measure scan-rescan variation (same scanner, same TE), Prisma 3 (P3) vs. Skyra 1,2 (S) measures inter-scan variation (varying scanner, fixed TE), and Prisma 1,2 (P) vs Prisma 3 (P3) measure inter-protocol variation (same scanner, varying TE).
Results
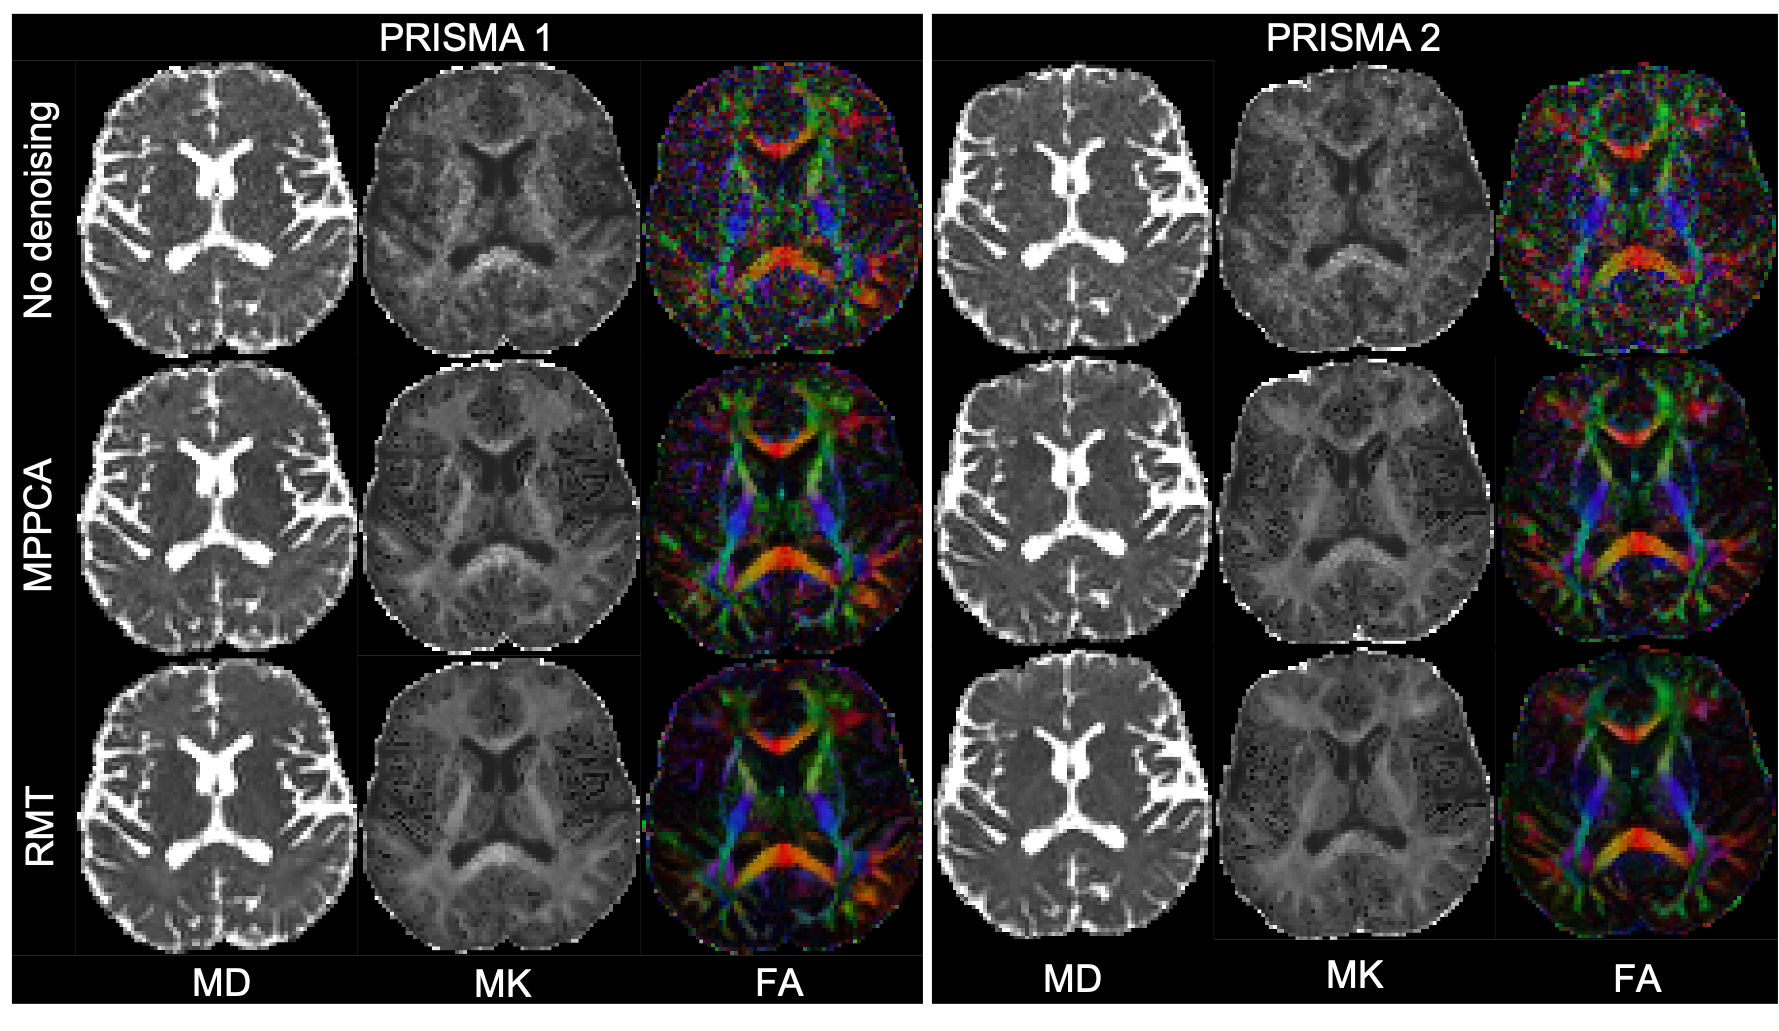
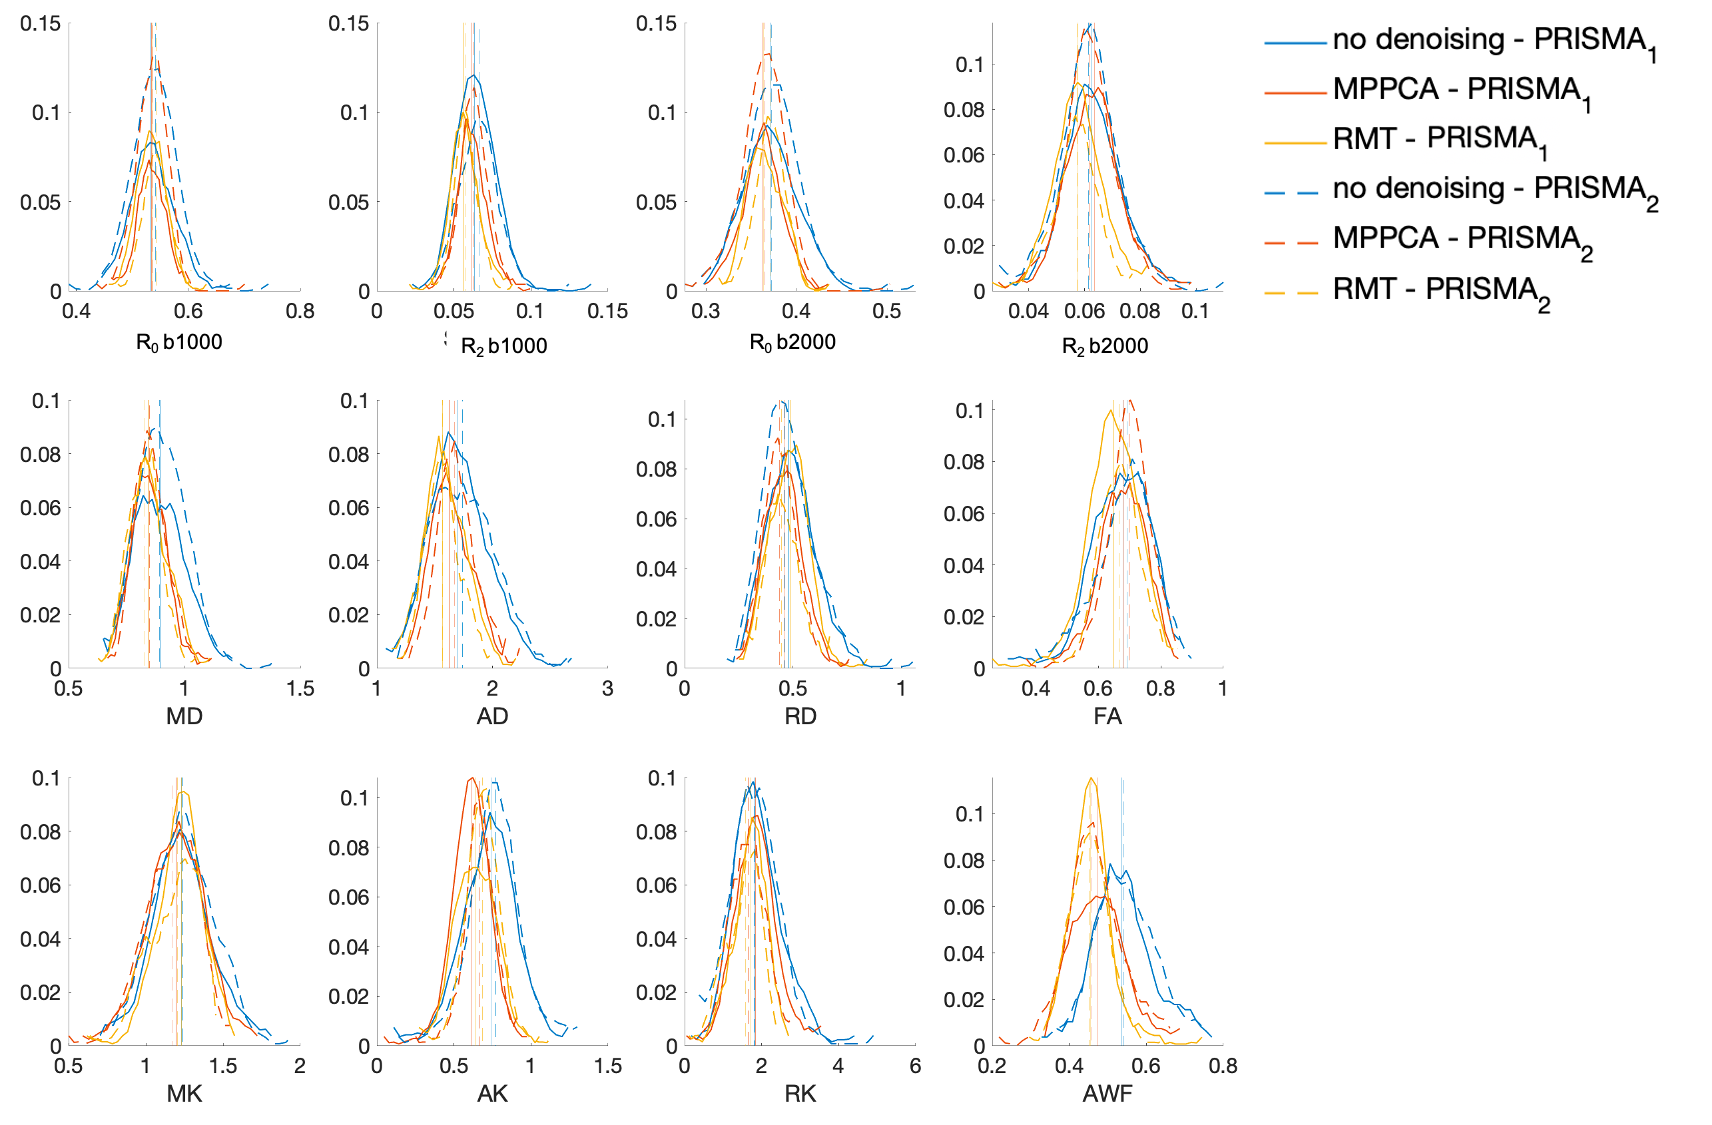
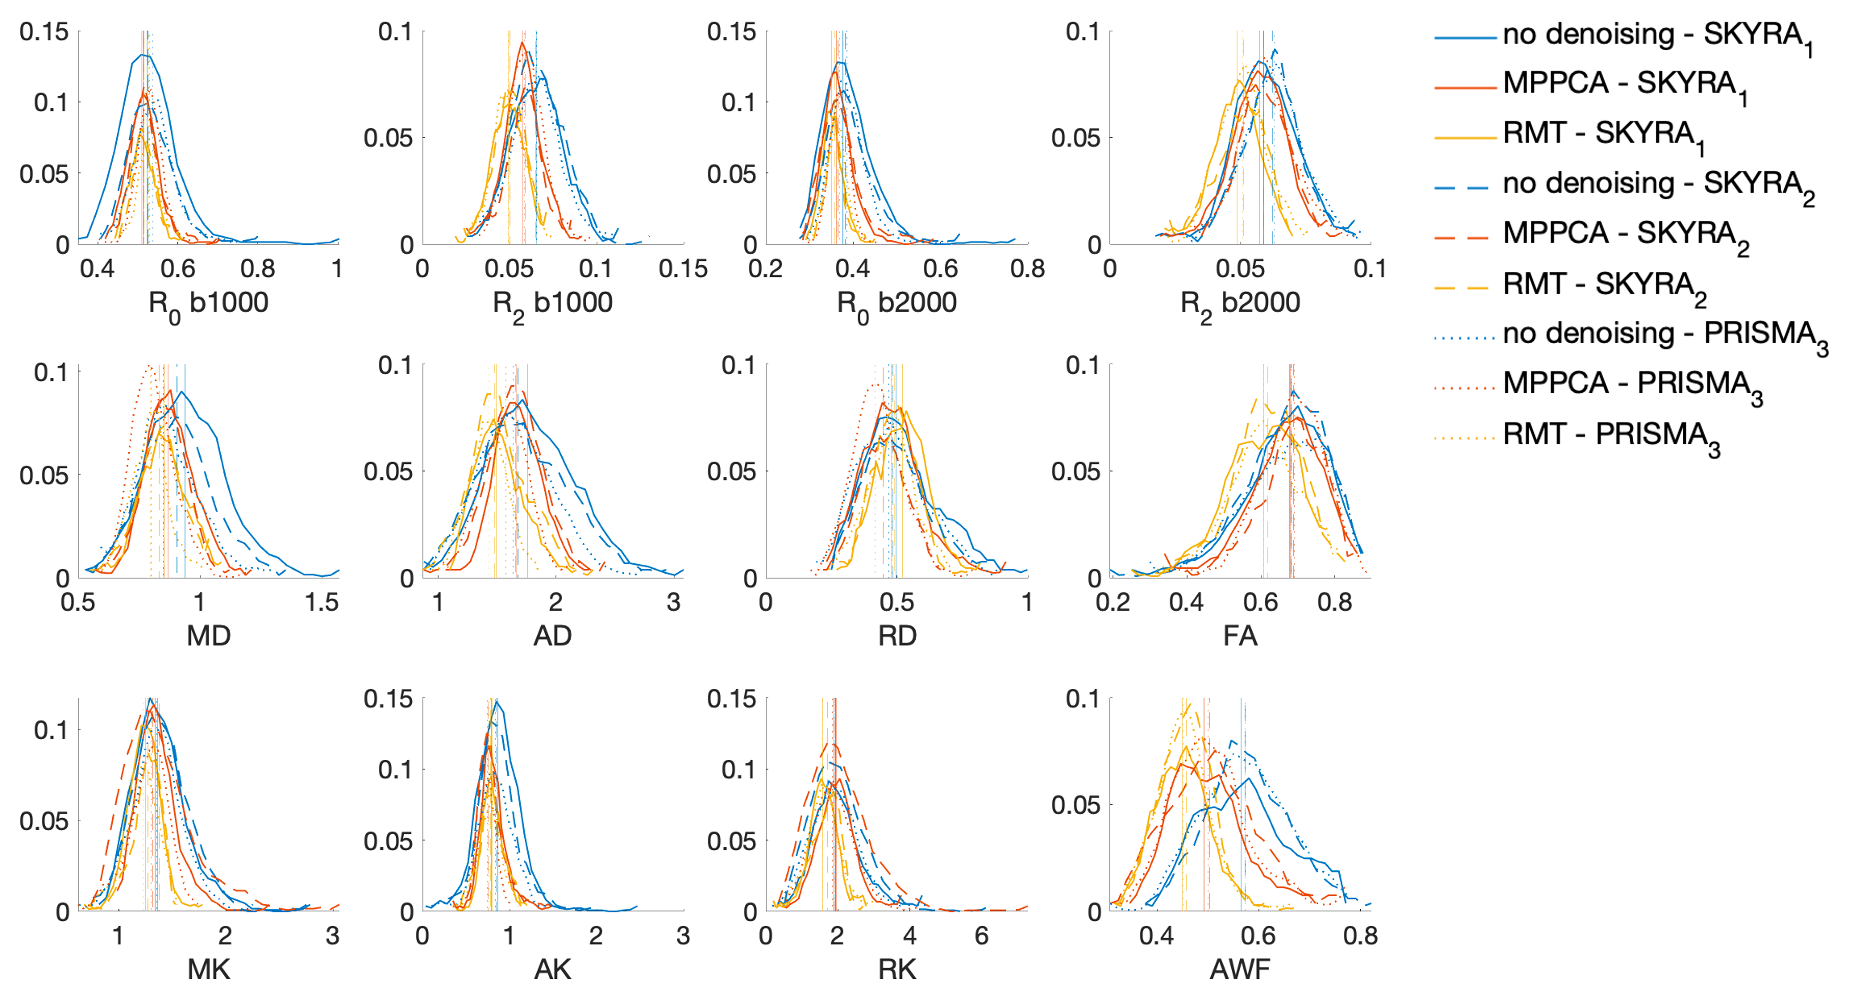
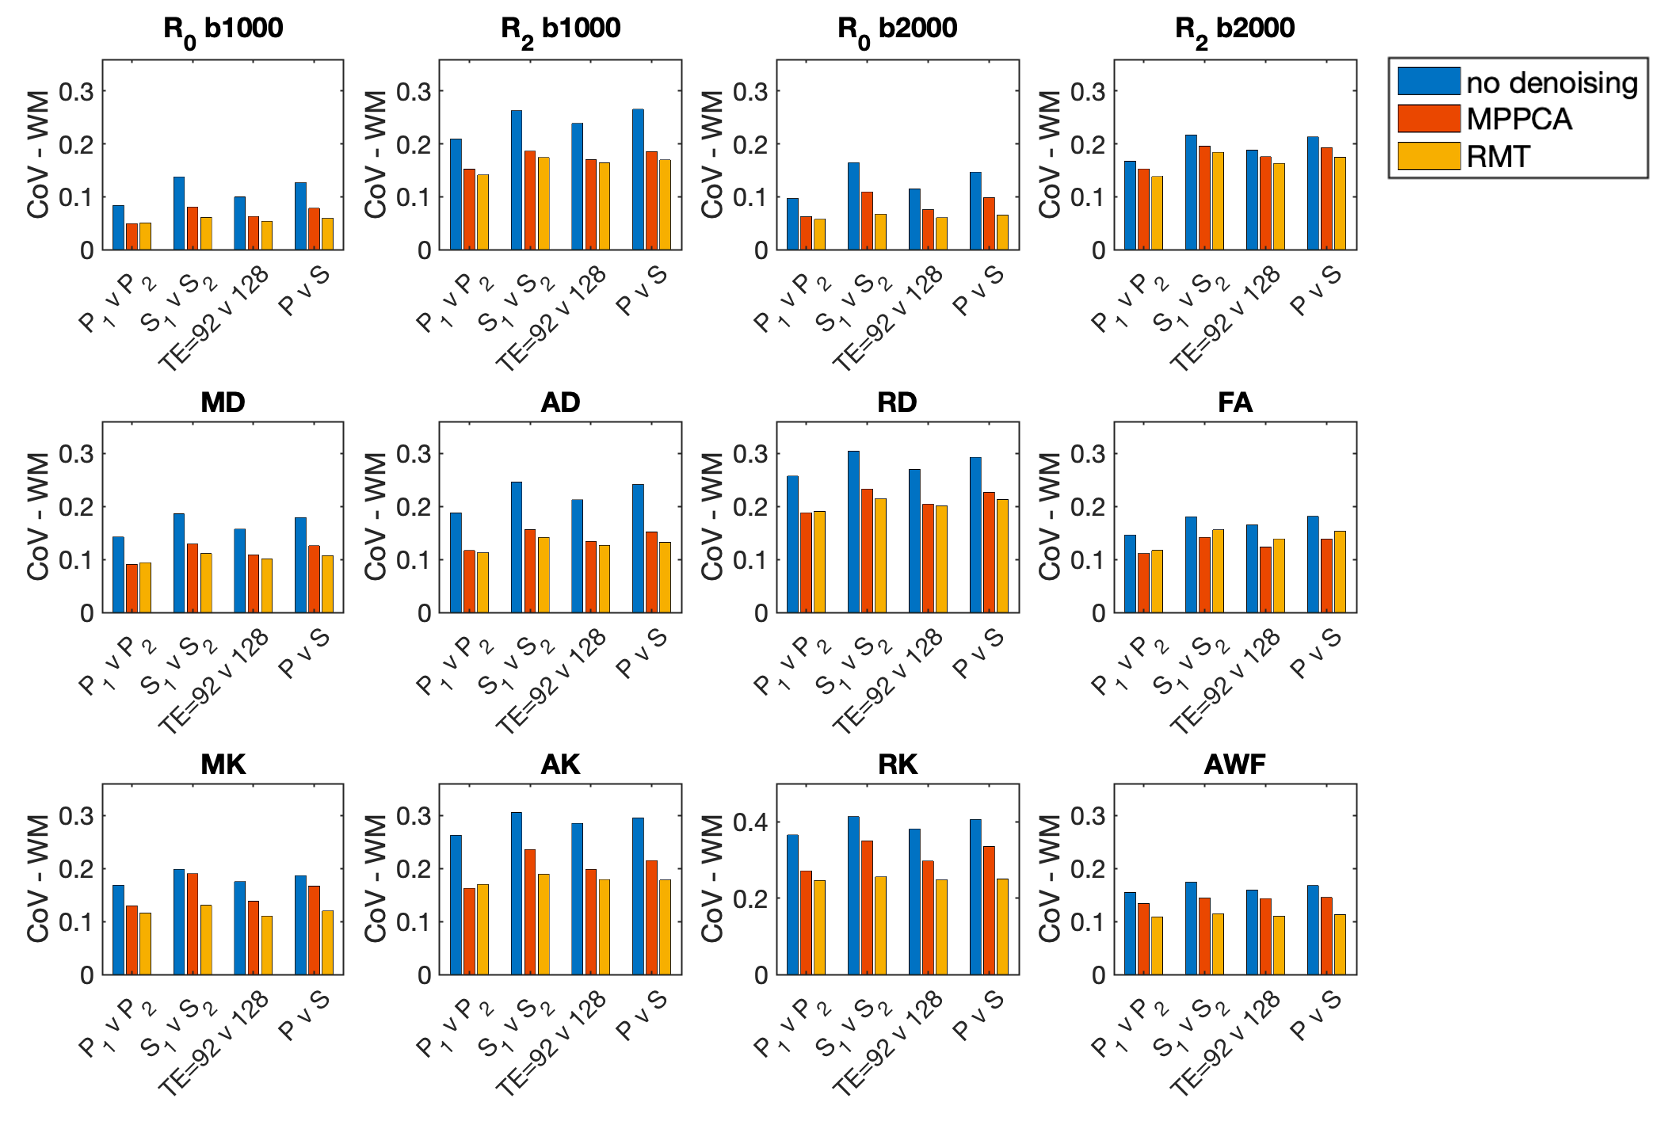
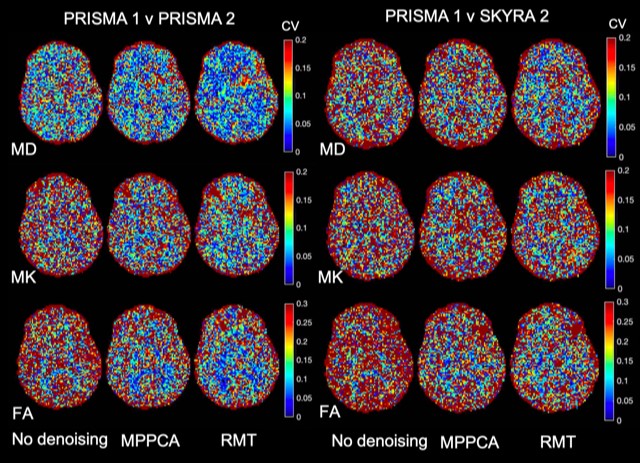
The parametric maps in Figure 1 from P1,2 demonstrate that denoising reduces variability caused by noise in DTI and DKI parameters. Denoising performed in the complex domain (RMT) lowers the Rician noise floor and increases contrast, visibly in color FA maps. Figures 2, 3 show histograms from P1,2 and S1,2, P3, respectively, of all dMRI metrics in the posterior limb of the internal capsule. Histograms for no denoising have increased bias and width compared to MPPCA or RMT, since within-scan variation caused by noise potentially biased tensor eigenvalues in the positive direction (MD, AD, AK). CVs overall were lowest for data denoised with RMT (Figure 4 and Figure 5). Voxelwise CV in white matter for non-denoised data was the highest with values ranging from 10-15% (MD, MK, FA), while denoising reduced CVs to 5-7%. ROI-wise CV was a factor of 2 larger than voxelwise as it accounts for biological variability within the ROI. Remarkably, CVs after denoising were similar for different echo times (92 v 128 ms) and for different scanners across all dMRI measures. Similar results were found in all white matter regions analyzed.Discussion
Our results show that subsequent measurements on different scanners (Prisma, Skyra) and different TE (92ms, 128ms) were found to have high precision with voxelwise CVs on the order of 5% for both DTI and DKI metrics in WM. Without denoising, Prisma-derived metrics for TE=92ms had consistently lower scan-rescan variability. RMT-based denoising2,3 combined with targeted artifact removal4 reduces variability across scanners and TE, resulting in similar ROI-wise CV for all comparisons. As shown in Figure 5, and from analyzing multiple WM ROIs, the CV reduction is uniform across WM. CVs in GM (Figure 5) were larger than in WM. As voxelwise analysis is more vulnerable for misalignment and partial volume, we plan to extend the ROI-analysis to GM, in addition to acquiring more subjects.Conclusion
$$$\mathrm{This\,pilot\,study\,found\,that\,denoising\,and\,targeted\,artifact\,removal\,reduce\,variations\,across}$$$ test-retest datasets down to 5% at the voxel-level and 1% at the ROI-level and help standardize results across scanners and protocols.Acknowledgements
This work was supported by the NIH under awards number R01NS088040 (NINDS), R01EB027075 (NIBIB), R01EB028774 (NIBIB), and by the Center of Advanced Imaging Innovation and Research (CAI$$$^2$$$R, www.cai2r.net), a NIBIB Biomedical Technology Resource Center: P41 EB017183.References
1. Ning, L., Bonet-Carne, E., Grussu, F., Sepehrband, F., Kaden, E., Veraart, J., ... & Alexander, D. C. (2020). Cross-scanner and cross-protocol multi-shell diffusion MRI data harmonization: Algorithms and results. NeuroImage, 221, 117128.
2. Veraart, J., Novikov, D. S., Christiaens, D., Ades-Aron, B., Sijbers, J., & Fieremans, E. (2016). Denoising of diffusion MRI using random matrix theory. Neuroimage, 142, 394-406.
3. Lemberskiy, G., Baete, S., Veraart, J., Shepherd, T. M., Fieremans, E., & Novikov, D. S. (2019). Achieving sub-mm clinical diffusion MRI resolution by removing noise during reconstruction using random matrix theory. In Proceedings of the International Society for Magnetic Resonance in Medicine (Vol. 27).
4. Ades-Aron, B., Veraart, J., Kochunov, P., McGuire, S., Sherman, P., Kellner, E., ... & Fieremans, E. (2018). Evaluation of the accuracy and precision of the diffusion parameter EStImation with Gibbs and NoisE removal pipeline. NeuroImage, 183, 532-543.
5. Novikov, D. S., Veraart, J., Jelescu, I. O., & Fieremans, E. (2018). Rotationally-invariant mapping of scalar and orientational metrics of neuronal microstructure with diffusion MRI. NeuroImage, 174, 518-538
6. Veraart J, Sijbers J, Sunaert S, Leemans A, Jeurissen B. Weighted linear least squares estimation of diffusion MRI parameters: strengths, limitations, and pitfalls. Neuroimage. 2013 Nov 1;81:335-346. doi: 10.1016/j.neuroimage.2013.05.028. Epub 2013 May 16. PMID: 23684865.
7. Fieremans, E., Jensen, J. H., & Helpern, J. A. (2011). White matter characterization with diffusional kurtosis imaging. Neuroimage, 58(11), 177-188
Figures