0404
Enforcing positivity constraints in Q-space Trajectory Imaging (QTI) allows for reduced scan time1Department of Biomedical Engineering, Linköping University, Linköping, Sweden, 2Center for Medical Image Science and Visualization, Linköping University, Linköping, Sweden, 3Department of Mathematics, Linköping University, Linköping, Sweden, 4Department of Computer Science, University of Copenhagen, Copenhagen, Denmark
Synopsis
We explore the feasibility of reducing scan time while retaining interpretable results when analysing multidimensional diffusion MRI data. The methods commonly employed for the estimation of the QTI model parameters might suffer severely from data under-sampling, making their use limited in clinical practice where acquisition time is limited. We show that by imposing relevant positivity constraints in the estimation of the mean, covariance, and moment tensors, the QTI+ framework strongly improves the quality of the derived maps, particularly so for data acquisition protocols featuring few number of volumes.
Introduction
Acquisition time is a serious concern in clinical practice, and often there need to be compromises between the quality of the acquired data and the discomfort imparted to the patients during the process. Diffusion MRI (dMRI) is a powerful imaging modality, which has recently gained momentum thanks to the introduction of new acquisition schemes and models of increased complexity that can provide loads of information about the microstructure of the scanned specimen. Q-space Trajectory Imaging (QTI)1 is one such framework that exploits data acquired with different shapes of the B-tensor to disentangle information about the tissue microstructure, which is represented via a diffusion tensor distribution (DTD)2. This is accomplished through relationships between the signal and the moments of the DTD. Here, we investigate whether employing a constrained estimation framework makes it possible to reduce scan time while retaining acceptable quality in the obtained information.Method
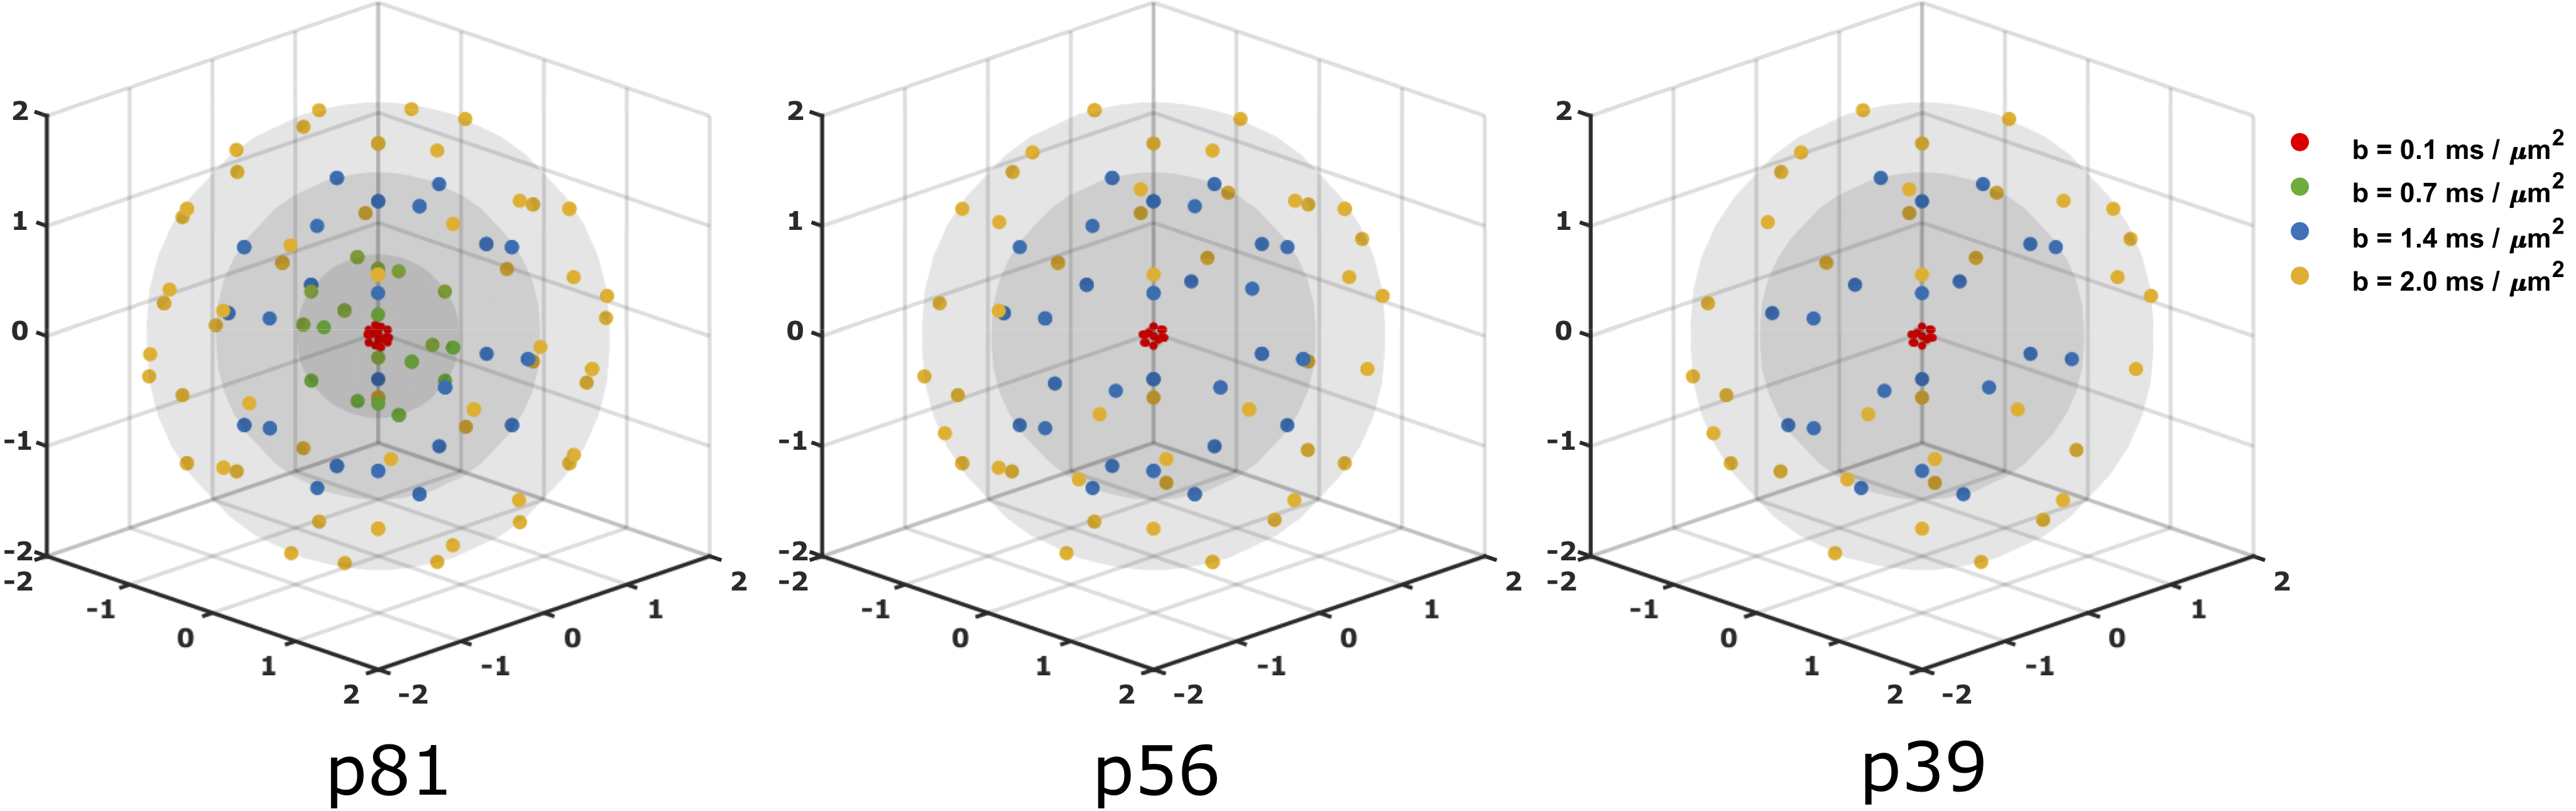
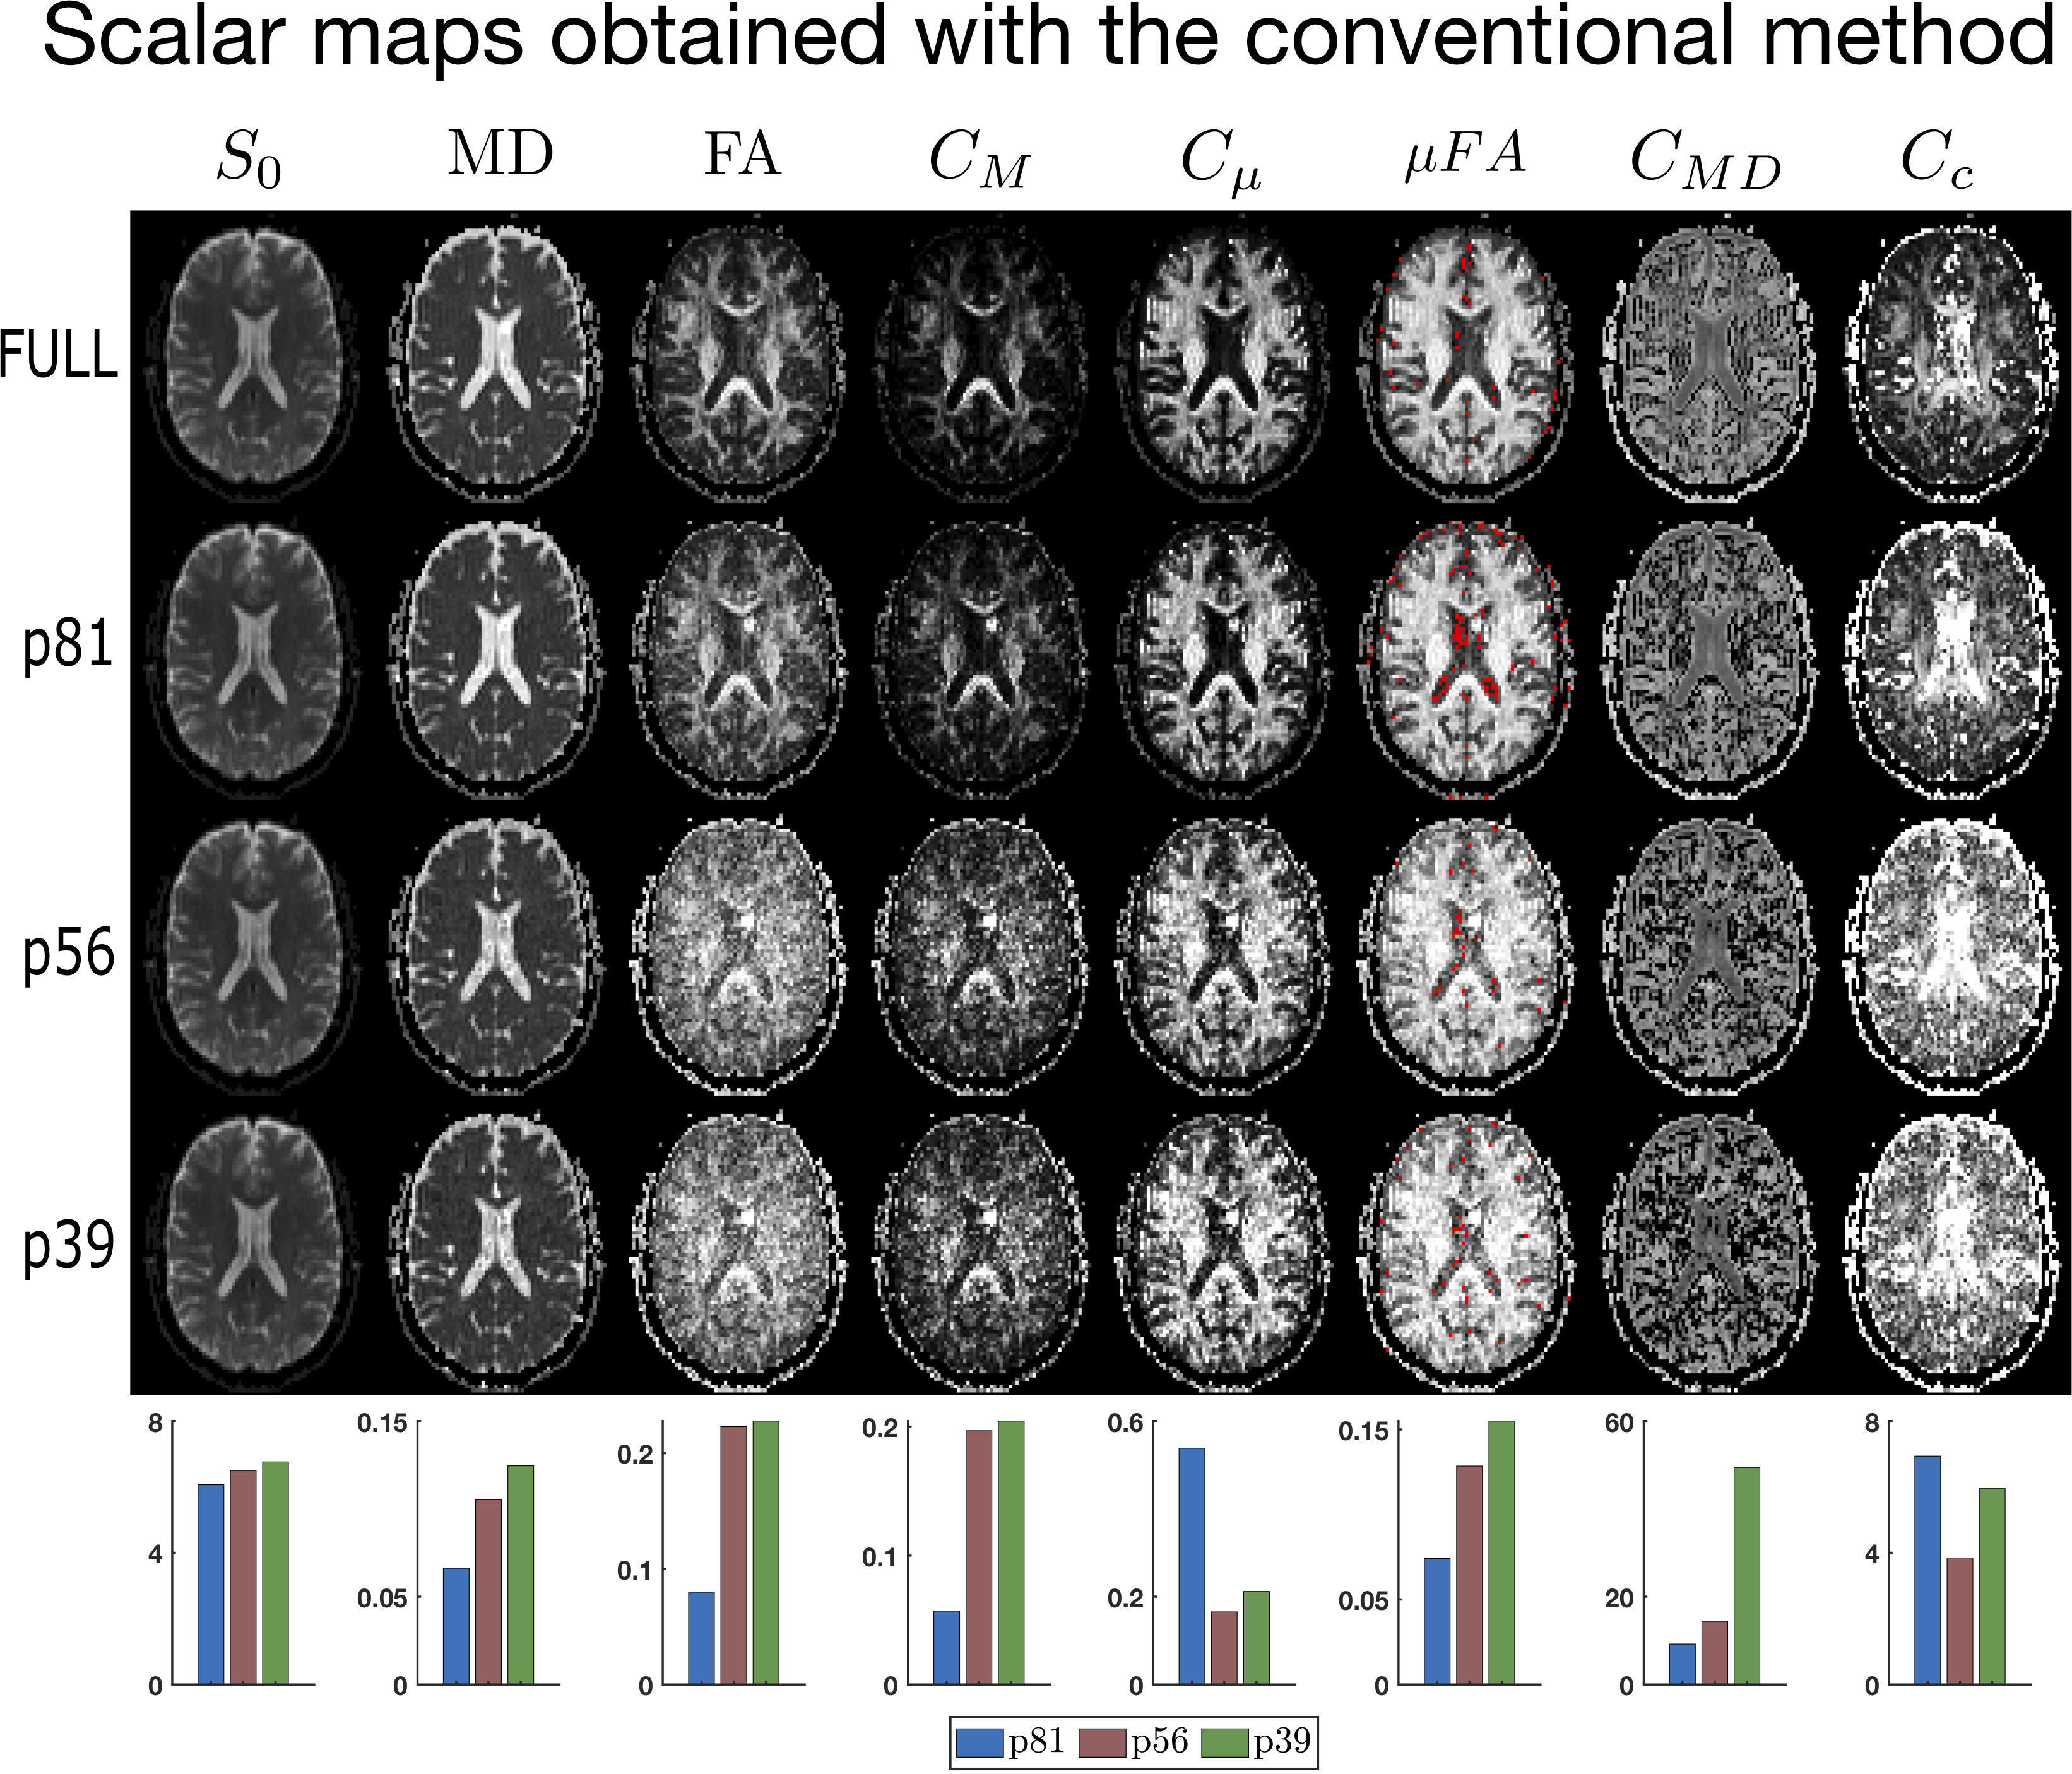
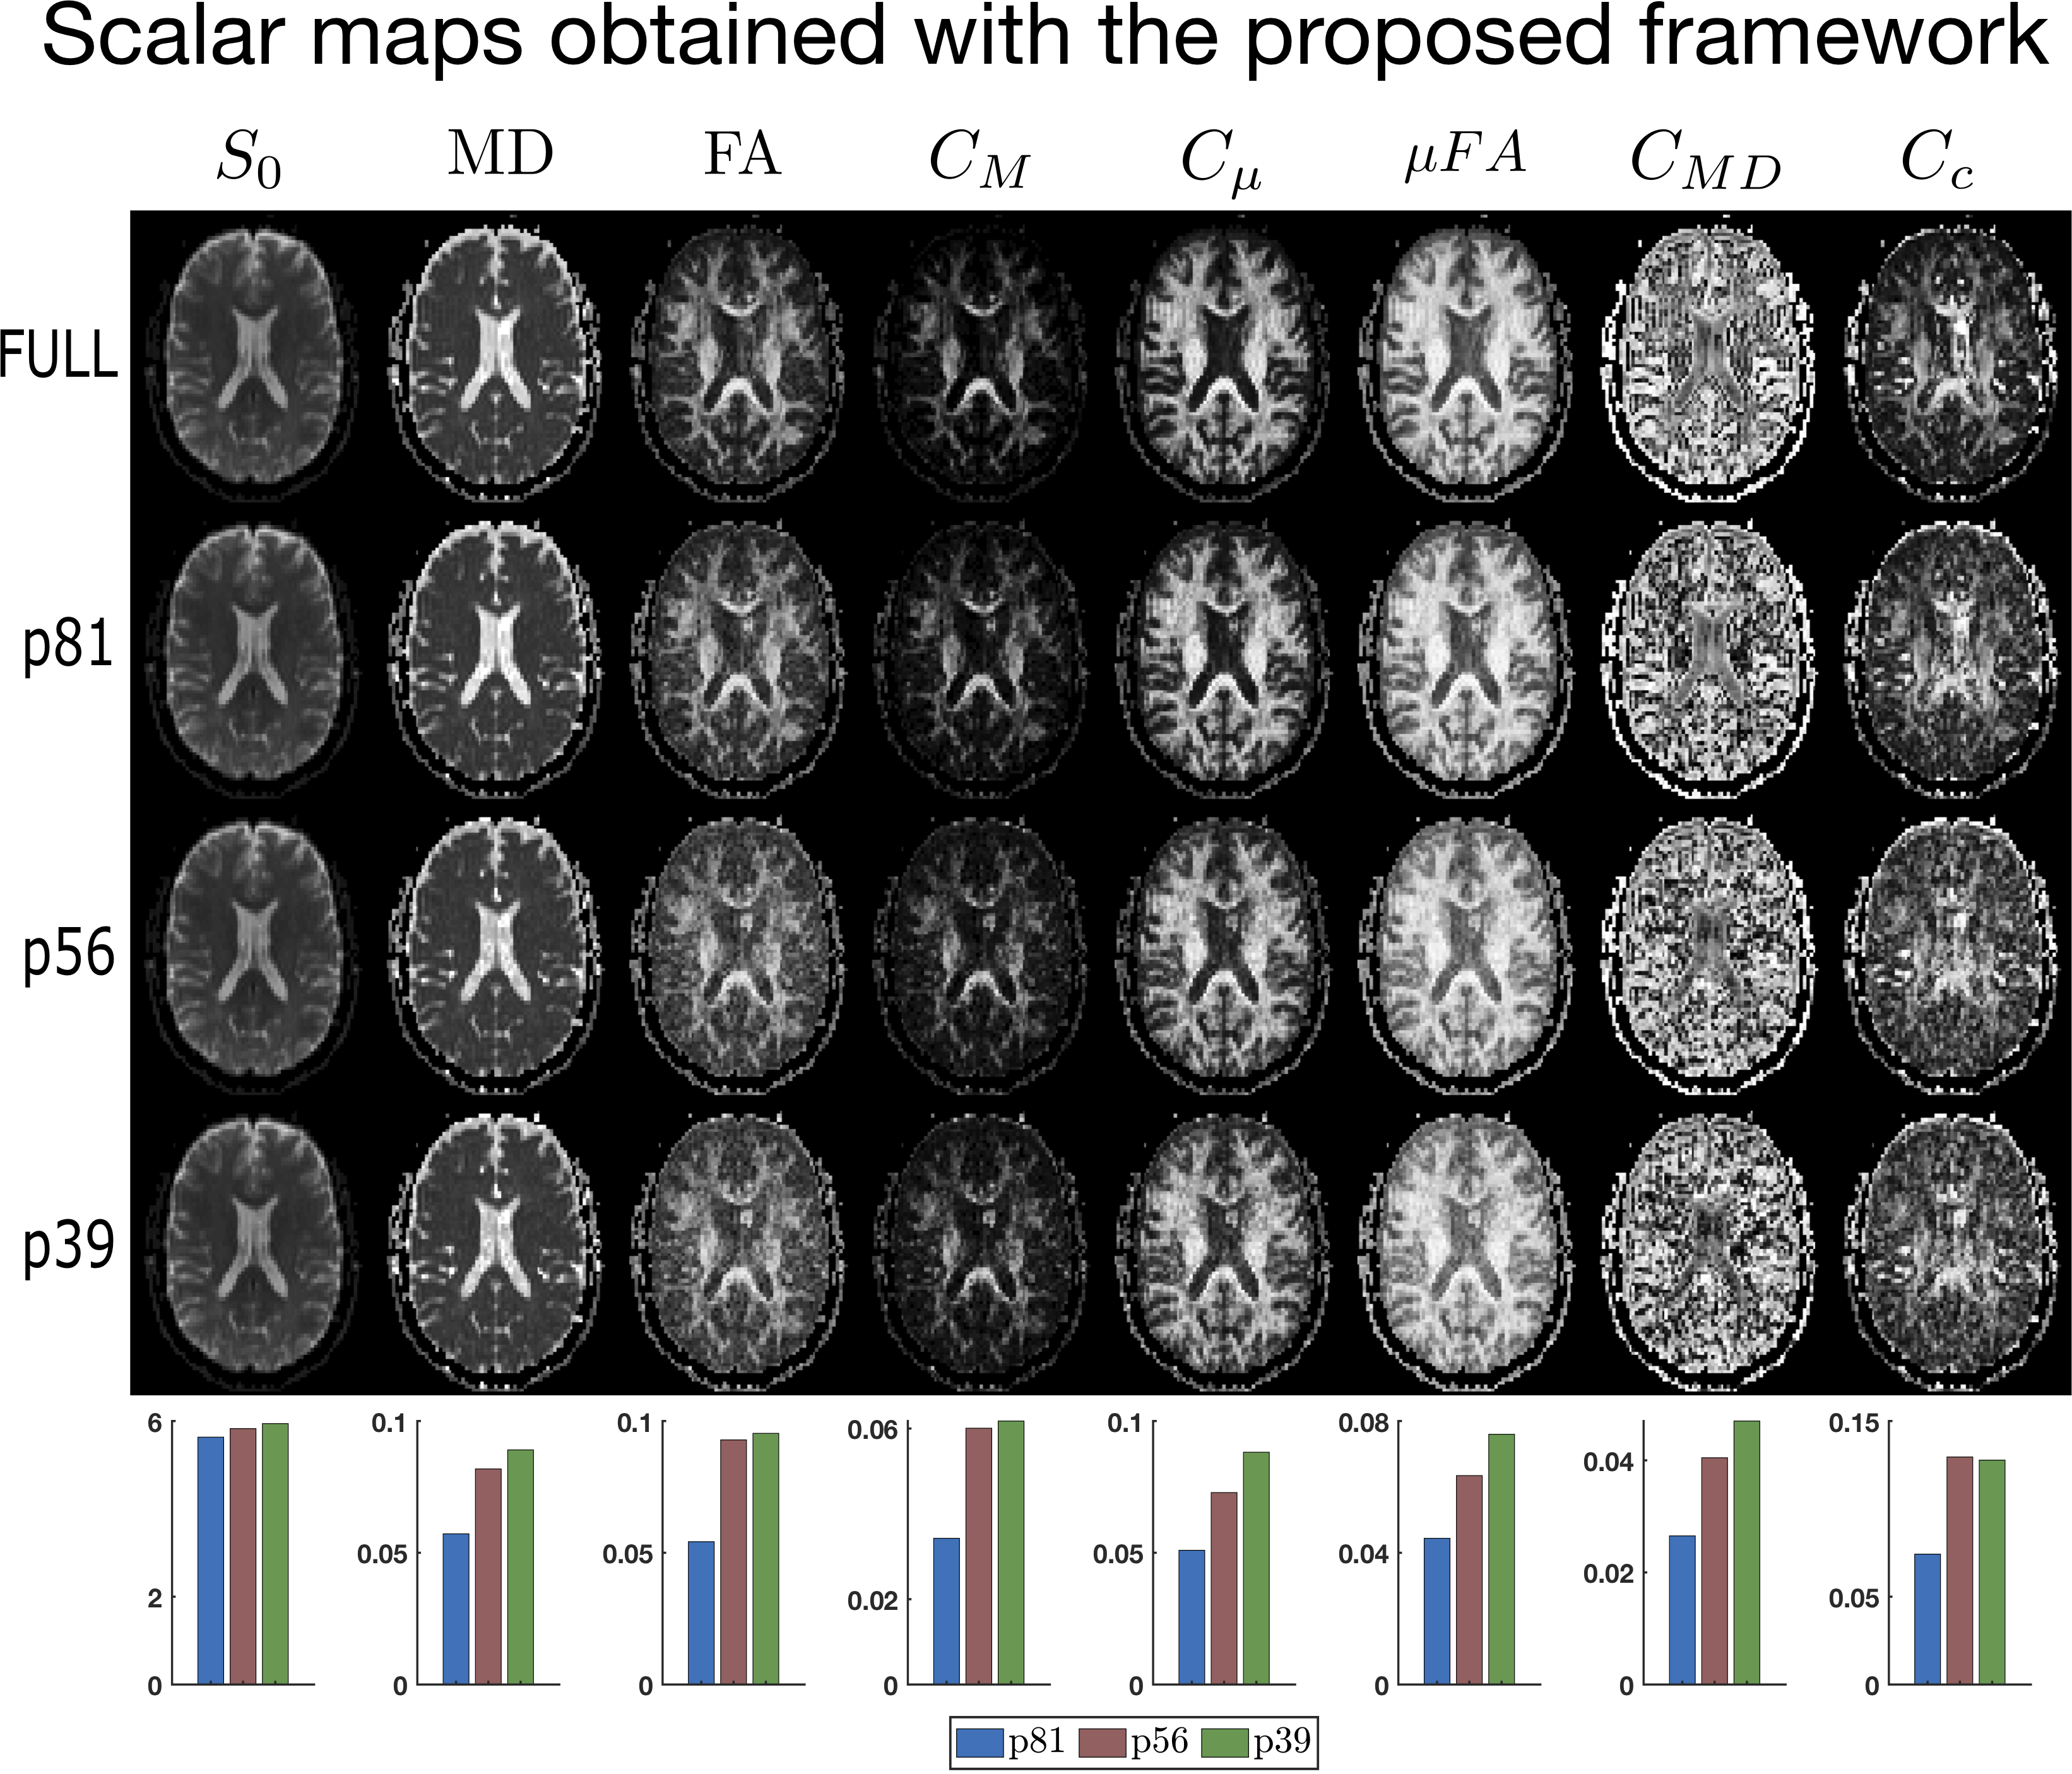
Our constrained estimation framework guarantees the fulfillment of three nonnegativity conditions on the mean, covariance, and (second) moment tensors of the DTD as dictated by the mathematical properties of these model parameters. This is accomplished by Semidefinite Programming (SDP), which guarantees that a solution to the fitting problem is always found. Following the naming convention in Ref. (3), we refer to this framework as QTI+.To assess the performance of the QTI+ analysis, we employed a publicly available dataset collected using Linear, Spherical and Planar Tensor Encoding (LTE, STE, PTE) for a total duration of approximately 23 minutes4, and ‘downsampled’ it to three different protocols by selecting various subsets of volumes. The protocols used in this study are summarized and depicted in Figure (1). For brevity, we refer to the 81, 56, and 39 measurement protocols respectively as p81, p56, and p39. The volumes in each protocol were randomly picked with some attention directed to obtaining reasonably spread measurements.
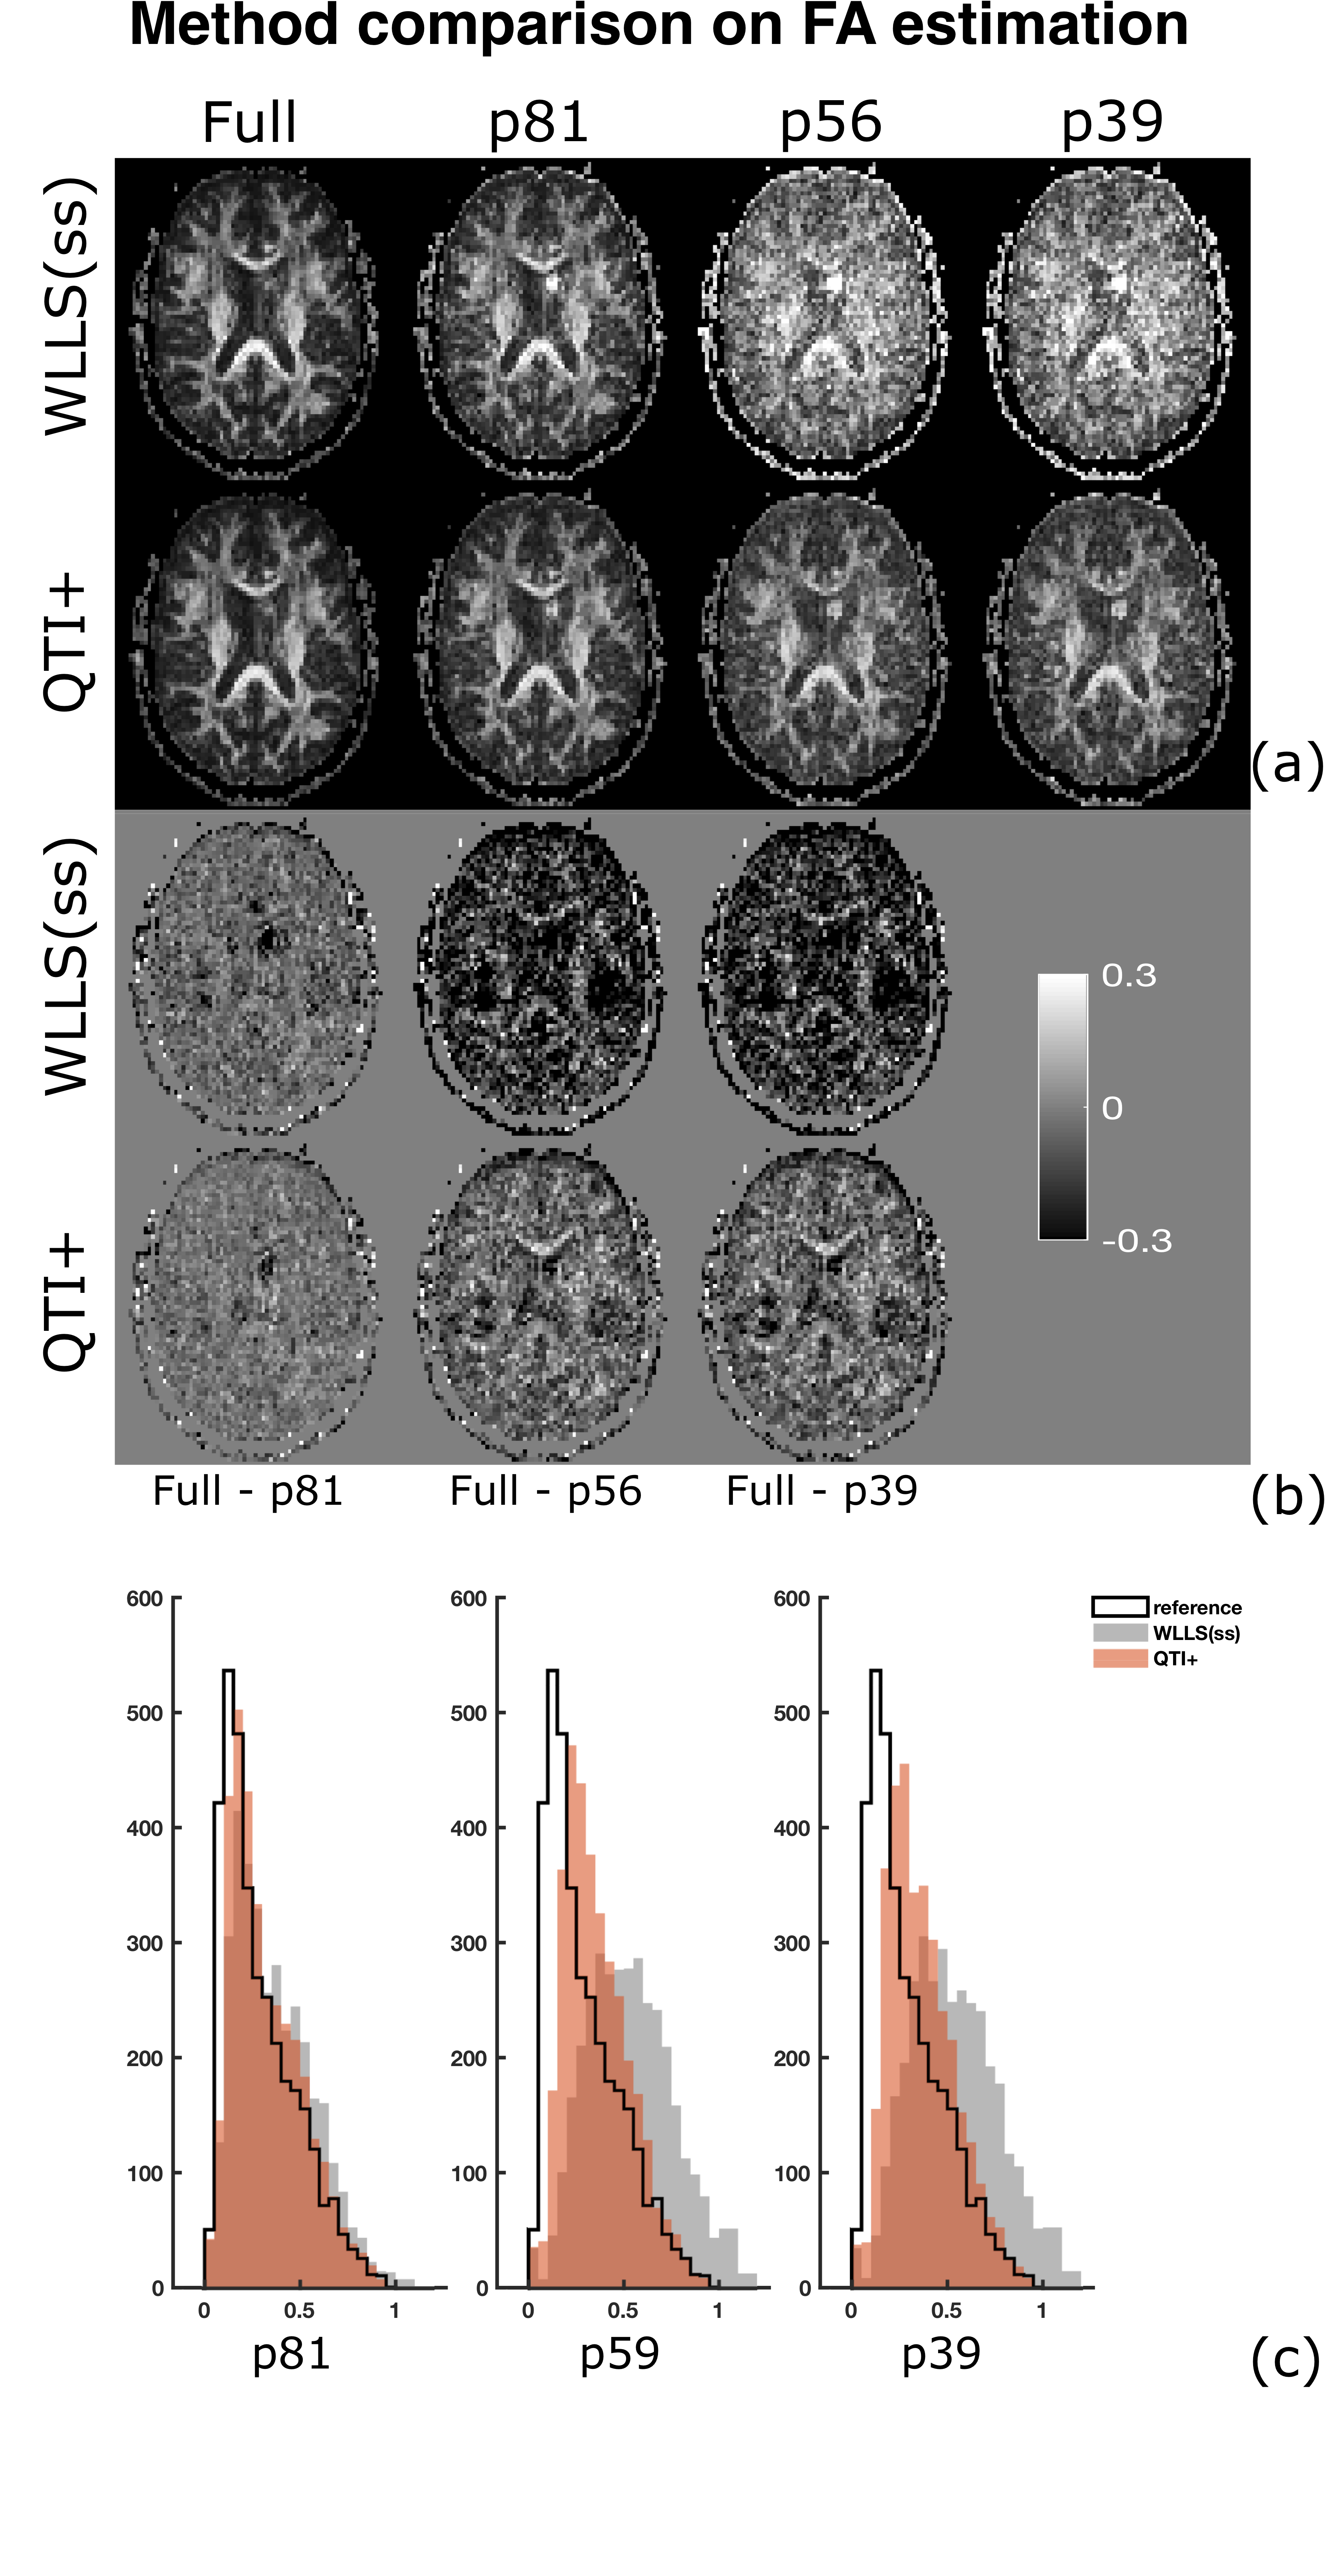
The QTI and QTI+ methods were employed on all protocols. The QTI method considered here (available at Ref. (5)) features a weighted linear least squares estimation wherein a possible rank-deficiency of the design matrix is treated (when needed) through a scheme performing the estimation in a subspace of the full parameter space. We refer to this method as WLLS(ss). In our comparisons, the results obtained from the full dataset featuring all 377 volumes, which we refer to as ‘full’, served as the ground truth. For quantitative comparisons, we computed the mean (over the brain parenchyma voxels) of the absolute deviations of the estimated scalar measures from their ground truth values.
Results
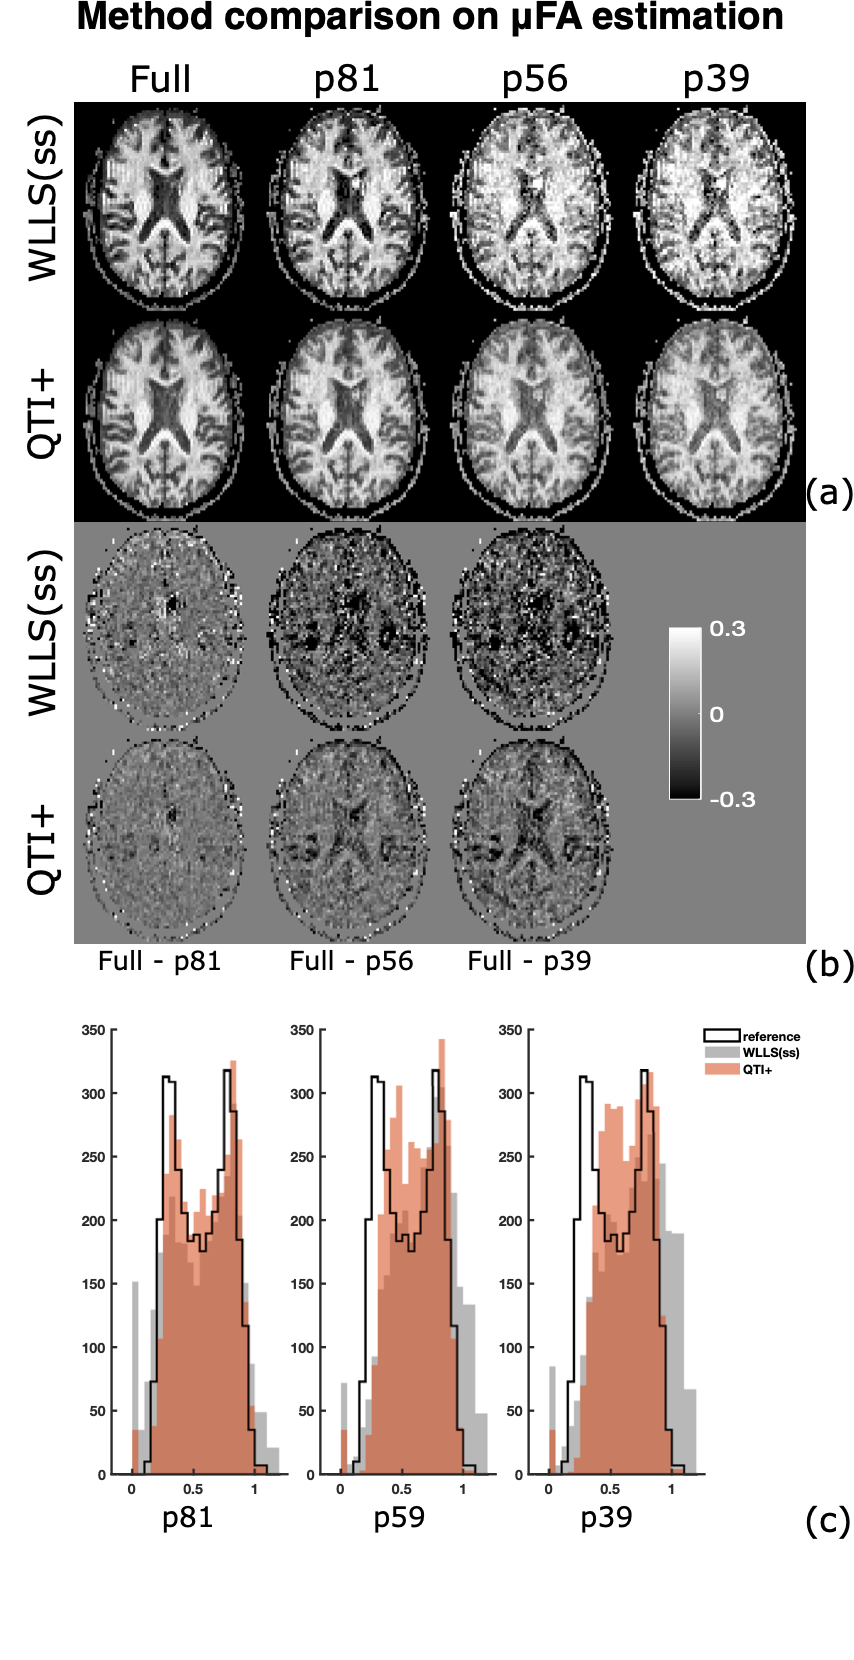
Figures (2) and (3) show the scalar maps obtained by fitting the considered protocols, respectively, with and without imposing the nonnegativity constraints. Looking at both panels, the orientation coherence ($$$C_{c}$$$) and size variance ($$$C_{MD}$$$) become hardly interpretable already when employing the 81-measurement protocol, while the non-diffusion weighted ($$$S_0$$$) and mean diffusivity ($$$MD$$$) maps are not severely affected by the downsampling. The anisotropy maps (fractional anisotropy $$$FA$$$, macroscopic anisotropy $$$C_{M}$$$, and microscopic anisotropy $$$C_{\mu} = \mu FA^2$$$) are acceptable for both methods though having a smoother appearance when computed on the 81-measurement protocol. At lower samplings, the improvement obtained by enforcing constraints becomes clear.Figures (4) and (5) show details for the $$$FA$$$ and $$$\mu FA$$$ maps, respectively. Looking at the (a) panels, the benefits of applying constraints are already evident. Interestingly, the maps obtained with QTI+ appear overall smoother even though the method is performed on a voxel-by-voxel basis without incorporating any intervoxel information. Panels (b) in these figures show the difference between the maps estimated with the full protocol and the downsampled ones. It is quite interesting to note that reducing the number of measurements from 56 to 39 does not drastically change the results. Moreover, in the case of $$$\mu FA$$$, it seems that the difference maps (‘$$$\mu FA_{full}-\mu FA_{p56}$$$’ and ‘$$$\mu FA_{full}-\mu FA_{p39}$$$’) contain anatomy-dependent features that are suppressed when QTI+ is employed. The histograms in panels (c) show how the downsampling introduces a bias towards higher values in the anisotropy measures, but also that constraining the fit strongly reduces the number of voxels presenting values outside the expected range ([0,1] for $$$FA$$$ and $$$\mu FA$$$).
Discussion
The downsampled protocols consisted of measurements randomly picked from a predefined set, thus were not optimized. Despite this additional limitation of the downsampled protocols, the QTI+ framework yielded acceptable image quality even when only 39 volumes are considered. This encouraging finding suggests that the constrained estimation framework could be more resilient to imperfections in the experimental design, which is unavoidable, e.g., in the presence of gradient nonlinearities.By demonstrating that sophisticated post-processing algorithms allow reduced acquisition times, our work complements efforts that employ parsimonious acquisition schemes to achieve the same6.
Conclusion
In conclusion, we showed that enforcing positivity constraints during the fitting of the QTI representation alleviates the necessity of collecting large amount of data. Thus, employing constrained estimation is expected to improve the feasibility, hence the diagnostic utility of the derived scalar parameters, which could be sensitive to alterations induced by various pathologies1,7,8.Acknowledgements
This project was financially supported by the Swedish Foundation for Strategic Research (AM13-0090 and Multimodal Guidance in Neurosurgery), the Swedish Research Council 2016-04482, Linkoping University (LiU) Center for Industrial Information Technology (CENIIT), LiU Cancer, VINNOVA/ITEA3 17021 IMPACT, and Analytic Imaging Diagnostic Arena (AIDA). Tom Dela Haije was supported by the Villum Foundation (Denmark).References
1. Westin, C.F., Knutsson, H., Pasternak, O., Szczepankiewicz, F., Özarslan, E., van Westen, D., Mattisson, C., Bogren, M., O'Donnell, L.J., Kubicki, M., Topgaard, D., Nilsson, M. Q-space trajectory imaging for multidimensional diffusion MRI of the human brain. NeuroImage 2016;135:345.
2. Jian, B., Vemuri, B.C., Özarslan, E., Carney, P.R., Mareci, T.H. A novel tensor distribution model for the diffusion-weighted MR signal. NeuroImage 2007;37(1):164-176.
3. Dela Haije, T., Özarslan, E., Feragen, A. Enforcing necessary non-negativity constraints for common diffusion MRI models using sum of squares programming. NeuroImage 2020;209:116405.
4. Szczepankiewicz F, Hoge S, Westin CF. Linear, planar and spherical tensor-valued diffusion MRI data by free waveform encoding in healthy brain, water, oil and liquid crystals. Data Brief. 2019;25:104208.
5. https://github.com/markus-nilsson/md-dmri
6. Nilsson M, Szczepankiewicz F, Brabec J, Taylor M, Westin CF, Golby A, Van Westen D, Sundgren PC. Tensor-valued diffusion MRI in under 3 minutes: An initial survey of microscopic anisotropy and tissue heterogeneity in intracranial tumors. Magn Reson Med, 2020.
7. Andersen, K.W., Lasic, S., Lundell, H., Nilsson, M., Topgaard, D., Sellebjerg, F., Szczepankiewicz, F., Siebner, H.R., Blinkenberg, M., Dyrby, T.B. Disentangling white-matter damage from physiological fibre orientation dispersion in multiple sclerosis. Brain Commun 2020;2(2).
8. Szczepankiewicz, F., van Westen, D., Englund, E., Westin, C.F., Ståhlberg, F., Lätt, J., Sundgren, P.C., Nilsson, M. The link between diffusion MRI and tissue heterogeneity: mapping cell eccentricity and density by diffusional variance decomposition (DIVIDE). Neuroimage 2016;142:552.
Figures