0403
Resolving the underlying sources of diffusion kurtosis in focal ischemia by Correlation Tensor MRI1Champalimaud Research, Champalimaud Centre for the Unknown, Lisbon, Portugal, 2Center of Functionally Integrative Neuroscience (CFIN) and MINDLab, Department of Clinical Medicine, Aarhus University, Aarhus, Denmark, 3Department of Physics and Astronomy, Aarhus University, Aarhus, Denmark
Synopsis
Correlation Tensor MRI (CTI) has been recently introduced for resolving the underlying sources of diffusional kurtosis. Here, we aimed to resolve the underlying kurtosis sources in ischemic tissue. Ex and in vivo CTI experiments in a mouse model of ischemia revealed enhanced sensitivity and specificity compared to their conventional counterparts. Our results suggest that microscopic kurtosis – associated with restricted diffusion and structural disorder – substantially contributes to the total kurtosis excess likely reflecting excitotoxic properties. Kurtosis associated with diffusion magnitude variance better reflected edema and free water. These first results are promising for elucidating biological factors in ischemia.
Introduction
Stroke is a leading cause of long-term disability and death worldwide1, with ischemic infarct accounting for approximately 80% of all cases2. Despite its reliability for investigating the local tissue milieu following ischemia3, dMRI is unspecific, thereby hampering the definitive characterization of infarct core, penumbra and response to treatment. Correlation Tensor Imaging (CTI)4 was recently introduced for enhancing sensitivity and specificity towards tissue microstructure via the resolution of non-gaussian diffusion sources – by relying on the cumulant expansion of the double diffusion encoding (DDE) signal. Here, we aimed to apply CTI for characterizing ischemic tissue ex and in vivo for the first time, and assess the mechanisms underlying dMRI contrasts in a mouse stroke model.Methods
All animal experiments were preapproved by the competent national and international authorities and were carried out according to EU Directive 2010/63.Animal preparation: Adult 11-week-old male C57BL/6 mice were used (N = 10). A photothrombotic stroke model5 was used to induce a focal infarct in the barrel cortex (S1bf) with a solution of Rose Bengal dye (Sigma Aldrich, Portugal) (15 mg/ml) – delivered intravenously (10 μl/g animal weight); the animals were subsequently irradiated with a cold light source in the S1bf6 for 15 minutes. A sham group underwent identical procedures except for the lesion-inducing illumination. 3 hours post illumination offset, the brains (N = 5 per group) were extracted via standard transcardial perfusion, kept in 4% PFA (2 days) and then transferred to PBS (5 days). Before scanning, brains were placed in a 10 mm NMR tube filled with Fluorinert (Sigma Aldrich, Portugal). Additionally, a stroked animal and a healthy animal were used for in vivo acquisitions.
MRI experiments: Ex vivo data were acquired on a 16.4 T Bruker Aeon scanner, equipped with a 10 mm Micro5 probe and gradients capable of producing up to 3000 mT/m (isotropic). A DDE pulse sequence7 was used for the diffusion MRI acquisitions (total maximum b-value of 3 ms/μm2, gradient pulse separation Δ = τm = 10 ms, δ = 1.5 ms, TE/TR = 49/3000 ms, FOV = 11 × 11 mm2, in-plane resolution = 141 × 141 μm2, slice thickness = 0.5 mm, 8 averages). DDE experiments were repeated for different gradient magnitude and direction combinations described by Henriques et al.4.
In vivo diffusion data were acquired on a pre-clinical 9.4 T Bruker Biospec scanner, equipped with a gradient system able to produce up to 600 mT/m (isotropic). Mice were scanned under anaesthesia (2.5% isoflurane, 27% oxygen) and a DDE pulse sequence was used (total maximum b-value of 2.5 ms/μm2, Δ = τm = 10 ms, δ = 4 ms, TE/TR = 44.5/2800 ms, FOV = 12 × 12 mm2, in-plane resolution = 181 × 181 μm2, slice thickness = 0.85 mm). DDE experiments followed the ex vivo CTI paradigm but with 1 average.
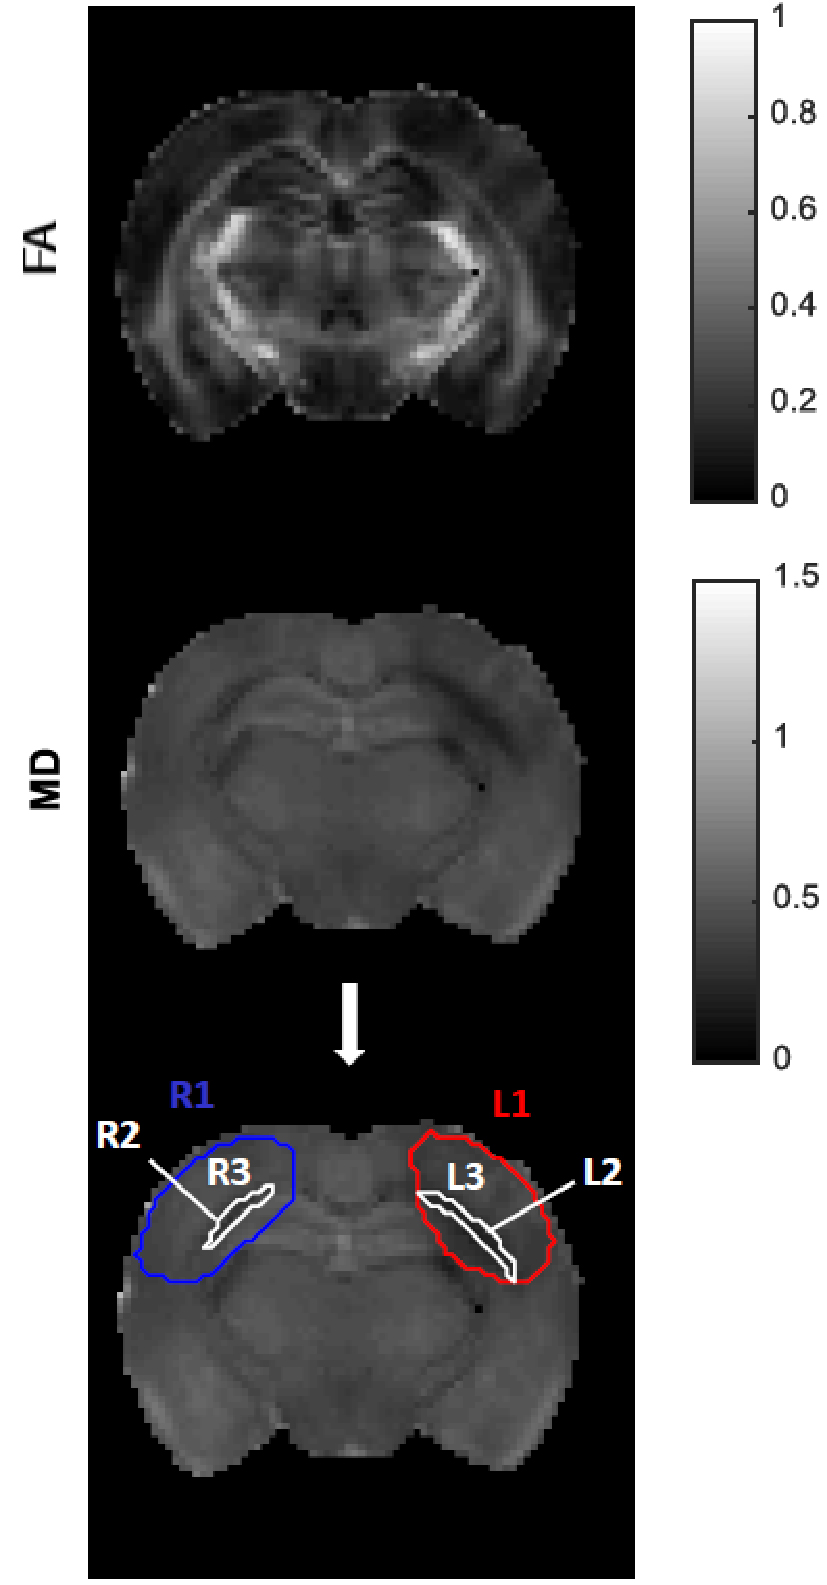
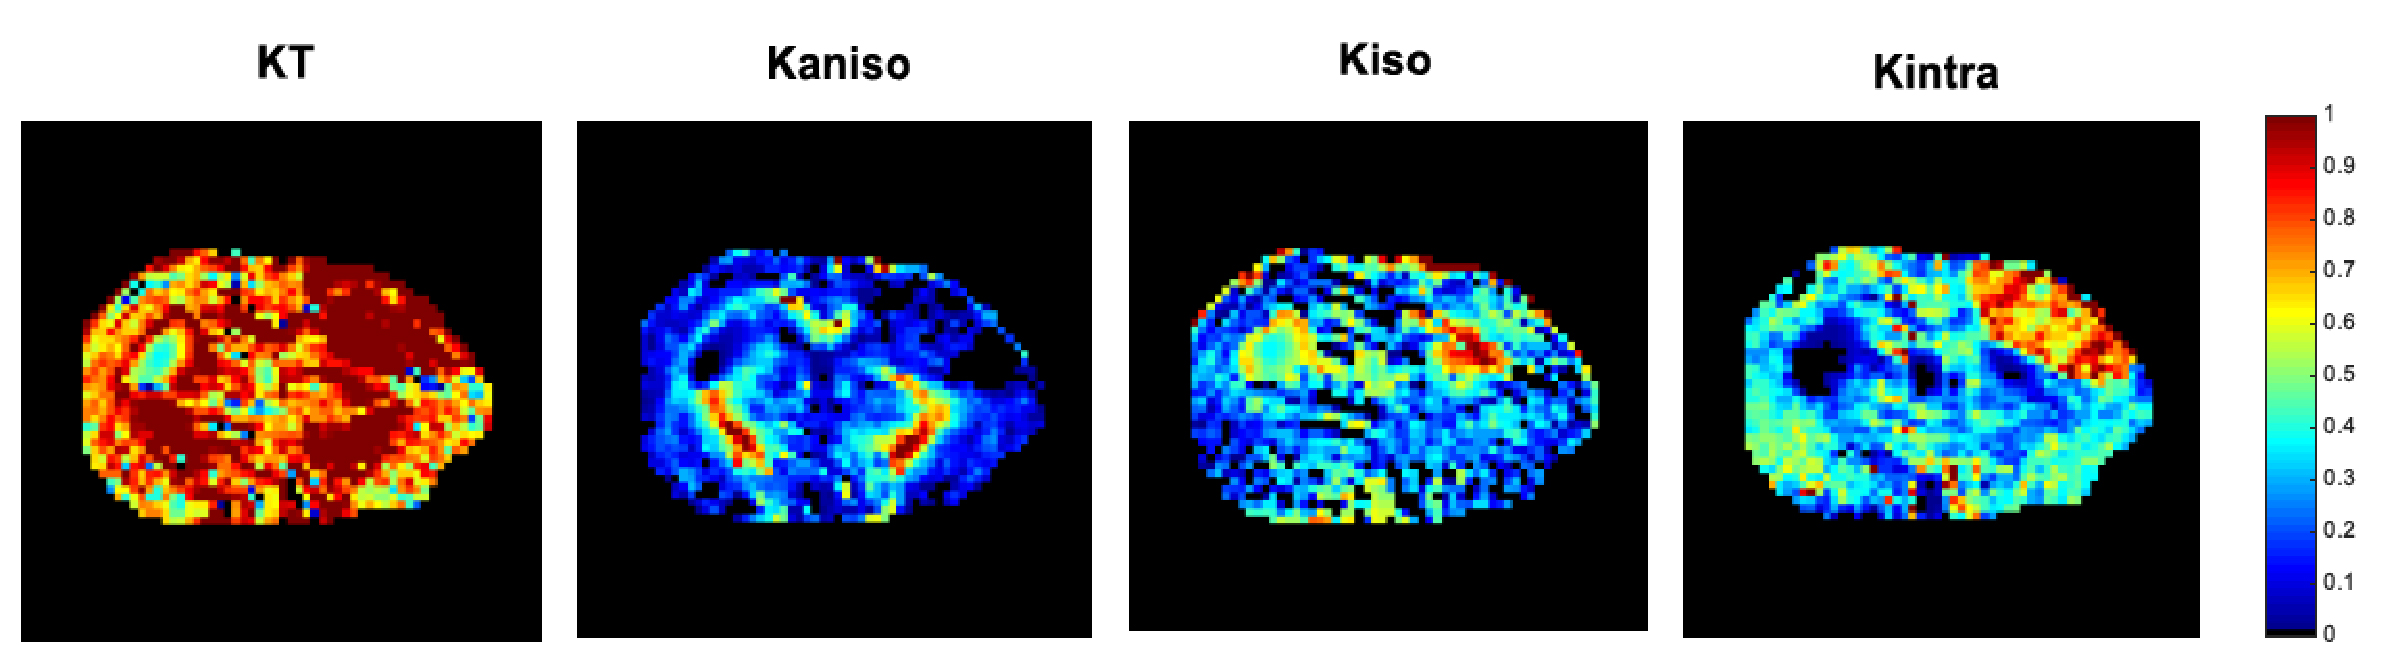
Data analysis: Raw diffusion data was denoised8 and Gibbs artefact unrung9,10, and all datasets were aligned via a sub-pixel registration method11. CTI metrics (KT, Kaniso, Kiso, Kintra) were estimated. ROIs were drawn considering the total lesion and subsequent thresholded selection of gray and white matter (GM and WM, respectively) within the ROI (Fig.1). A sensitivity analysis along with a specificity analysis – in which significant differences across regions were tested using a one-way ANOVA – were performed.
Results
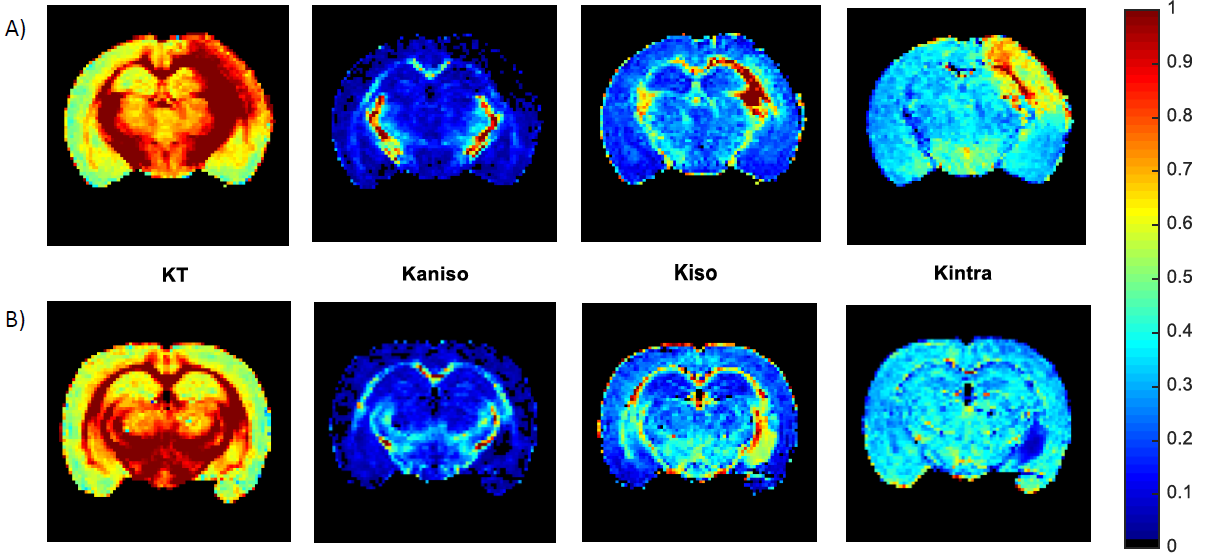
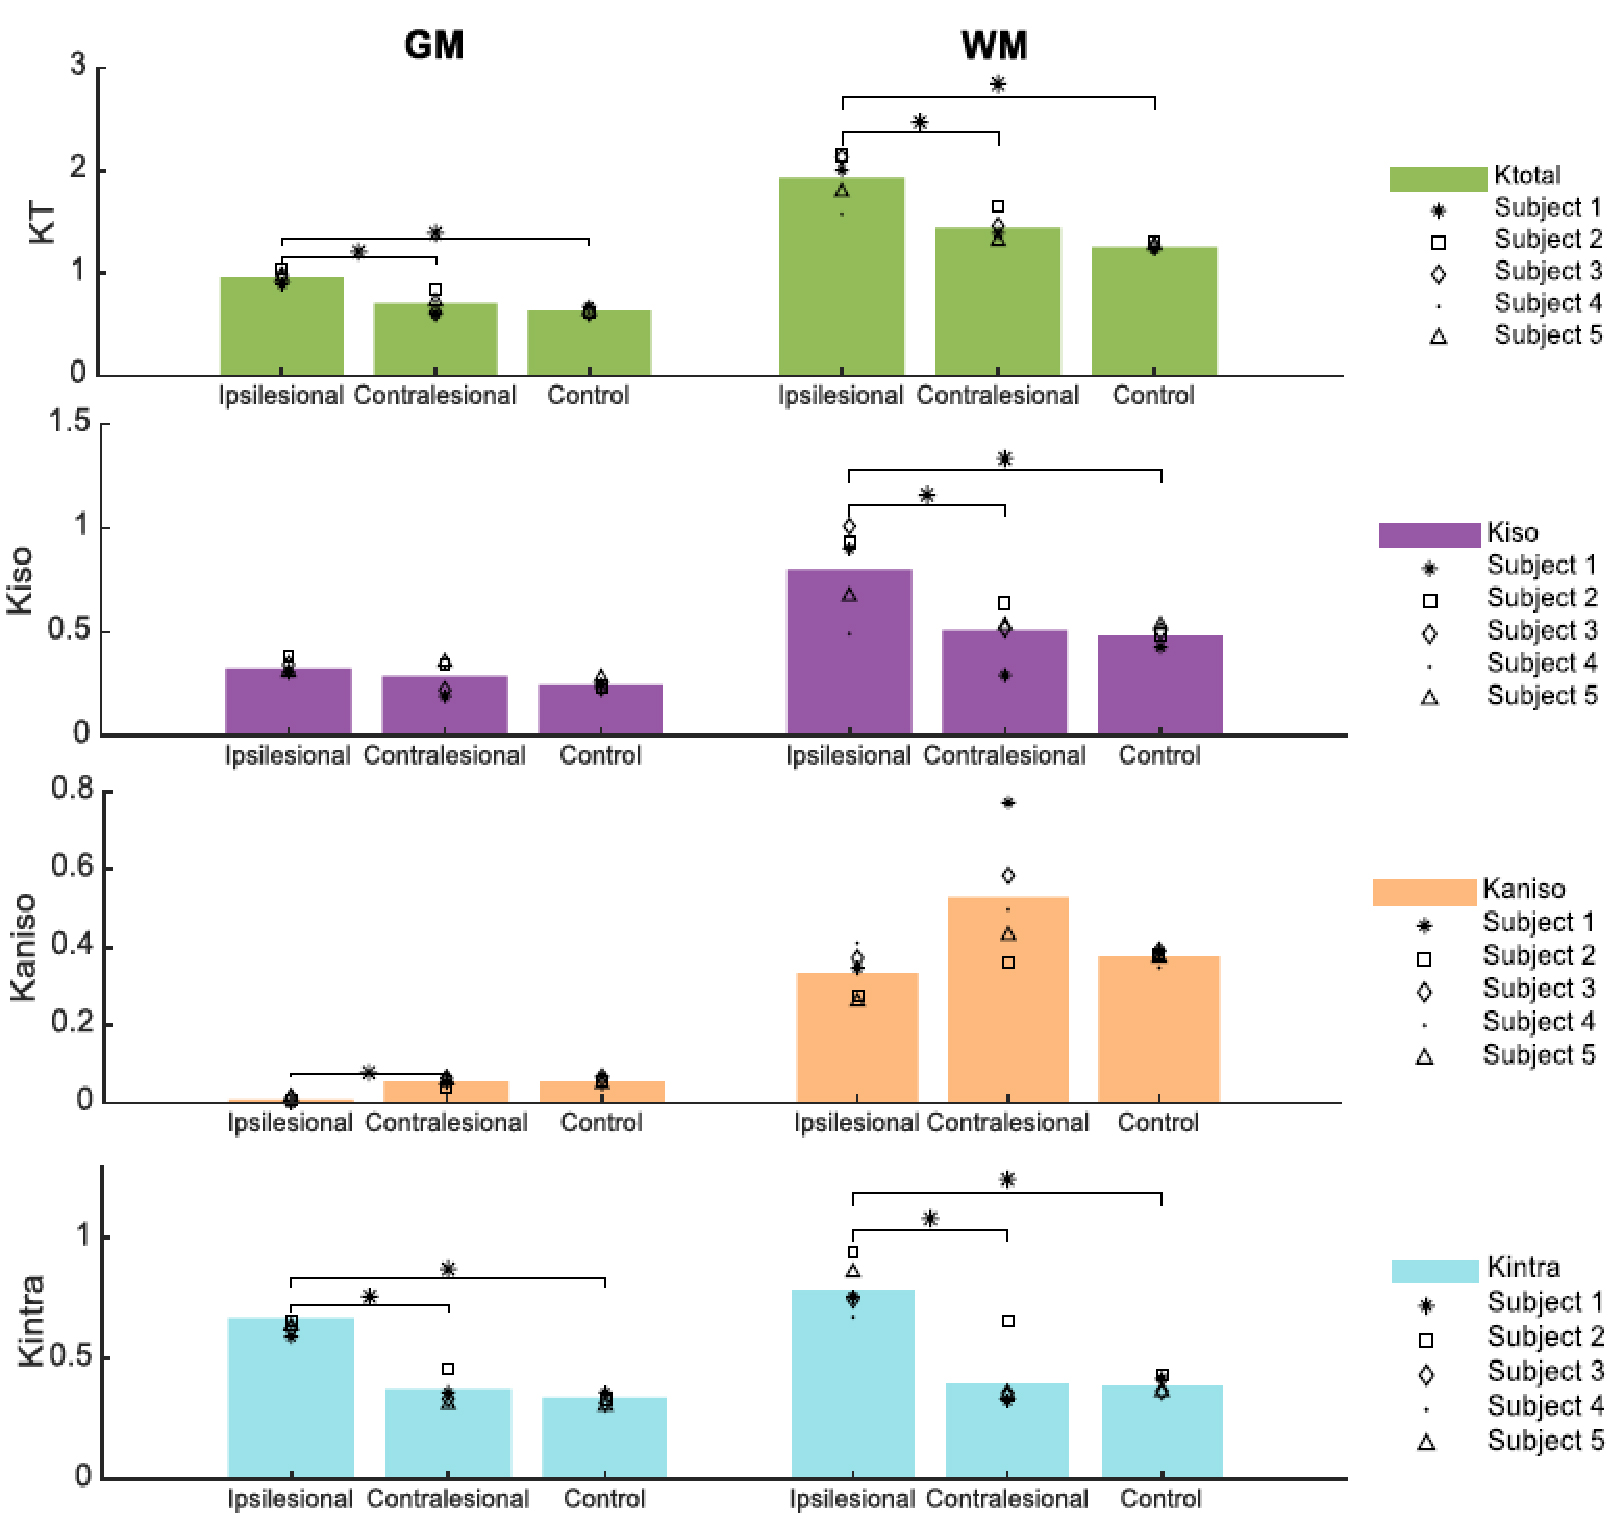
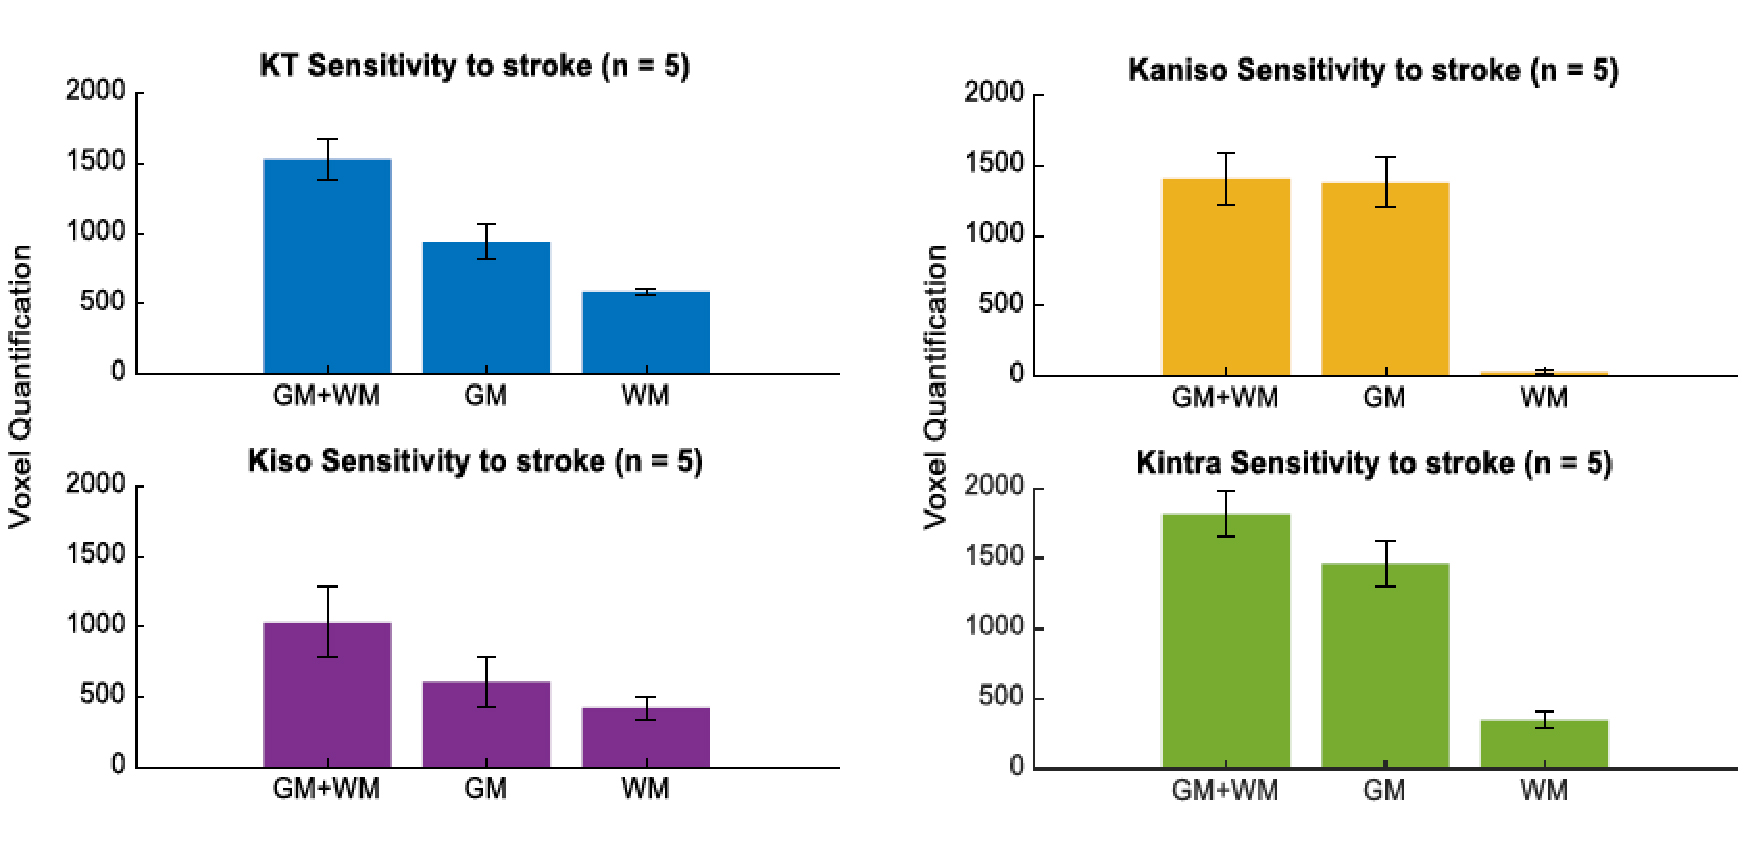
Fig.2 shows the resolved kurtosis sources for two representative animals (one for each post-stroke and sham subgroups). When comparing the post-stroke and control groups: KT and Kintra revealed mean values for both GM and WM with significant differences; Kiso presented significant differences within WM regions; Kaniso differences were shown to be significant between GM regions (p-value < 0.05) (Fig.3). Kintra revealed to be the most sensitive source to ischemic tissue (Fig.4). In vivo experiments (Fig.5) displayed qualitatively consistent results.Discussion
The observed reduction shown in MD and FA, unable to disentangle different biological underpinnings, is consistent with conventional metrics studies12,13. Given CTI’s ability to resolve kurtosis sources without underlying assumptions, we posited that it could play a role in the long-standing debate on the origins of stroke contrasts14-16. Our results show enhanced contrast at the 3h timepoint; further, the different kurtosis sources may point to different mechanisms underlying stroke. Local changes in anisotropy4, likely originating from beading effects previously suggested17,18, may be reflected in Kaniso; Edema, e.g., partial volume contribution from free water, is strongly reflected in Kiso; and increases in structural disorder and restriction are reflected in Kintra. Interestingly, the CTI-derived Kintra, was more sensitive than KT (measured in the more conventional approaches) evidencing more voxels and a larger contrast. This higher sensitivity can be attributed by the higher specificity of Kintra to biological alterations, previously suggested to be associated with disorder along extracellular space or dendrites19.Conclusion
Our CTI results can resolve microscopic tissue features ex and in vivo, which until now were obfuscated in conventional dMRI measurements. These are critical first steps towards resolving the contributions of cytotoxic and vasogenic edema sources, as well as potential for revealing salvageable tissue or ongoing excitotoxicity. Our results are promising for sensitive detection of specific microstructural changes post-ischemia, which bodes well for novel characterizations of stroke and treatment efficacy.Acknowledgements
This study was funded by the European Research Council (ERC) under the European Union’s Horizon 2020 research and innovation programme (Starting Grant, agreement No. 679058). We acknowledge the vivarium of the Champalimaud Centre for the Unknown, a facility of CONGENTO financed by Lisboa Regional Operational Programme (Lisboa 2020), project LISBOA01-0145-FEDER-022170.References
1. Thrift G, et al. Global stroke statistics. Int. J. Stroke, vol. 12, no. 1, pp. 13–32, 2017.
2. Prinz V, Endres M. Modeling Focal Cerebral Ischemia in Rodents: Introduction and Overview, vol. 120, p. 19, 2016.
3. Le Bihan D, Johansen-Berg H. Diffusion MRI at 25: Exploring brain tissue structure and function. Neuroimage, vol. 61, no. 2, pp. 324–341, 2012.
4. Henriques R N, Jespersen S N, Shemesh N. Correlation tensor magnetic resonance imaging. Neuroimage, vol. 211, 2020.
5. Watson B D, et al. Induction of reproducible brain infarction by photochemically initiated thrombosis. Ann. Neurol., vol. 17, no. 5, pp. 497–504, 1985.
6. Franklin K, Paxinos G. Paxinos and Franklin’s the Mouse Brain in Stereotaxic Coordinates, 5th ed. 2019.
7. Kerkelä L, et al. Validation and noise robustness assessment of microscopic anisotropy estimation with clinically feasible double diffusion encoding MRI. Magn. Reson. Med., pp. 1–13, 2019.
8. Veraart J, et al. Denoising of diffusion MRI using random matrix theory. NeuroImage, vol. 142, pp. 394–406, 2016.
9. Henriques R N. Advanced Methods for Diffusion MRI Data Analysis and their Application to the Healthy Ageing Brain (Cambridge University), 2018.
10. Kellner E, et al. Gibbs-ringing artifact removal based on local subvoxel-shifts. Magnetic Resonance in Medicine, vol. 76(5), pp. 1574–1581, 2016.
11. Guizar-Sicairos M, Thurman S T, Fienup J R. Efficient subpixel image registration algorithms. Optics Letters, vol. 33(2), pp. 156–158, 2008.
12. Helpern J, et al. Histopathological correlations of nuclear magnetic resonance imaging parameters in experimental cerebral ischemia. Magnetic Resonance Imaging, vol. 11(2), pp. 241–246, 1993.
13. Jiang Q, et al. The temporal evolution of MRI tissue signatures after transient middle cerebral artery occlusion in rat. Journal of the Neurological Sciences, vol. 145(1), pp. 15–23, 1997
14. Moseley M E, et al. Early detection of regional cerebral ischemia in cats: Comparison of diffusion‐ and T2‐weighted MRI and spectroscopy. Magnetic Resonance in Medicine, vol. 14(2), pp. 330–346, 1990.
15. Van Der Toorn A, et al. Dynamic changes in water ADC, energy metabolism, extracellular space volume, and tortuosity in neonatal rat brain during global ischemia. Magnetic Resonance in Medicine, vol. 36(1), pp. 52–60, 1996.
16. Budde M D, Frank J A. Neurite beading is sufficient to decrease the apparent diffusion coefficient after ischemic stroke. Proceedings of the National Academy of Sciences of the United States of America, vol. 107(32), pp. 14472–14477, 2010.
17. Hui E S, et al. Stroke assessment with diffusional kurtosis imaging. Stroke, vol. 43(11), pp. 2968–2973, 2012.
18. Novikov D, et al. Revealing mesoscopic structural universality with diffusion. Proceedings of the National Academy of Sciences, vol. 111(14), pp. 5088–5093, 2014.
19. Lee H H, et al. In vivo observation and biophysical interpretation of time-dependent diffusion in human cortical gray matter. NeuroImage, vol. 222, pp. 117054, 2020.
Figures