0402
b-M1-Optimized Waveforms for Improved Stability of Quantitative Intravoxel Incoherent Motion DWI1Radiology, University of Wisconsin-Madison, Madison, WI, United States, 2Medical Physics, University of Wisconsin-Madison, Madison, WI, United States, 3Biomedical Engineering, University of Wisconsin-Madison, Madison, WI, United States
Synopsis
Multiple studies have demonstrated the potential utility of intravoxel incoherent motion (IVIM) DWI in the evaluation of liver disease. However, IVIM estimates obtained using conventional monopolar diffusion gradient waveforms often suffer from high variability and instability. In this work, Cramer-Rao lower bound (CRLB) optimization was performed to determine the optimal sampling of b-M1-space based on noise performance. Then, based on this optimized sampling, b-M1-optimized waveforms were designed and employed in order to obtain IVIM estimates with improved stability in the right lobe of the liver in volunteers in comparison to conventional monopolar waveforms.
Introduction
Multiple studies have demonstrated the potential utility of intravoxel incoherent motion (IVIM) DWI in the evaluation of liver disease, including hepatocellular carcinoma,1-3 fibrosis,1,4,5 hepatitis,6 and fatty liver disease.7,8 However, IVIM acquisitions using conventional monopolar diffusion gradient waveforms lead to high variability when attempting to fit bi-exponential IVIM signal models. This variability is due to the instability associated with separating two decaying signal components sampled along a single dimension (i.e., b-value). It is hypothesized that controlled sampling along two dimensions (b-value and first-moment motion sensitivity (M1)) may enable dramatically improved stability in IVIM fitting. Therefore, the purpose of this work was to develop b-M1-optimized waveforms in order to obtain stable IVIM estimates.Methods
CRLB Optimization: Cramer-Rao lower bound (CRLB) optimization was performed based on the generalized physical IVIM signal model proposed by Ahlgren et al.10$$S(b,M_1)=S_0[(1-F)e^{-bD}+Fe^{-bD_b}e^{-M_1^2V_b^2}],\quad Eq.(1)$$
where D is diffusion coefficient, F is perfusion fraction, Vb is capillary blood velocity which is related to the pseudo-diffusion coefficient $$$D^*=D+M_1^2V_b^2/b$$$, and Db is the diffusivity of blood (1.75x10⁻³ mm2/s). Optimal data sampling of the joint b-M1-space was determined by minimizing the following equation
$$\theta =\underset{\theta \in \varphi }{\operatorname{argmin}}\quad max[(\frac{std(D)}{D_{true}})^2+(\frac{std(F)}{F_{true}})^2+(\frac{std(V_b)}{V_{b,true}})^2|_{(D,F,V_b)\in \Omega}],\quad Eq.(2)$$
where $$$\varphi$$$ is a constraint space defined by the scanner hardware and $$$\Omega$$$ is the parameter space being optimized. The optimal sampling of the b-M1-space was determined for an SNR of 20 and an $$$\Omega$$$ containing 490 combinations of D$$$\in$$$(0.6, 1.8)x10-3 mm2/s, F$$$\in$$$(12, 30)%, and Vb$$$\in$$$(0.7, 3.4)mm/s.
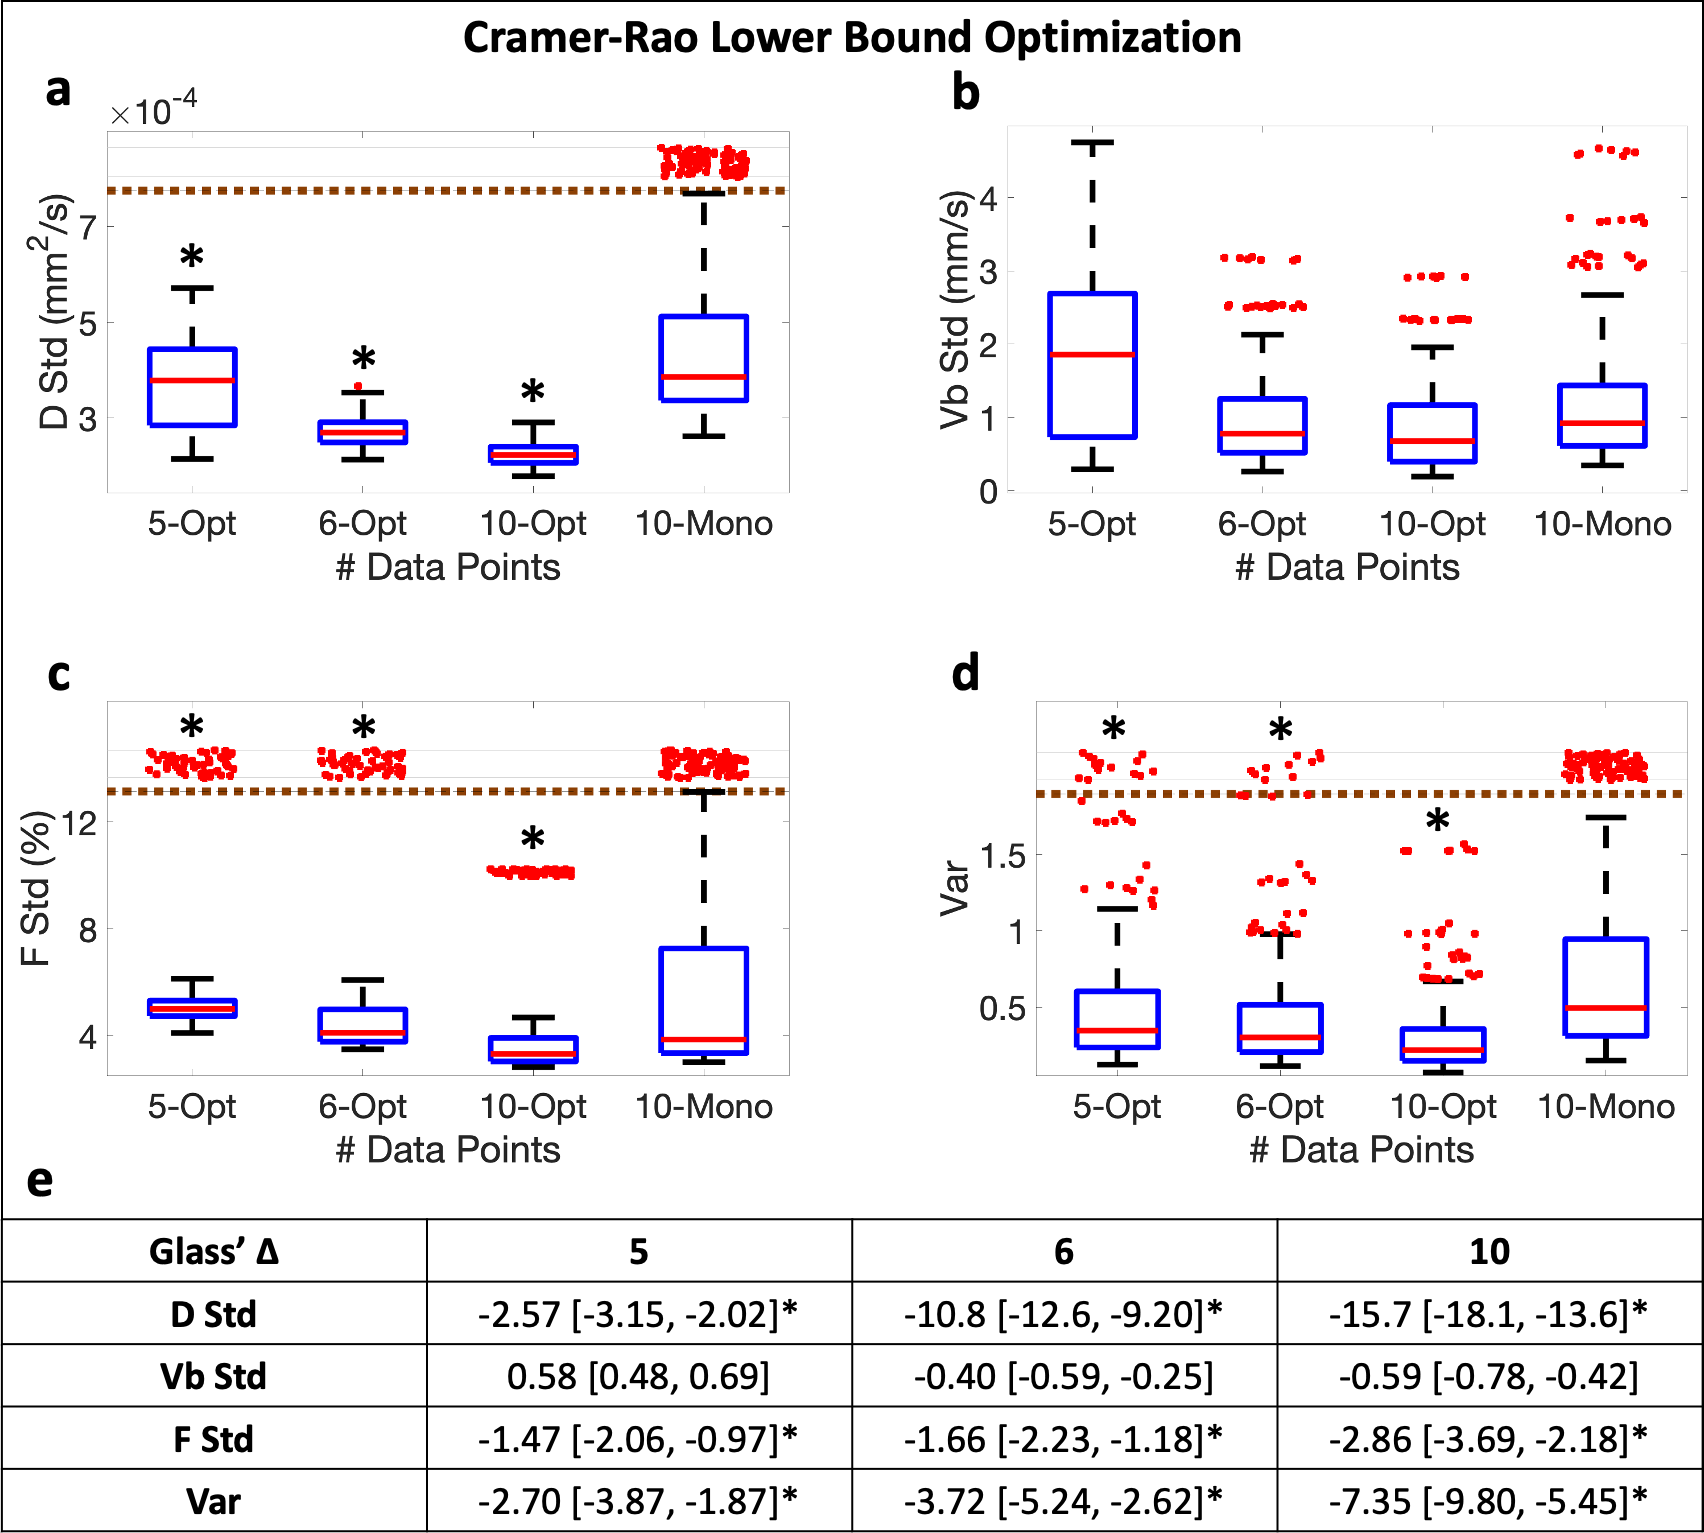
The effect size statistic Glass’ ∆11,12 was used to determine if the grouped var and standard deviations (stds) of D, F, and Vb were significantly different (|∆|>0.8) across the combinations for the b-M1-optimized sampling in comparison to the conventional monopolar sampling.
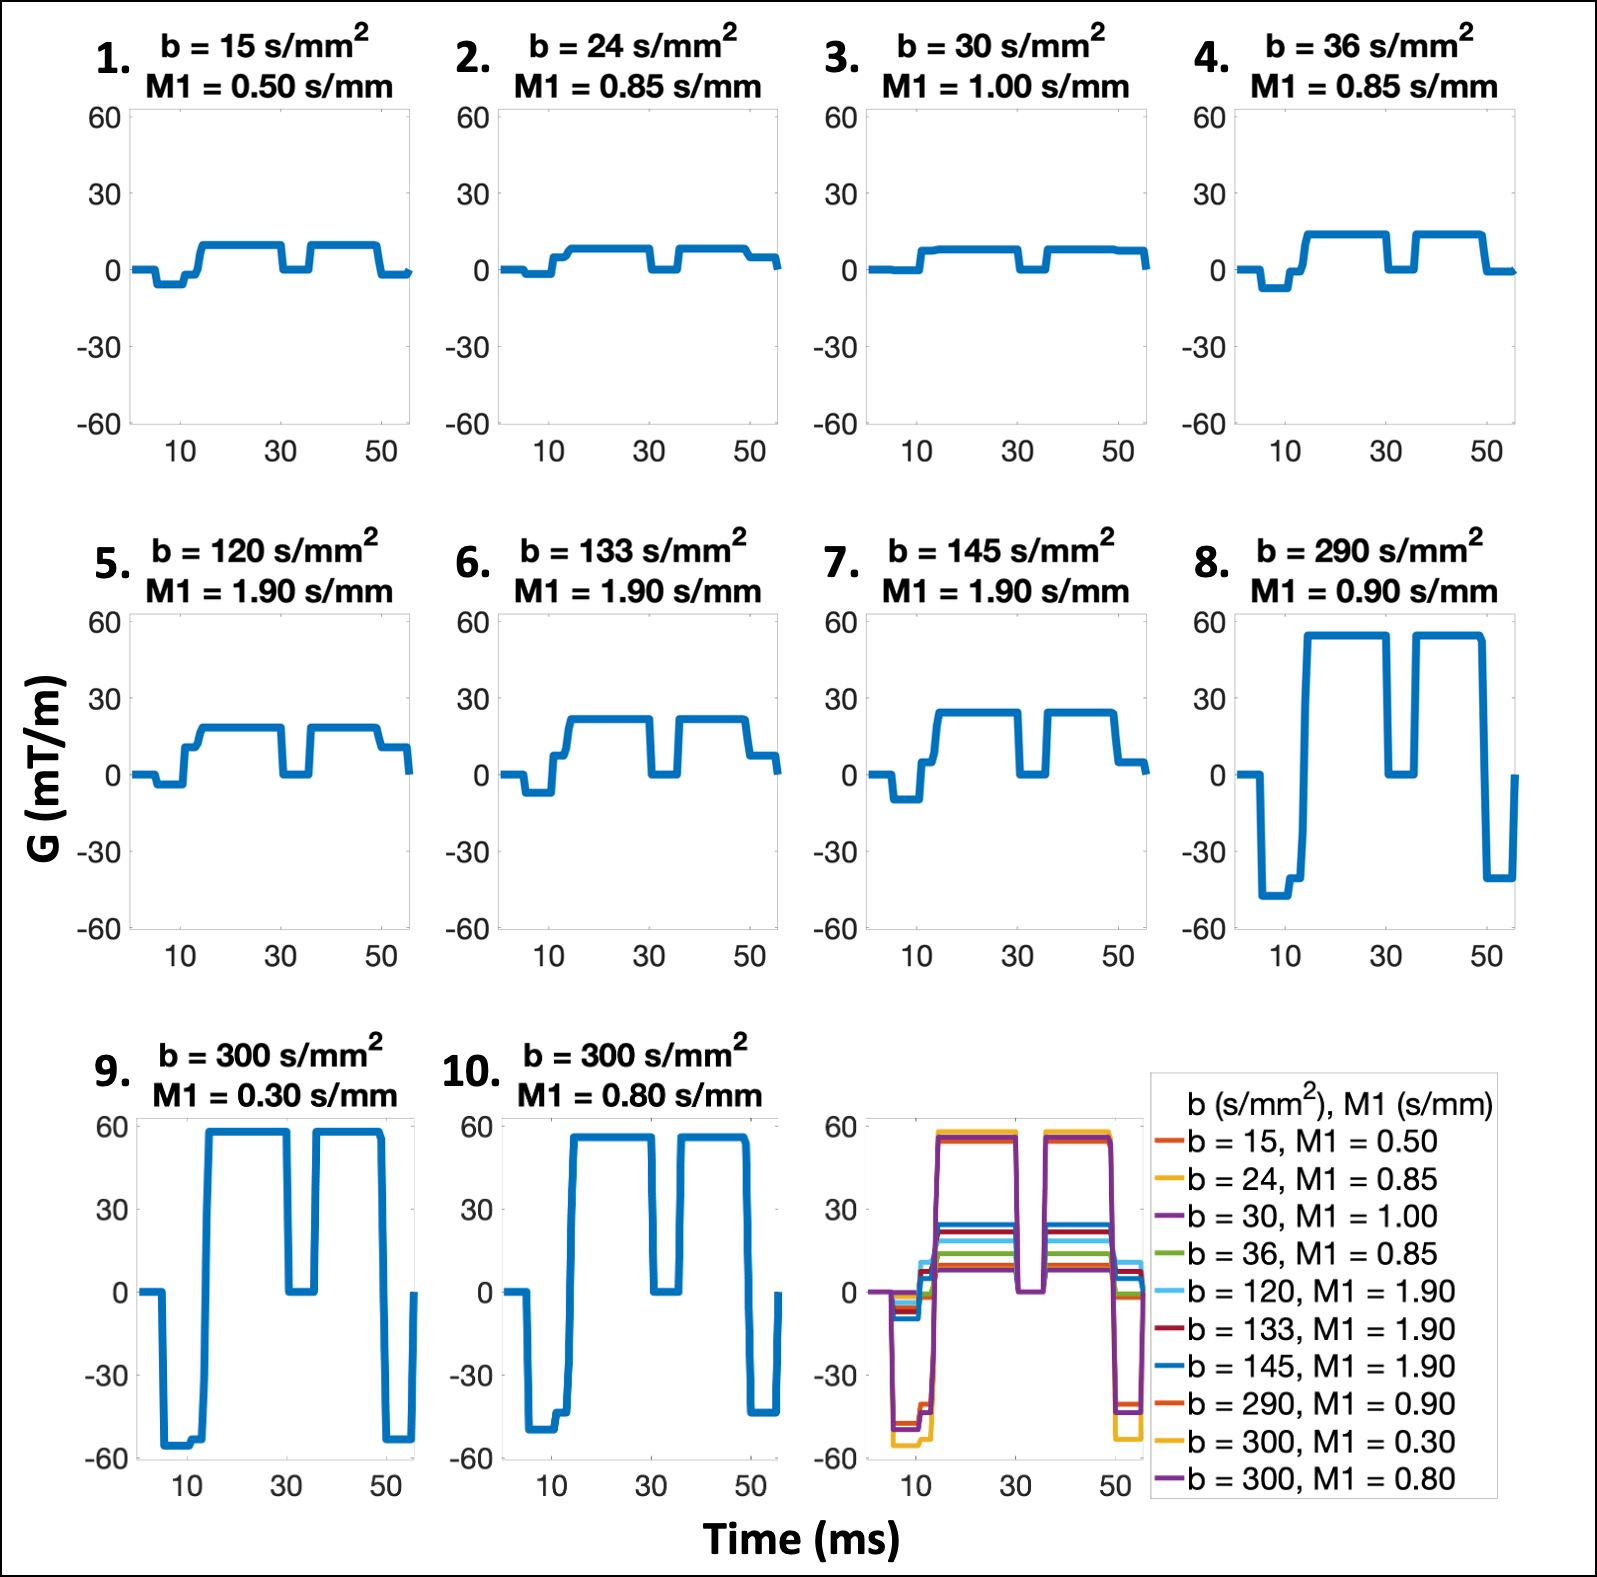
Next, b-M1-optimized waveforms were designed for the b-M1-optimized sampling using a modification of a previously published procedure,9 which combines monopolar and M1-nulled gradient waveforms to simultaneously control b and M1.
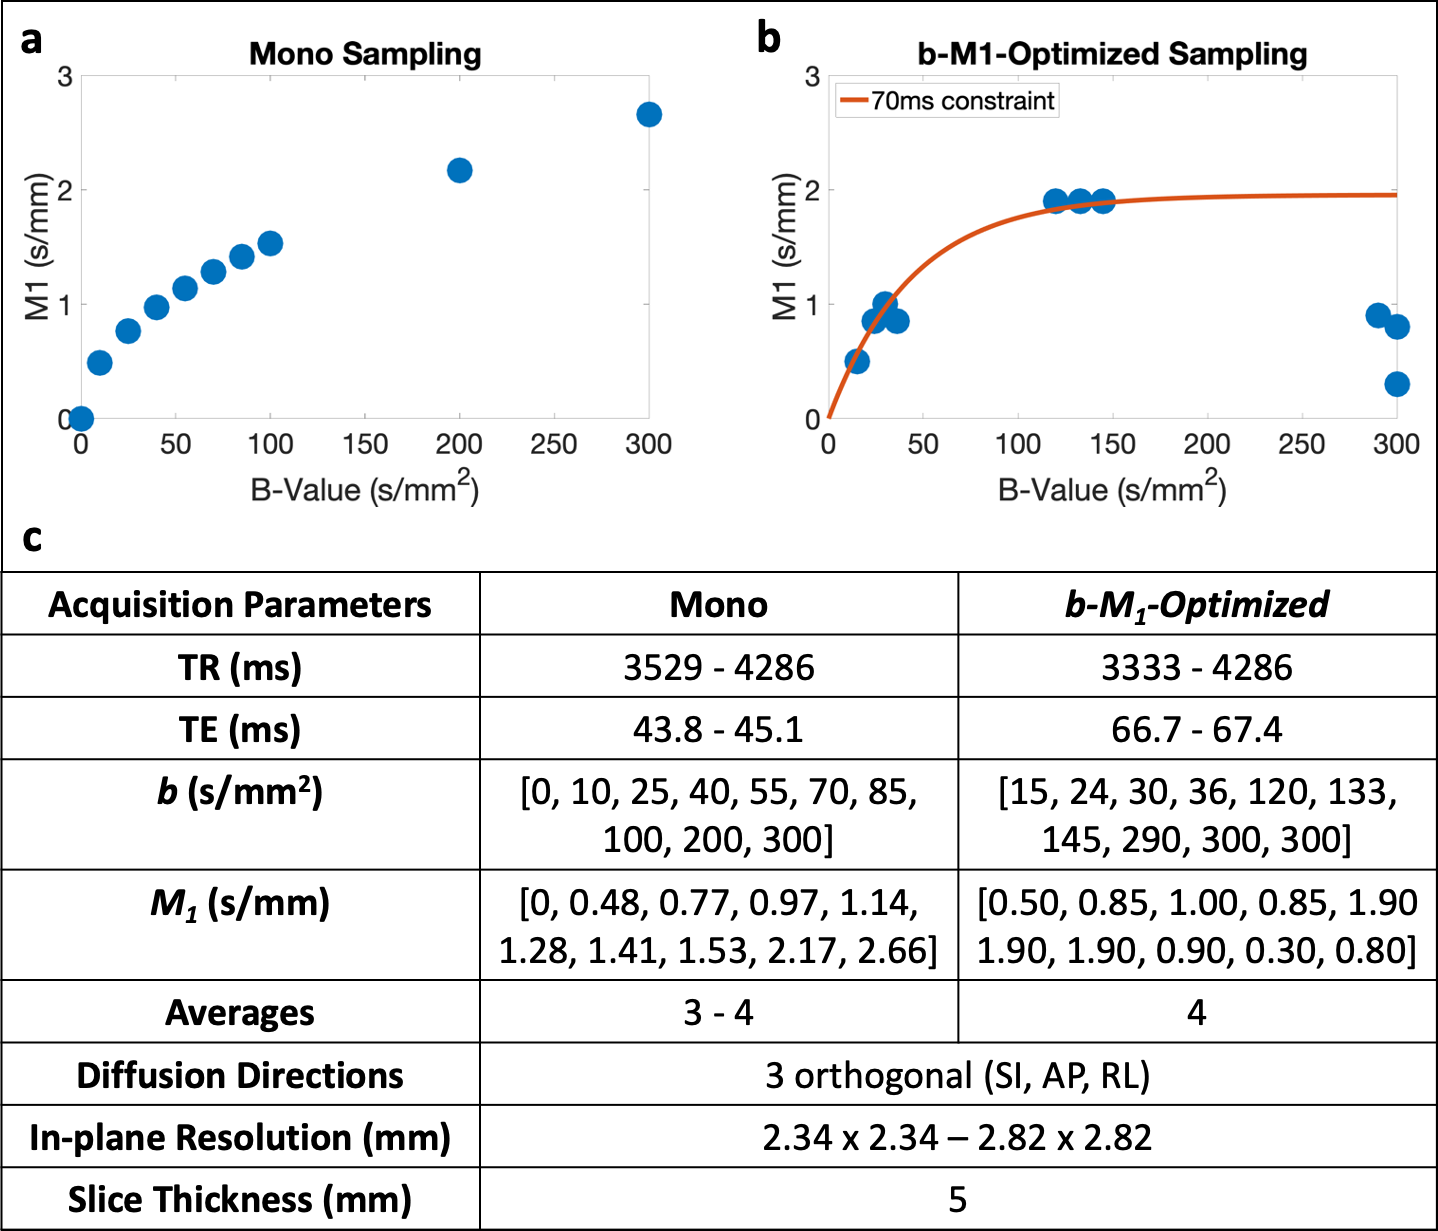
MR acquisition: With IRB approval and informed consent, five (n=5) volunteers underwent MR imaging (3T Signa Premier, GE Healthcare). Conventional monopolar IVIM data sampling (Figure 1a) and b-M1-optimized IVIM sampling (Figure 1b) were obtained in the liver. Both sampling patterns were acquired using respiratory triggering and the parameters in Figure 1c.
Data analysis: Estimates of S0, D, F, and Vb were obtained on a voxel-by-voxel basis for both the monopolar and b-M1-optimized datasets using a uniform 3x3 filter, followed by non-linear least squares fitting of Eq.(1) (Matlab, MathWorks). For the b-M1-optimized datasets, estimates were obtained using all ten sampled data points (waveforms), as well as subsets of five and six data points (Figure 2) that were determined to be optimal based on CRLB simulation.
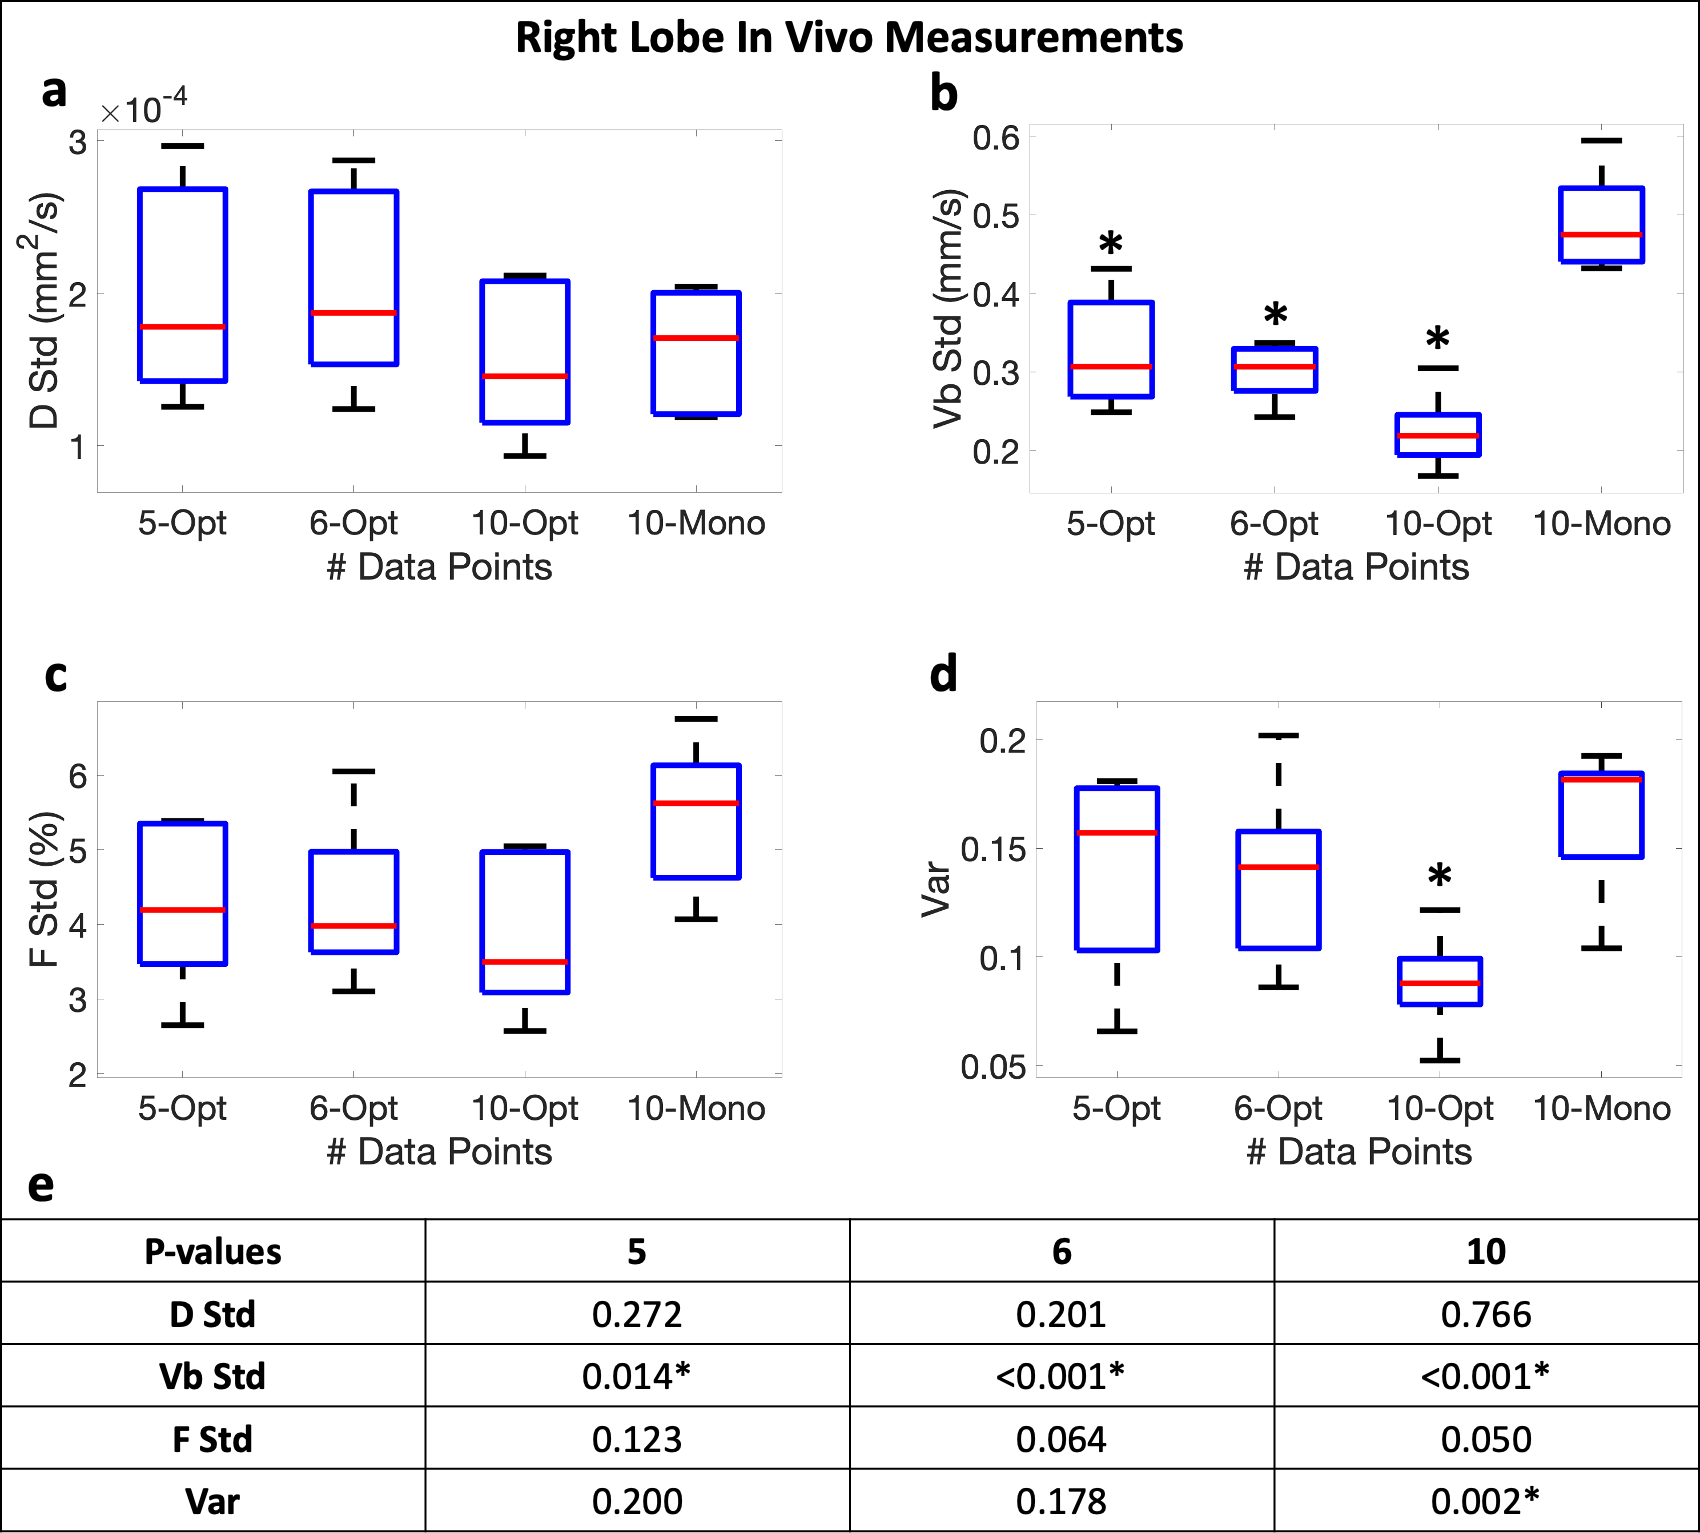
For each subject and sampling pattern, averages and stds of D, F, and Vb were determined using regions-of-interest placed in each of the four right liver lobe segments (segments 5-8). Similar to Eq.(2), var was calculated as a measure of noise performance for each set of measurements using the averages instead of true values. Paired sample t-tests were performed (significance level ⍺=0.05) to compare the stds and var between monopolar and b-M1-optimized IVIM sampling.
Results
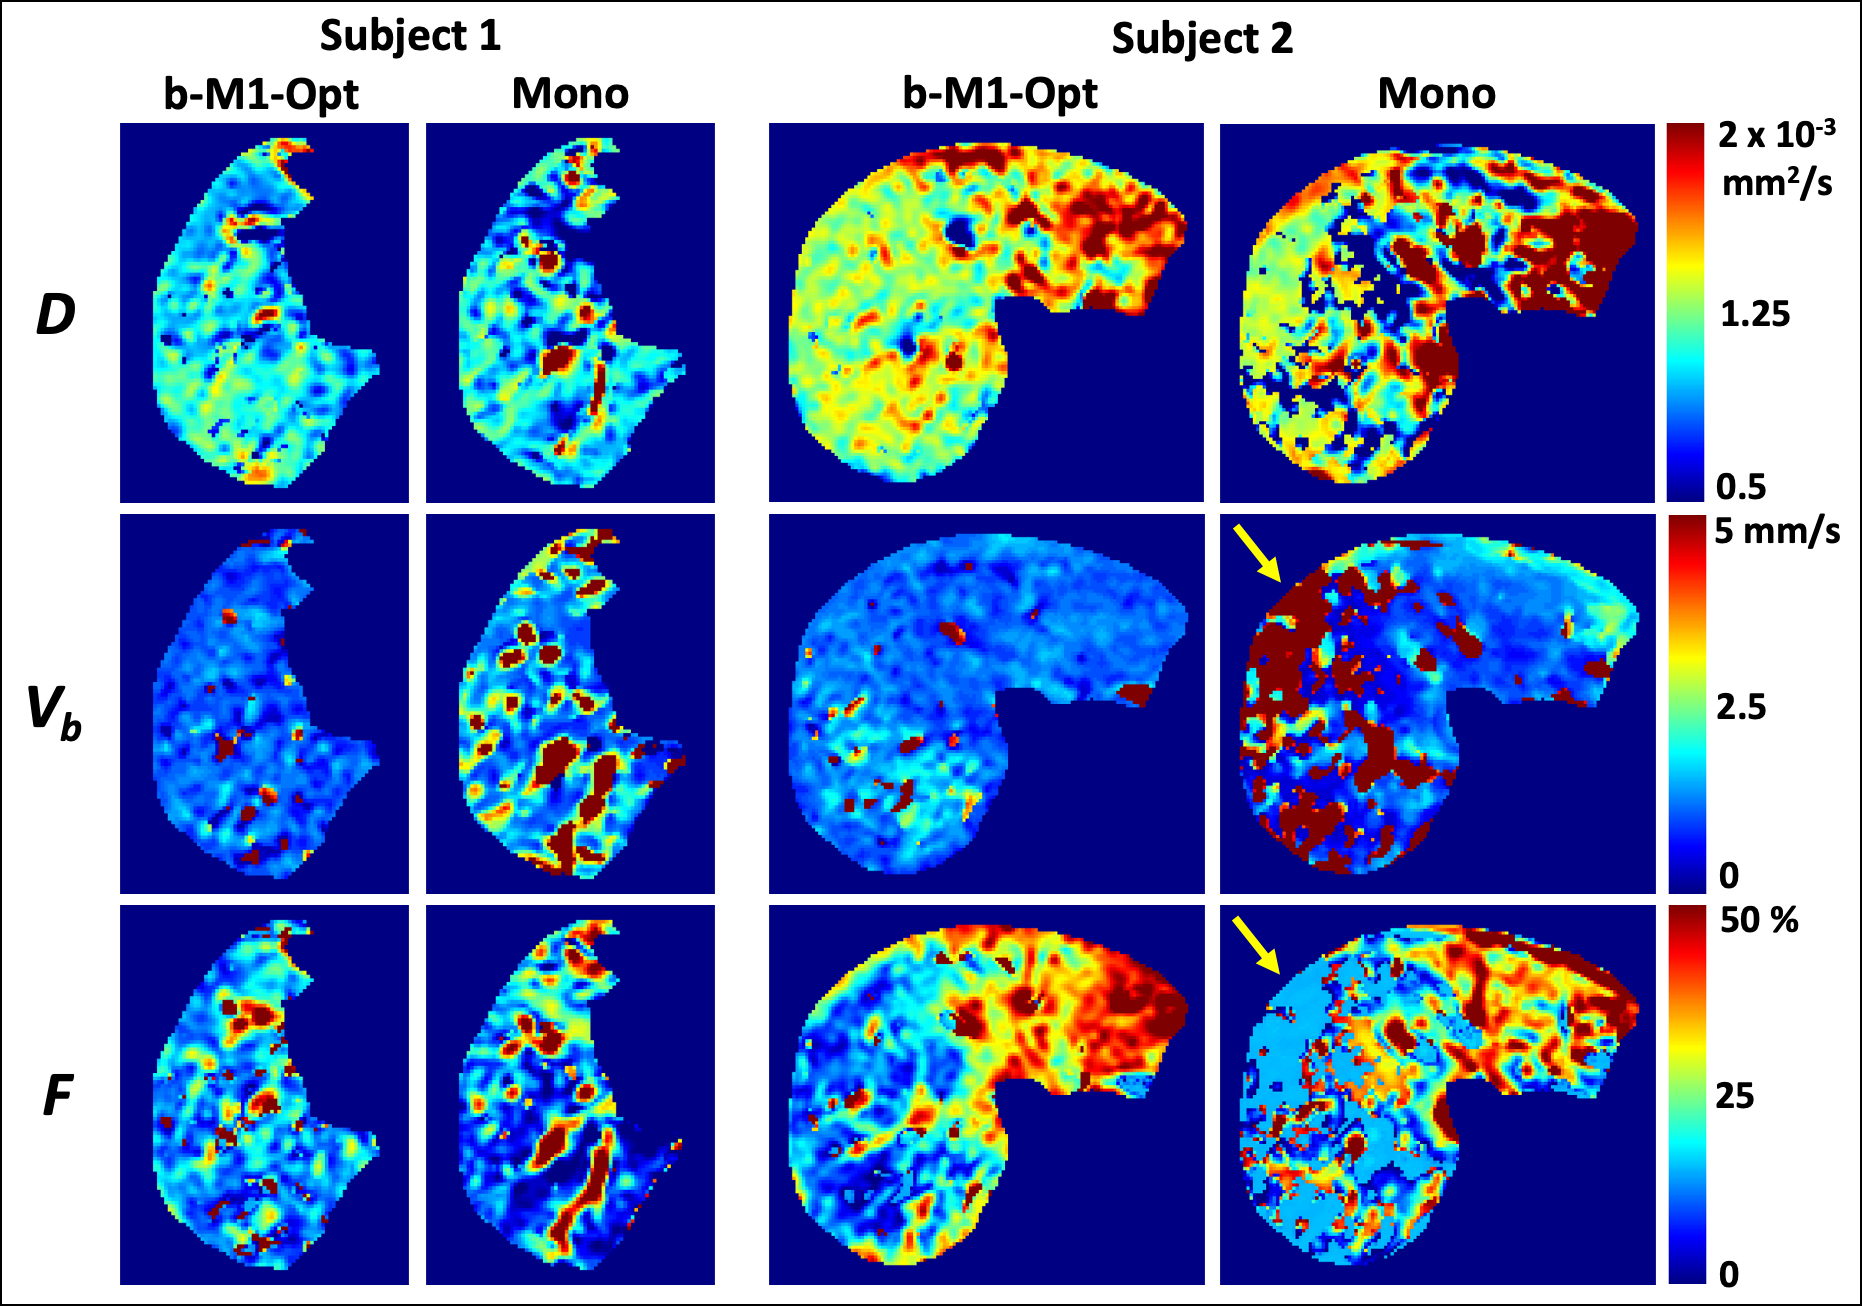
Figure 1 displays the monopolar gradient and b-M1-optimized data samplings in b-M1-space for ten data points (b-M1-optimized waveforms given in Figure 2). For the five-, six-, and ten-point b-M1-optimized samplings, CRLB simulation showed significant decreases (|∆|>0.8) in DStd, FStd, and var in comparison to the ten-point monopolar sampling (Figure3a,c,d,e).For the in vivo measurements, significant decreases (p<0.05) in Vb,Std were observed for the five-, six-, and ten-point b-M1-optimized samplings (Figure 4b,e), as well as a significant decrease in var for the ten-point b-M1-optimized sampling (Figure 4d,e). Although not significant, decreases in FStd were also observed (p=0.123, 0.064, and 0.050 for the five-, six-, and ten-point b-M1-optimized samplings, respectively; Figure 4c,e). Representative parametric maps of D, F, and Vb for the monopolar and ten-point b-M1-optimized samplings for two subjects are provided in Figure 5.
Discussion and Conclusion
In this work, b-M1-optimized waveforms for IVIM quantification were designed, enabling substantially more stable IVIM estimates and parametric mapping, including Vb and F.This approach may have applications for diffuse and focal liver disease, where IVIM has demonstrated promise.1-8 Further, the proposed methodology may be applicable in other organs, such as prostate, where D and D* are relatively similar,13-16 making separating the two components from monopolar acquisitions inherently challenging.
Although previous works have explored the use of various waveforms for IVIM quantification,10,17,18 these waveforms didn’t allow two-dimensional control of the IVIM acquisition (i.e., b-M1-sampling). Taking advantage of recently proposed b-M1-controlled waveforms,9 this work formulates the IVIM acquisition as an optimization problem to maximize the stability of the IVIM estimates given a limited number of controlled samples (i.e., enabling a moderate scan time).
Limitations of this early-stage work include the evaluation of the proposed method in a small number (n=5) of healthy volunteers. Further, comparisons across a wider range of IVIM acquisitions (including monopolar acquisitions with higher b-values (>300 s/mm2)) are needed as future work.
In conclusion, by formulating the IVIM acquisition using an optimization framework for the corresponding diffusion and flow-encoding waveforms, this work may advance the area of quantitative IVIM DWI towards fulfilling its considerable potential in liver imaging and other applications.
Acknowledgements
Support for this research was provided by the University of Wisconsin - Madison Office of the Vice Chancellor for Research and Graduate Education with funding from the Wisconsin Alumni Research Foundation, as well as from the UW Departments of Radiology and Medical Physics. Also, GE Healthcare provides research support to the University of Wisconsin-Madison.References
1. Li, Y.T., et al., Liver intravoxel incoherent motion (IVIM) magnetic resonance imaging: a comprehensive review of published data on normal values and applications for fibrosis and tumor evaluation. Quantitative imaging in medicine and surgery, 2017. 7(1): p. 59.
2 Wu, H., et al., Meta-analysis of intravoxel incoherent motion magnetic resonance imaging in differentiating focal lesions of the liver. Medicine, 2018. 97(34).
3. Peng, J., et al., Intravoxel incoherent motion diffusion-weighted imaging to differentiate hepatocellular carcinoma from intrahepatic cholangiocarcinoma. Scientific Reports, 2020. 10(1): p. 1-7.
4. Tosun, M., et al., Intravoxel incoherent motion imaging for diagnosing and staging the liver fibrosis and inflammation. Abdominal Radiology, 2020. 45(1): p. 15-23.
5. Zhang, B., et al., Intravoxel incoherent motion MR imaging for staging of hepatic fibrosis. PloS one, 2016. 11(1): p. e0147789.
6. Ding, L., et al., Intravoxel Incoherent Motion (IVIM) Diffusion-Weighted Imaging (DWI) in Patients with Liver Dysfunction of Chronic Viral Hepatitis: Segmental Heterogeneity and Relationship with Child-Turcotte-Pugh Class at 3 Tesla. Gastroenterology research and practice, 2018. 2018.
7. Shin, H.J., et al., Liver intravoxel incoherent motion diffusion-weighted imaging for the assessment of hepatic steatosis and fibrosis in children. World journal of gastroenterology, 2018. 24(27): p. 3013.
8. Guiu, B., et al., Intravoxel incoherent motion diffusion-weighted imaging in nonalcoholic fatty liver disease: a 3.0-T MR study. Radiology, 2012. 265(1): p. 96-103.
9. Zhang, Y., et al., Motion‐robust and blood‐suppressed M1‐optimized diffusion MR imaging of the liver. Magnetic resonance in medicine, 2019. 82(1): p. 302-311.
10. Ahlgren, A., et al., Quantification of microcirculatory parameters by joint analysis of flow‐compensated and non‐flow‐compensated intravoxel incoherent motion (IVIM) data. NMR in Biomedicine, 2016. 29(5): p. 640-649.
11. Glass, G.V., Primary, secondary, and meta-analysis of research. Educational researcher, 1976. 5(10): p. 3-8.
12. Sullivan, G.M. and R. Feinn, Using effect size—or why the P value is not enough. Journal of graduate medical education, 2012. 4(3): p. 279-282.
13. Pesapane, F., et al., Intravoxel incoherent motion (IVIM) diffusion weighted imaging (DWI) in the periferic prostate cancer detection and stratification. Medical Oncology, 2017. 34(3): p. 35.
14. Valerio, M., et al., 3T multiparametric MRI of the prostate: Does intravoxel incoherent motion diffusion imaging have a role in the detection and stratification of prostate cancer in the peripheral zone? European journal of radiology, 2016. 85(4): p. 790-794.
15. Kuru, T.H., et al., Intravoxel incoherent motion (IVIM) diffusion imaging in prostate cancer-what does it add? Journal of computer assisted tomography, 2014. 38(4): p. 558-564.
16. Shinmoto, H., et al., An intravoxel incoherent motion diffusion-weighted imaging study of prostate cancer. American Journal of Roentgenology, 2012. 199(4): p. W496-W500.
17. Aliotta, E., H.H. Wu, and D.B. Ennis, Convex optimized diffusion encoding (CODE) gradient waveforms for minimum echo time and bulk motion–compensated diffusion‐weighted MRI. Magnetic resonance in medicine, 2017. 77(2): p. 717-729.
18. Wetscherek, A., B. Stieltjes, and F.B. Laun, Flow‐compensated intravoxel incoherent motion diffusion imaging. Magnetic resonance in medicine, 2015. 74(2): p. 410-419.
Figures