0391
Deep learning-based thoracic cavity segmentation for hyperpolarized 129Xe MRI1Biomedical Engineering, Duke University, Durham, NC, United States, 2Medical Physics, Duke University, Durham, NC, United States, 3Radiology, Duke University, Durham, NC, United States, 4Bioengineering, McGill University, Montréal, QC, Canada, 5Mechanical Engineering and Materials Science, Duke University, Durham, NC, United States
Synopsis
Quantifying hyperpolarized 129Xe MRI of pulmonary ventilation and gas exchange requires accurate segmentation of the thoracic cavity. This is typically done either manually or semi-automatically using an additional proton scan volume-matched to the gas image. These methods are prone to operator subjectivity, image artifacts, alignment/registration issues, and SNR. Here we demonstrate using a 3D convolutional neural network (CNN) to automatically and directly delineate the thoracic cavity from 129Xe MRI alone. This 3D-CNN uses a combination of Dice-Focal, perceptual loss, and training with template-based data augmentation to demonstrate thoracic cavity segmentation with a Dice score of 0.955 vs. expert readers.
Introduction
Hyperpolarized 129Xe MRI is increasingly used in 3D imaging of ventilation and gas exchange1. However, quantification of these images relies on accurate delineation of the subject’s thoracic cavity. This typically uses a separate breath-hold 1H image that is segmented and registered to the functional scan2. Nevertheless, these additional images take additional time to acquire, may not be well-matched to the lung inflation volume of the 129Xe scan, or may simply be unavailable. Moreover, performing segmentations takes time and training, which is a primary cause of inter-analyst variability. Therefore, it is highly desirable to derive a high-quality thoracic cavity mask from the 129Xe MRI scan alone. This task is particularly challenging because the lung boundary we are seeking to delineate from 129Xe MRI is often adjacent to the most prominent ventilation defects. Here, we demonstrate a 3D convolutional neural network (CNN), trained on expert segmentations of both 1H and 129Xe images, that reliably delineates the thoracic cavity from only the 129Xe MRI scan.Methods
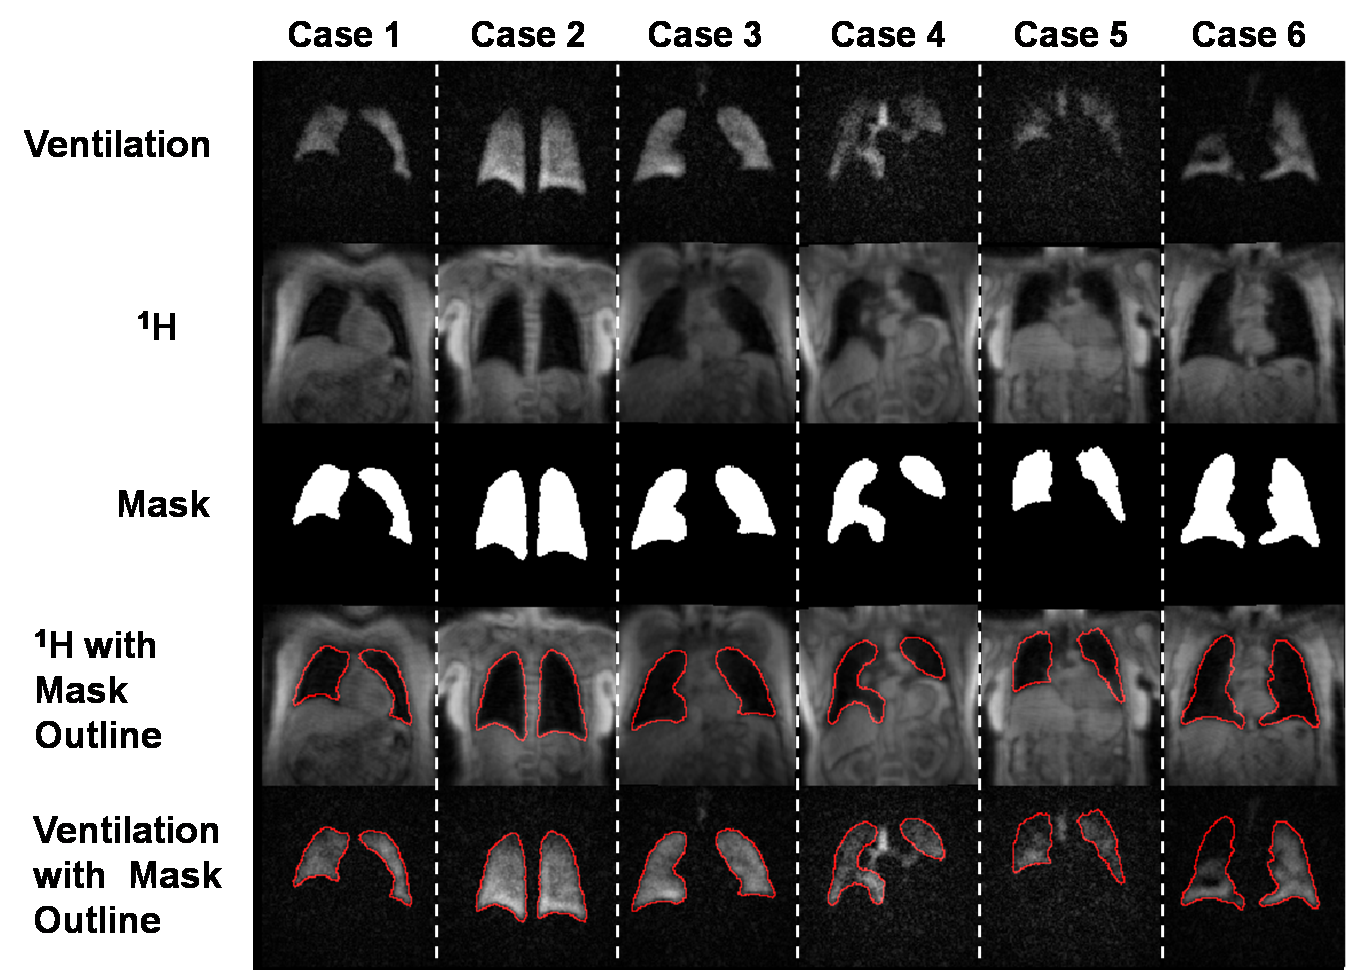
Dataset generation:Our study used 232 image datasets that included 3D radial acquisitions of both 129Xe ventilation and 1H thoracic cavity anatomy. The 1H images were segmented by expert readers to generate thoracic cavity masks. These data were divided into 185 sets for training and 47 for validation. Final testing of the 3D-CNN was done using an additional 33 “pristine” datasets where masks were generated by expert readers who segmented the ventilation images while using the 1H images as a reference. Because the training data predominantly contained subjects with minor or no defects, and because severe defects provide the largest segmentation challenge, this pool was increased by template augmentation3 to create a more balanced dataset. Representative expert reader segmentations for the training data are shown in Fig 1, which provides both the 129Xe ventilation and registered 1H thoracic cavity images as well as the superposed segmentation outline used to visually confirm accuracy.
Model architecture:
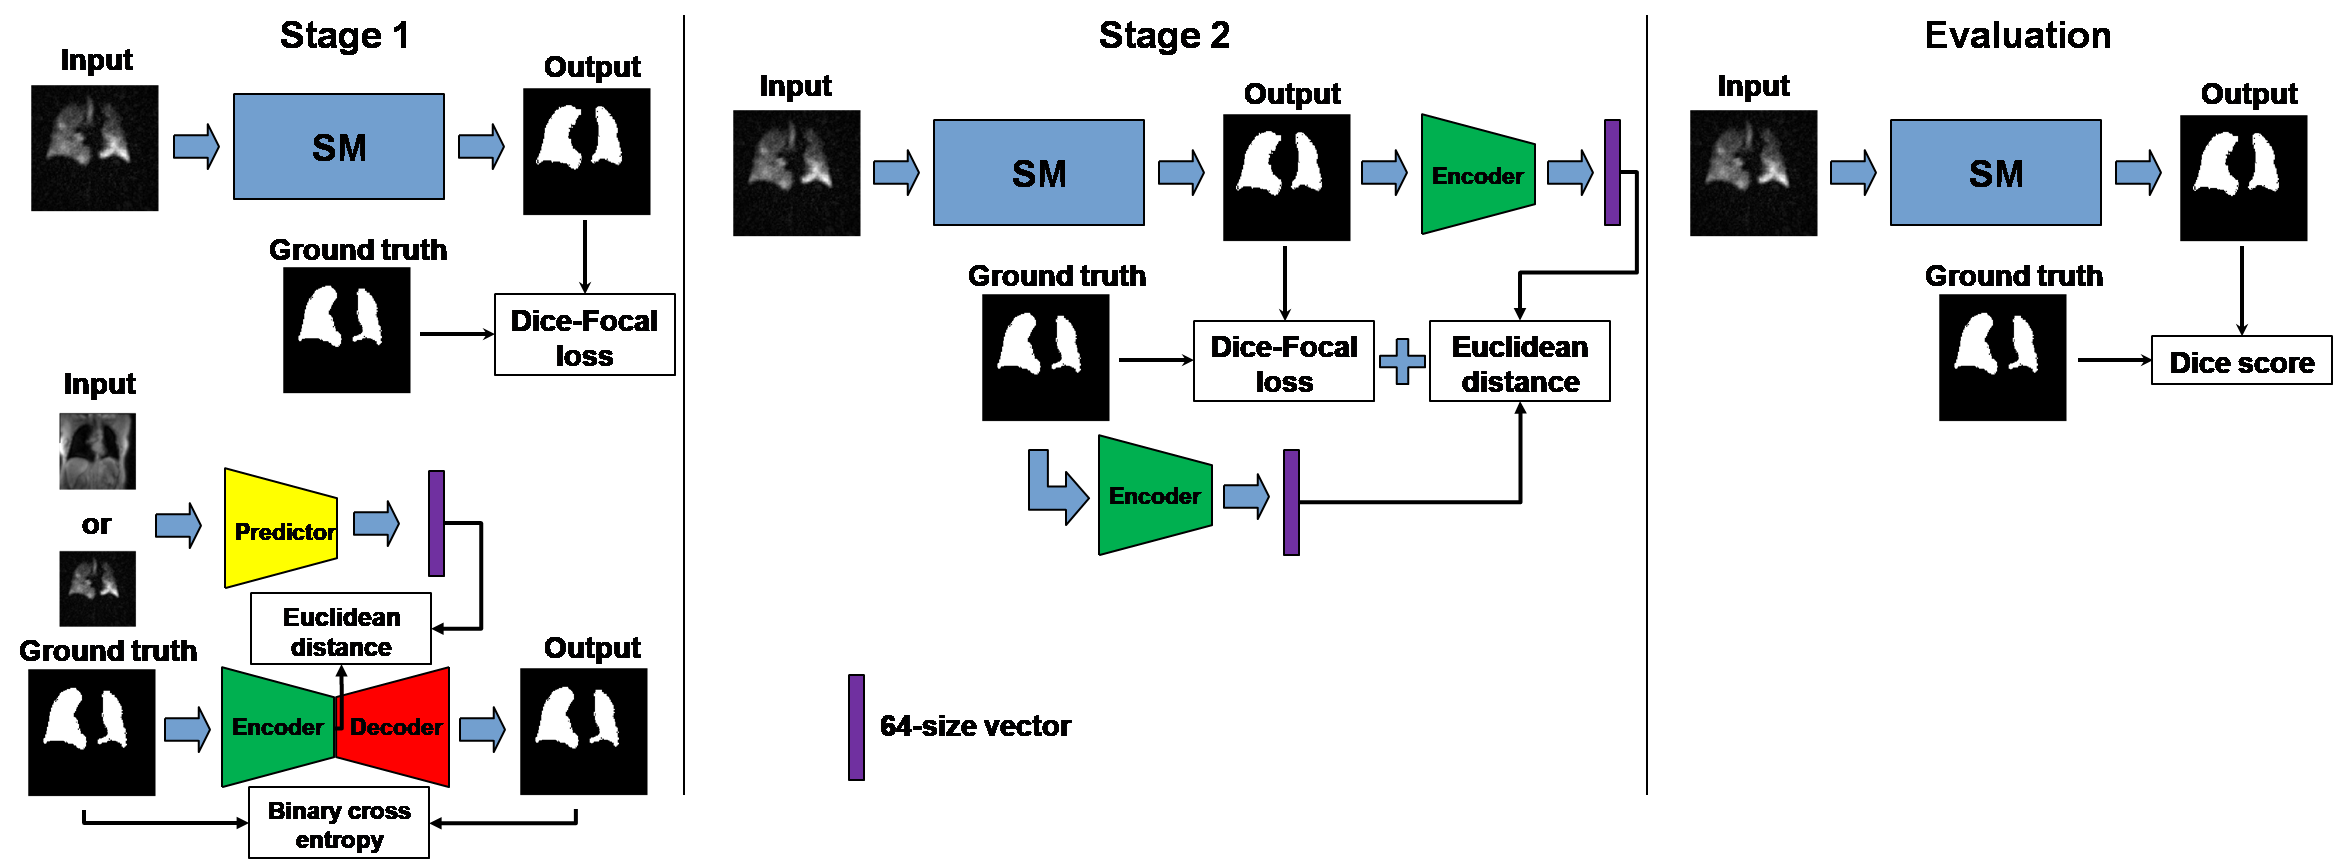
Model training consisted of two key modules. The first was a basic segmentation model (SM) underlying all models described here and adapted from the V-Net for medical image segmentation4; however, each model differed in the specifics of their training. The second was a perceptual loss model which consists of an encoder-decoder model (EDM) and a predictor model (PM) similar to Anatomically Constrained Neural Networks (ACNNs)5. The PM structure was similar to that of the EDM encoder. Each model was trained separately, and upon the convergence of loss, were combined and trained simultaneously as shown in Fig 2.
Loss:
The segmentation model was first trained using Dice-Focal loss ( LDice & Lfocal ), followed by a perceptual loss function Lperc. The total loss function is given by:
$$$L_{tot}=L_{Dice}+0.1*L_{focal}+0.001*L_{perc}$$$
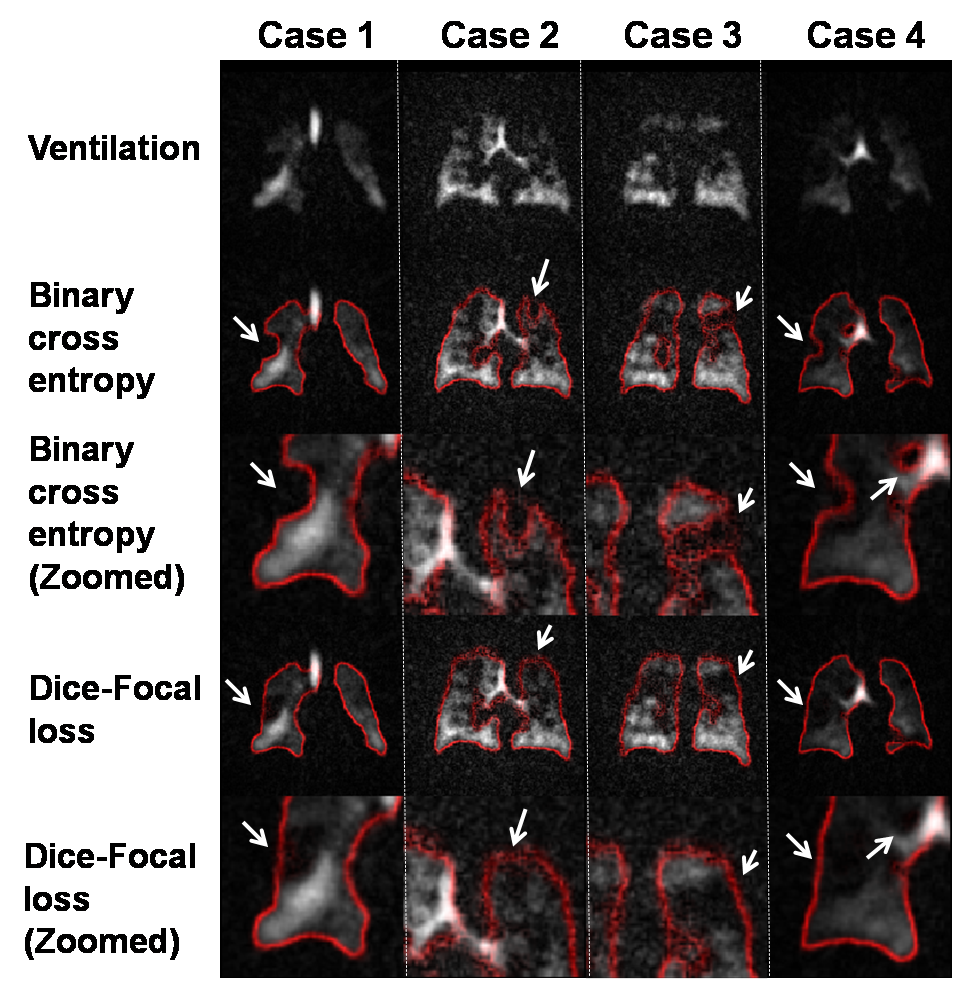
The focal loss function6 encourages the model to include ventilation defect areas in the segmentation by lowering the relative penalty of false positives to false negative and makes the model focus on poorly ventilated areas by increasing the overall penalty in that area. This is illustrated in Fig 3 showing that binary cross entropy causes defects to shift the lung boundary, but that this is overcome by the addition of focal loss. The perceptual loss function is added to encourage the segmentation to following the lung shape and is given by the Euclidean distance (ED) between the output from the encoder to the ground-truth mask and the SM prediction. For training the perceptual loss model, loss is given by the binary cross entropy for EDM and ED for PM.
Training:
The SM, EDM, and PM were trained individually over 126,000 steps with batch size = 1. Subsequently, the frozen-weight encoder in the EDM was used to train the SM for an additional 126,000 steps. The SM was trained using ventilation images as inputs and the ground-truth segmentation as the outputs. EDM was trained using the ground-truth segmentation for both inputs and outputs. The PM used either the 1H structural or 129Xe ventilation images as the inputs; the outputs were from the encoder in the EDM using the associated segmentation.
Results
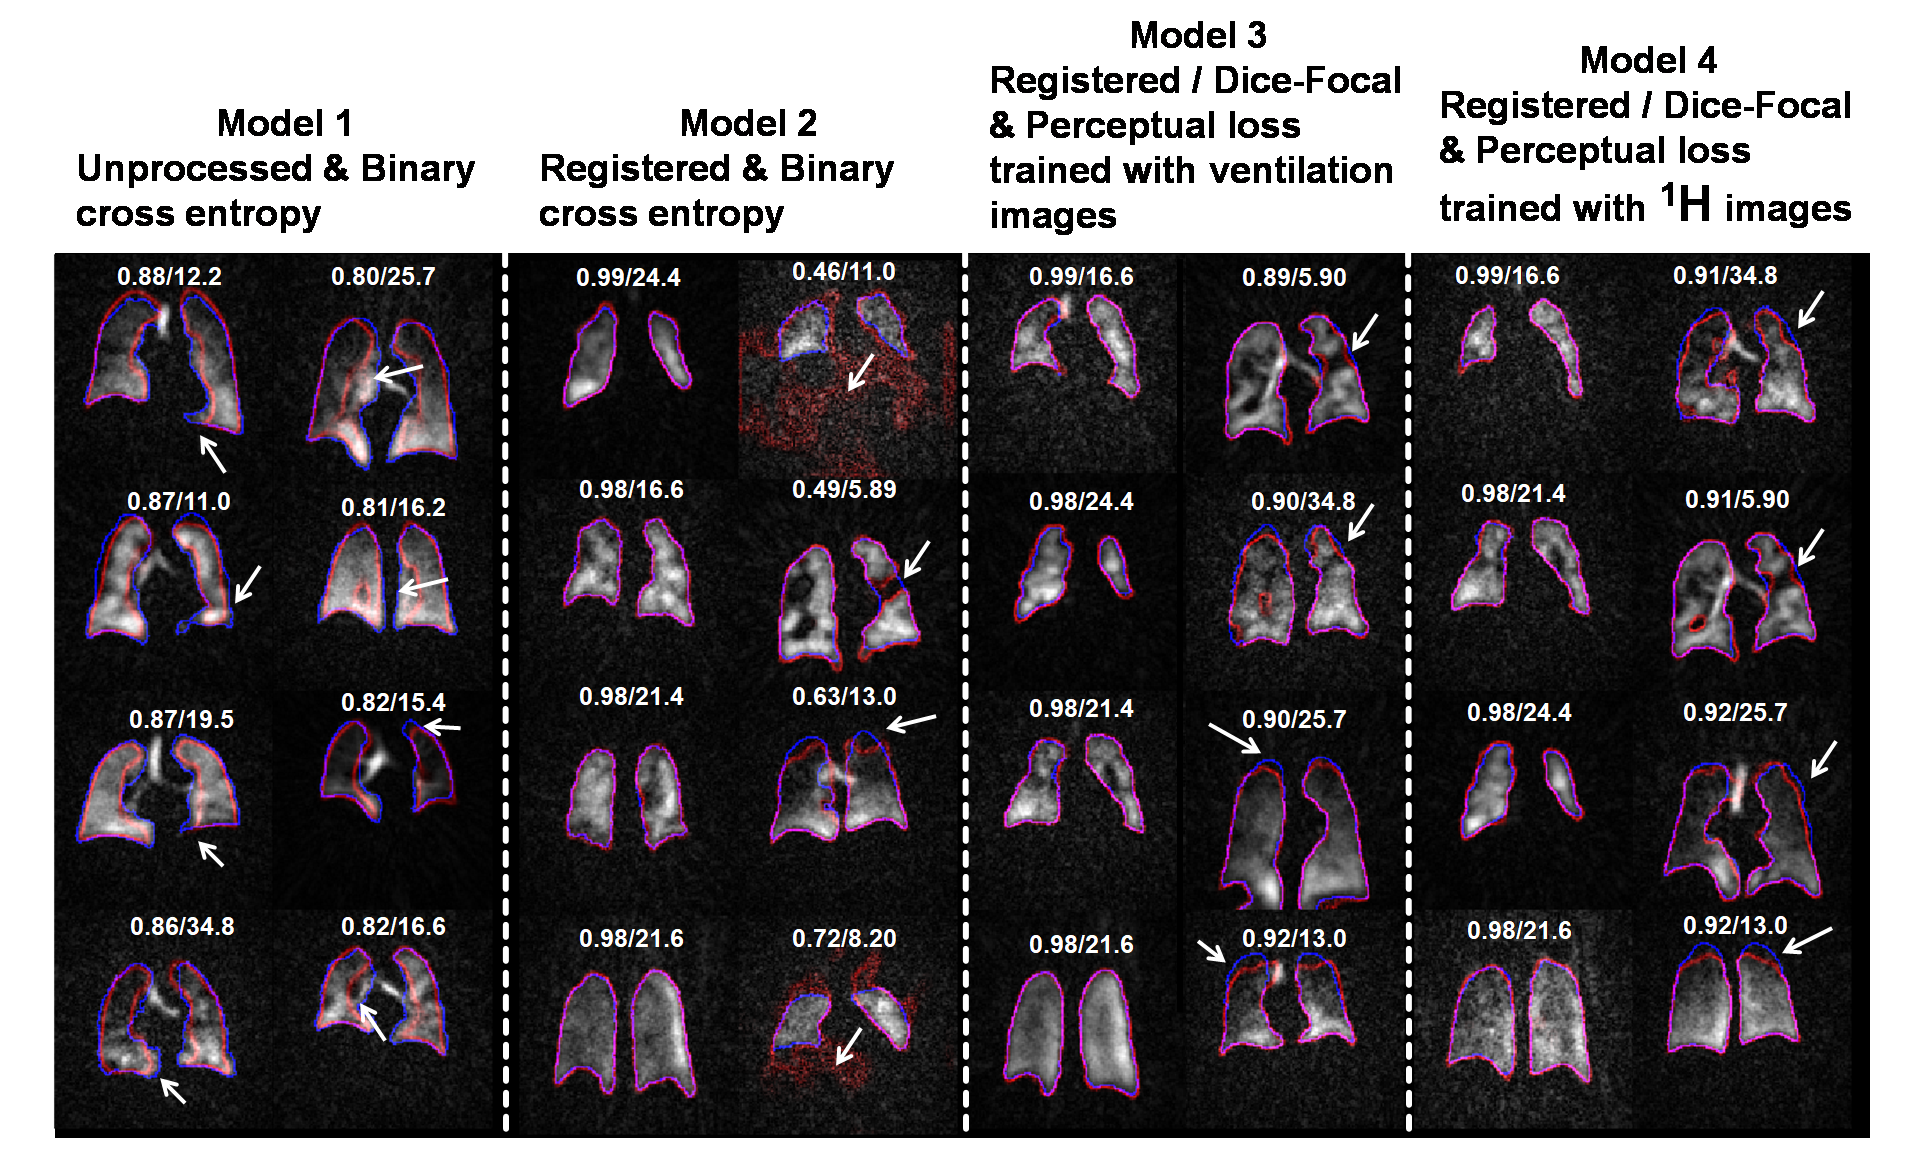
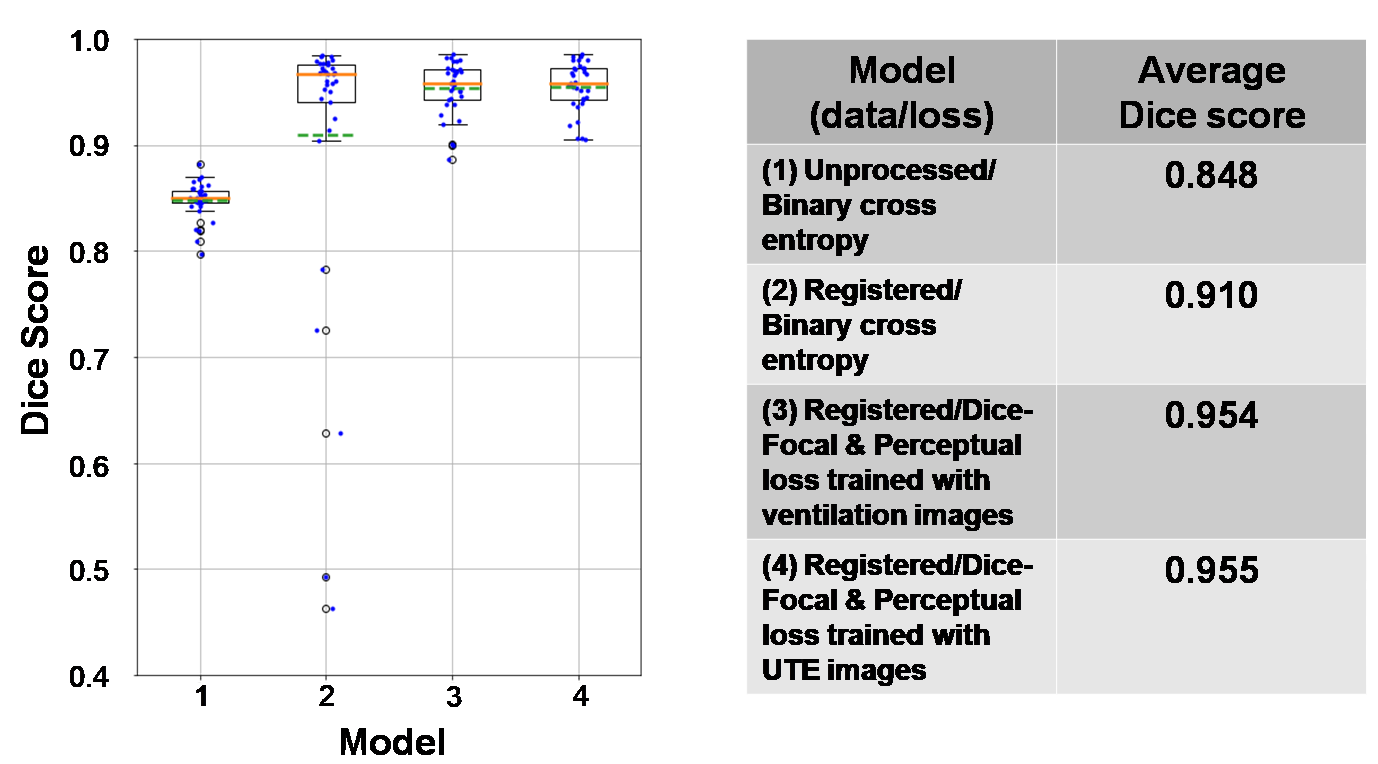
We found that the model performance improves significantly when training data undergoes an additional registration step. The registered dataset is created by registering the ventilation images to the ground-truth segmentations to improve alignment and SNR. However, while this facilitates training of the network, it causes it to struggle with segmenting low-SNR images. Therefore, the perceptual loss component is used to constrain the network to predict segmentation that follows the known anatomical structure. This is illustrated in Fig 4, showing incorrect segmentation of low-SNR images when using only the traditional 3D-CNN with binary cross entropy. Fig 5 shows quantitative comparison between models, further demonstrating that the proposed model performs better than the traditional model and comparable to expert readers (Dice score: 0.955). We did not observe significant differences between training PM with ventilation or 1H images.Discussion
We have demonstrated that a 3D-CNN using only 129Xe MRI inputs generates thoracic cavity segmentations that are similar to those of expert readers using both 129Xe MRI and volume-matched 1H scans. These methods may help reduce inter-reader subjectivity and allow quantification of pulmonary 129Xe MRI when corresponding proton images are not volume-matched, poorly registered, or unavailable.Acknowledgements
R01HL105643, R01HL12677, NSF GRFP DGE-1644868References
1. Wang, Z., Robertson, S. H., Wang, J., He, M., Virgincar, R. S., Schrank, G. M., Bier, E. A., Rajagopal, S., Huang, Y. C., O’Riordan, T. G., Rackley, C. R., McAdams, H. P., & Driehuys, B. (2017). Quantitative analysis of hyperpolarized 129Xe gas transfer MRI. Medical Physics, 44(6). https://doi.org/10.1002/mp.12264
2. He, M., Driehuys, B., Que, L. G., & Huang, Y. C. T. (2016). Using Hyperpolarized 129Xe MRI to Quantify the Pulmonary Ventilation Distribution. Academic Radiology. https://doi.org/10.1016/j.acra.2016.07.014
3. Tustison, N. J., Avants, B. B., Lin, Z., Feng, X., Cullen, N., Mata, J. F., Flors, L., Gee, J. C., Altes, T. A., Mugler, J. P., & Qing, K. (2019). Convolutional Neural Networks with Template-Based Data Augmentation for Functional Lung Image Quantification. Academic Radiology. https://doi.org/10.1016/j.acra.2018.08.003
4. Milletari, F., Navab, N., & Ahmadi, S. A. (2016). V-Net: Fully convolutional neural networks for volumetric medical image segmentation. Proceedings - 2016 4th International Conference on 3D Vision, 3DV 2016. https://doi.org/10.1109/3DV.2016.79
5. Oktay, O., Ferrante, E., Kamnitsas, K., Heinrich, M., Bai, W., Caballero, J., Cook, S. A., De Marvao, A., Dawes, T., O’Regan, D. P., Kainz, B., Glocker, B., & Rueckert, D. (2018). Anatomically Constrained Neural Networks (ACNNs): Application to Cardiac Image Enhancement and Segmentation. IEEE Transactions on Medical Imaging. https://doi.org/10.1109/TMI.2017.2743464
6. Lin, T. Y., Goyal, P., Girshick, R., He, K., & Dollar, P. (2020). Focal Loss for Dense Object Detection. IEEE Transactions on Pattern Analysis and Machine Intelligence. https://doi.org/10.1109/TPAMI.2018.2858826
Figures