0389
Multi-task Deep Learning for Late-activation Detection of Left Ventricular Myocardium1Electrical and Computer Engineering, University of Virginia, Charlottesville, VA, United States, 2Department of Biomedical Engineering, University of VIrginia, Charlottesville, VA, United States, 3School of Medicine, University of Virginia, Charlottesville, VA, United States
Synopsis
Implantation of the left ventricular pacing lead at the area with delayed activation is critical to Cardiac Resynchronization Therapy (CRT) response. Current approaches of detecting late-activated regions of left ventricles (LV) are slow with unsatisfied accuracy, particularly in cases where scar tissues exist in the patient’s heart. This work presents a multi-task deep learning algorithm to automatically identify late-activated regions of LV, as well as estimating the Time to the Onset of circumferential Shortening (TOS) using spatio-temporal cardiac DENSE MR images. Experimental results show that our algorithm provides ultra-fast identification of late-activated regions and estimated TOS with increased accuracy.
Introduction
Studies have shown that late mechanical activations can be effectively measured on circumferential strains of tissue displacements imaged by Displacement Encoding with Stimulated Echo (DENSE) 1,2. Existing methods of detecting such late-activated regions suffer from computational inefficiency and low accuracy 3. To combat these challenges, we develop a joint classification and regression network that provides fast and accurate prediction of late-activated region and TOS. This network learns a shared representation by considering the inherent correlation between two tasks. The classification-guided regression significantly improves the TOS estimation through suppressing misleading information that may affect model performance in normal regions, and vice versa. Another advantage of our approach is that it eliminates a heavy burden of manual parameter-tuning for unseen test data, which is required in existing methods 3.Theory
To remove the effect of motion artifacts, we use cardiac strain instead of displacement to measure late activations. Let $$$\Omega = \mathbb{R}^d / \mathbb{Z}^d$$$ be a $$$d$$$-dimensional torus domain with periodic boundary conditions. Given a $$$d$$$-dimensional displacement map $$$u(x):\Omega \rightarrow \mathbb{R}^d$$$, a Jacobian matrix $$$D^{d \times d}$$$ of $$$u$$$ at each spatial location is$$
D = \begin{pmatrix} \Delta u_1^1 & \cdots & \Delta u_1^d \\ \vdots & \ddots & \vdots \\ \Delta u_d^1 & \cdots & \Delta u_d^d \end{pmatrix},
$$
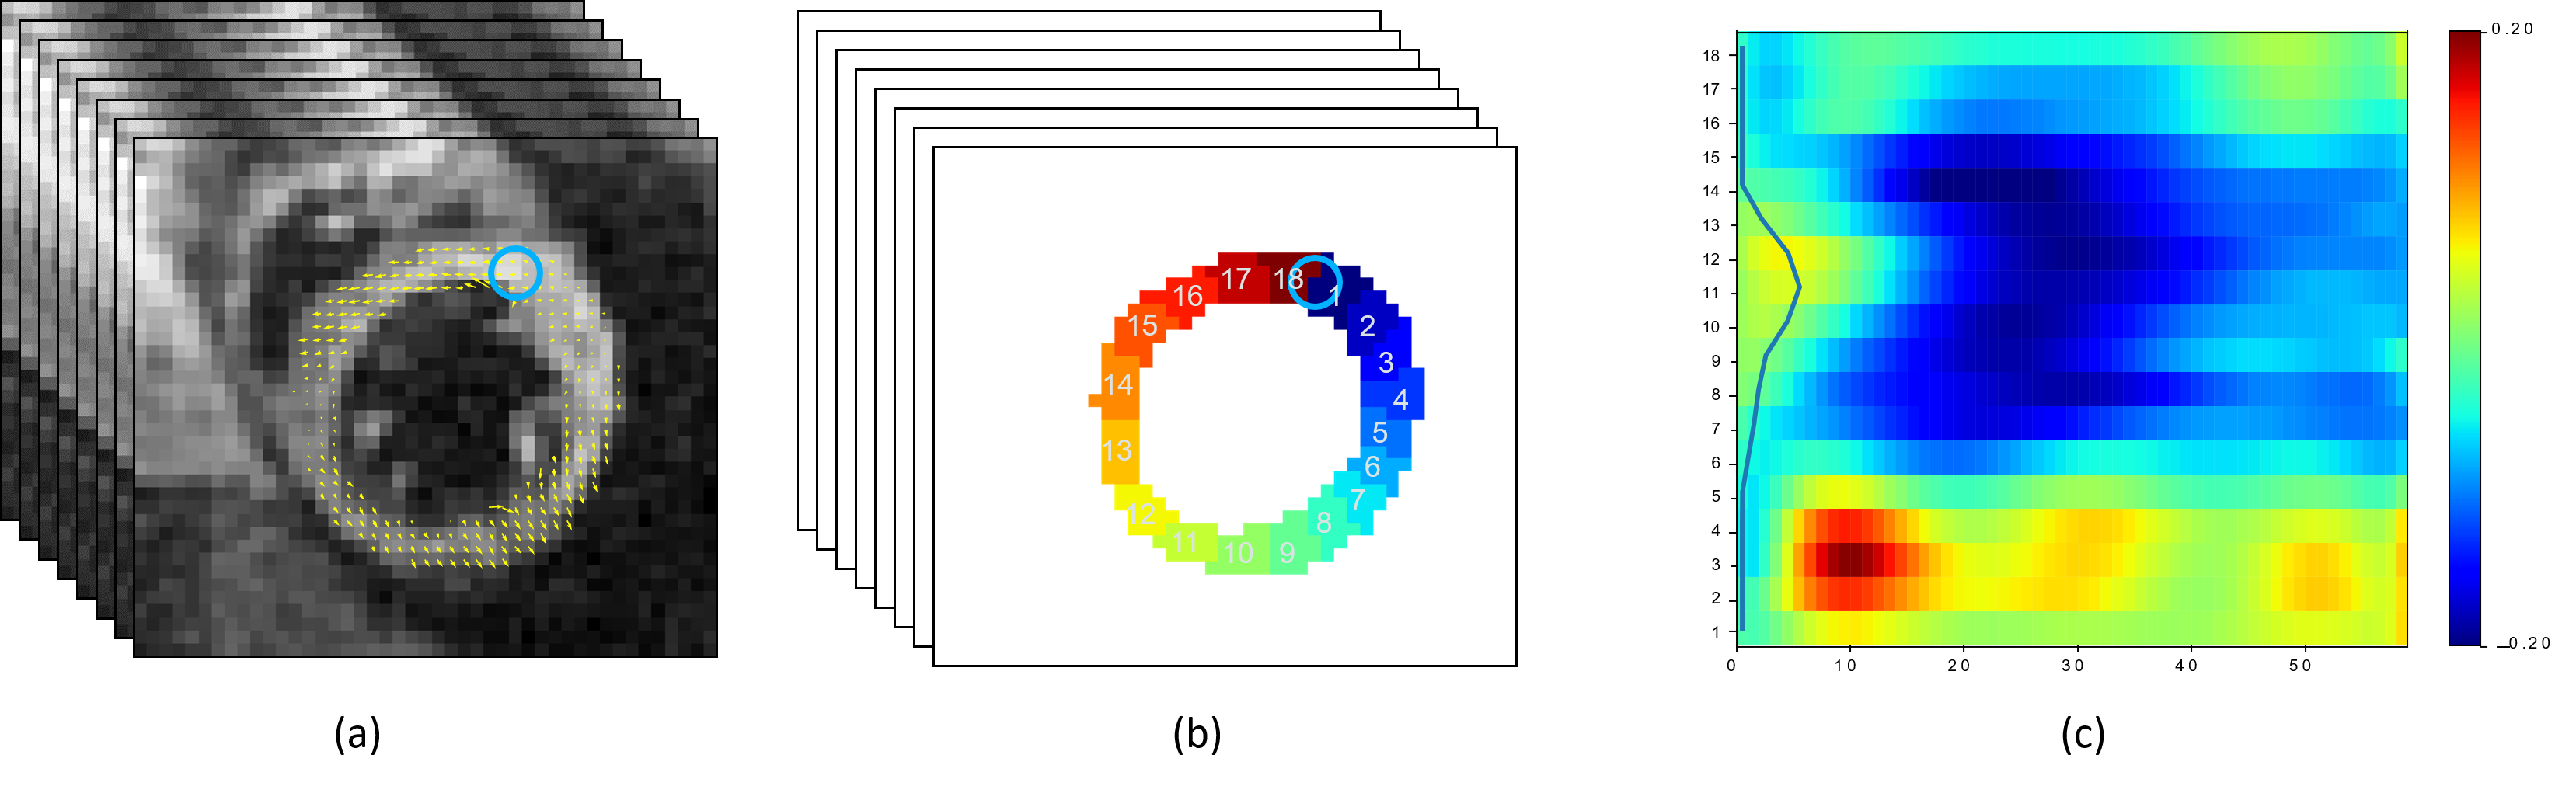
where $$$\Delta u_i^j=\frac{\mathbf{d} u_i}{\mathbf{d} x_j}$$$, with $$$i, j \in \{1, \cdots, d\}$$$. A strain tensor $$$E$$$ is then computed as $$$E = \frac{1}{2}(D^T D-I)$$$, where $$$T$$$ denotes a matrix transpose and $$$I$$$ is a $$$d \times d$$$ identity matrix. This work focuses on the circumferential strain, which is the component of strain along the myocardium. An example of strain matrix computed from temporal MR images are shown in Fig 1.
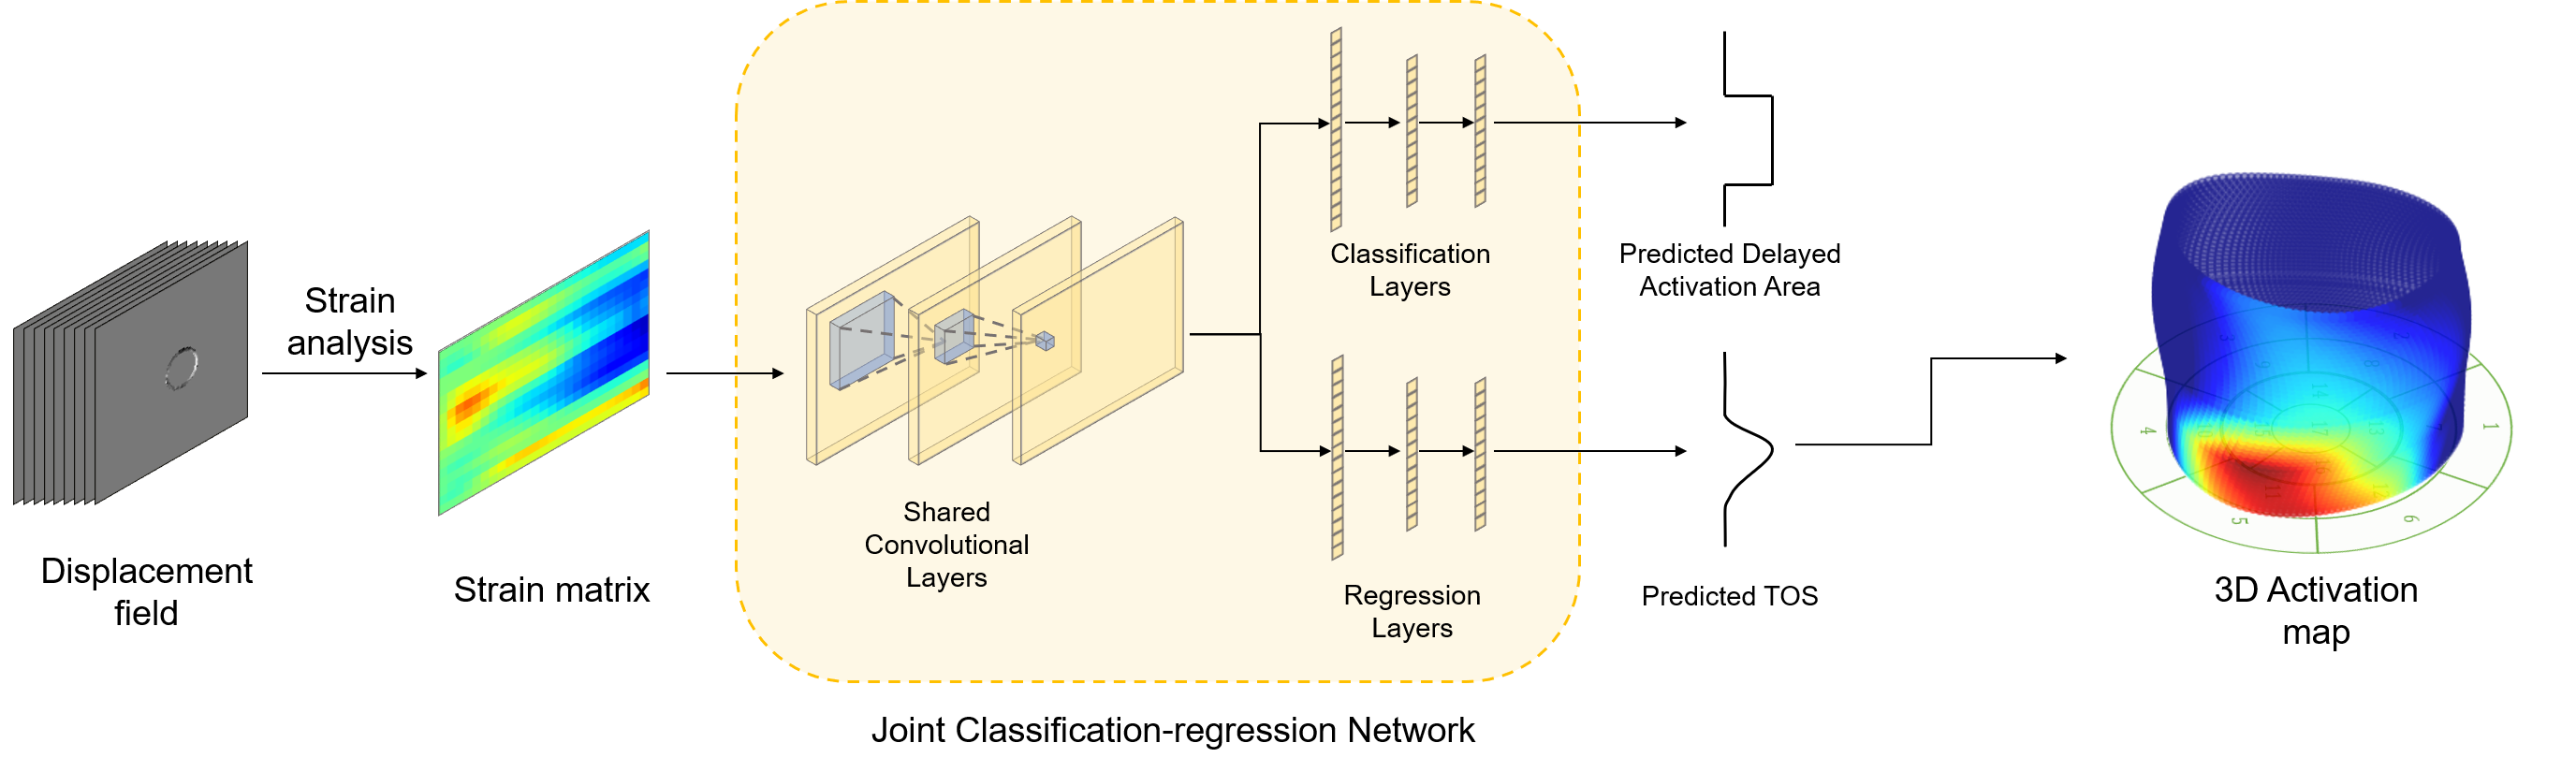
Our multi-task neural network is illustrated in Fig 2. The loss function is a sum of regression and classification loss:
$$L = \|f_{\text{reg}}(f_{\text{conv}}(x)) - y_{\text{TOS}}\|_2 + \text{BCE}(f_{\text{cls}}(f_{\text{conv}}(x)), y_{\text{cls}}),$$
where $$$x$$$ is the input strain matrix, $$$y_{\text{TOS}}$$$ is the manual labeled TOS values used as ground truth, and $$$y_{\text{cls}}$$$ is a binary vector indicating whether each segment has delayed activation or not. The $$$f_{\text{conv}}$$$, $$$f_{\text{cls}}$$$, $$$f_{\text{reg}}$$$ are the shared convolutional layers, classification layers and the regression layers, respectively. The $$$\text{BCE}$$$ denotes the binary cross entropy, which is defined as
$$\text{BCE}\left( y_{\text{cls}},f_{\text{reg}}(f_{\text{conv}}(x))\right) = - y_{\text{cls}}\log{f_{\text{reg}}(f_{\text{conv}}(x)}) - (1- y_{\text{cls}})\log{(1-f_{\text{cls}}(f_{\text{conv}}(x))}).$$
Method
We test the proposed network on cine DENSE MRIs collected from $$$15$$$ patients in total. All images were acquired using a $$$1.5$$$T MR scanner (Avanto, Siemens, Erlangen, Germany) with a four-channel phased-array radiofrequency coil. Cine DENSE was performed in 4 short-axis planes at basal, two mid-ventricular, and apical levels. Cine DENSE parameters included a temporal resolution of $$$17\text{ mm}$$$, pixel size of $$$2.65 \times 2.65 \text{ mm}^2$$$ and slice thickness = $$$8\text{ mm}$$$. Displacement was encoded in two orthogonal directions and a spiral k-space trajectory was used with $$$6$$$ interleaves per image. A number of $$$3115$$$ slices after data augmentation from $$$12$$$ patients are used for training, and the rest for testing. The augmentation includes deformation and cyclic translations along the segment axis. We also compare the results of our work with the active contour 3 and a recent end-to-end TOS prediction network proposed 4. The network training was performed on an Nvidia 2080Ti GPU with 11 GB RAM over 1000 epochs using an Adam optimizer 5. We set the learning rate as $$$1E-3$$$ and the mini batch size as $$$100$$$.Results
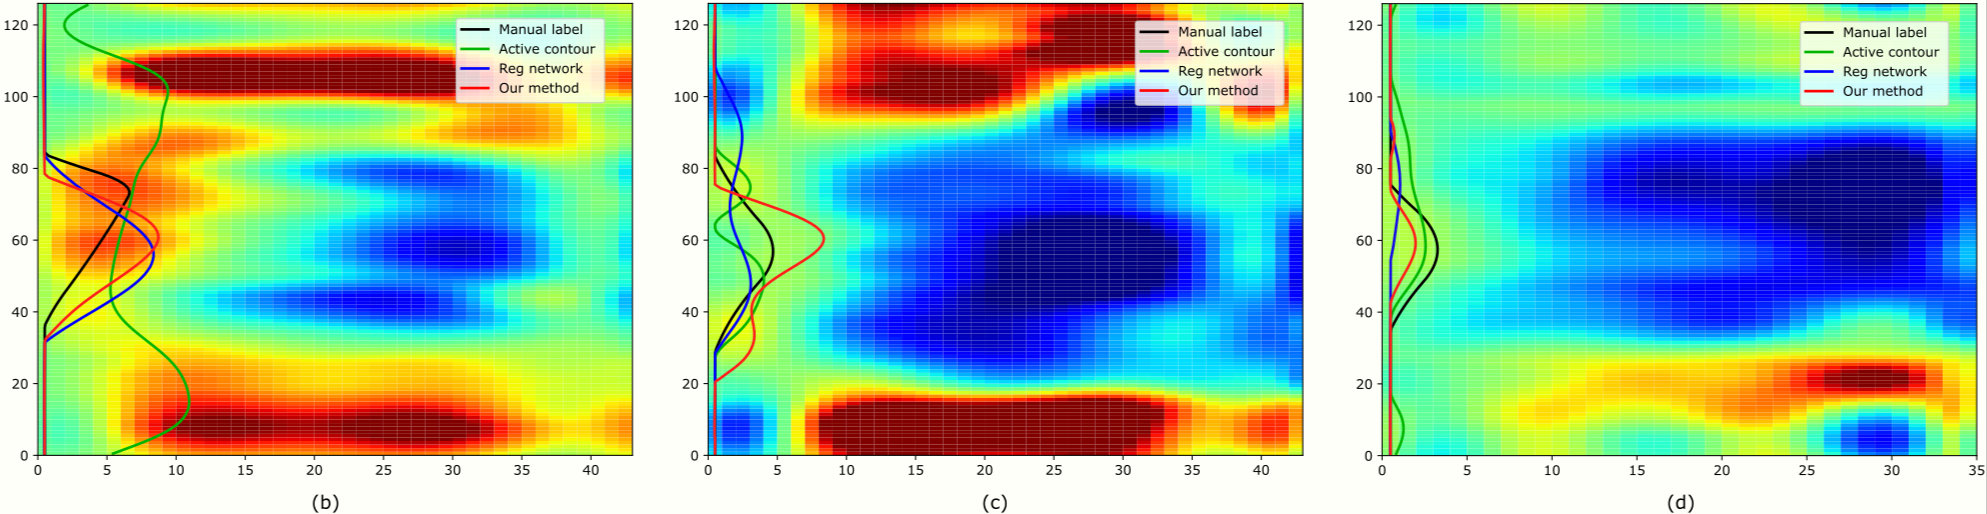
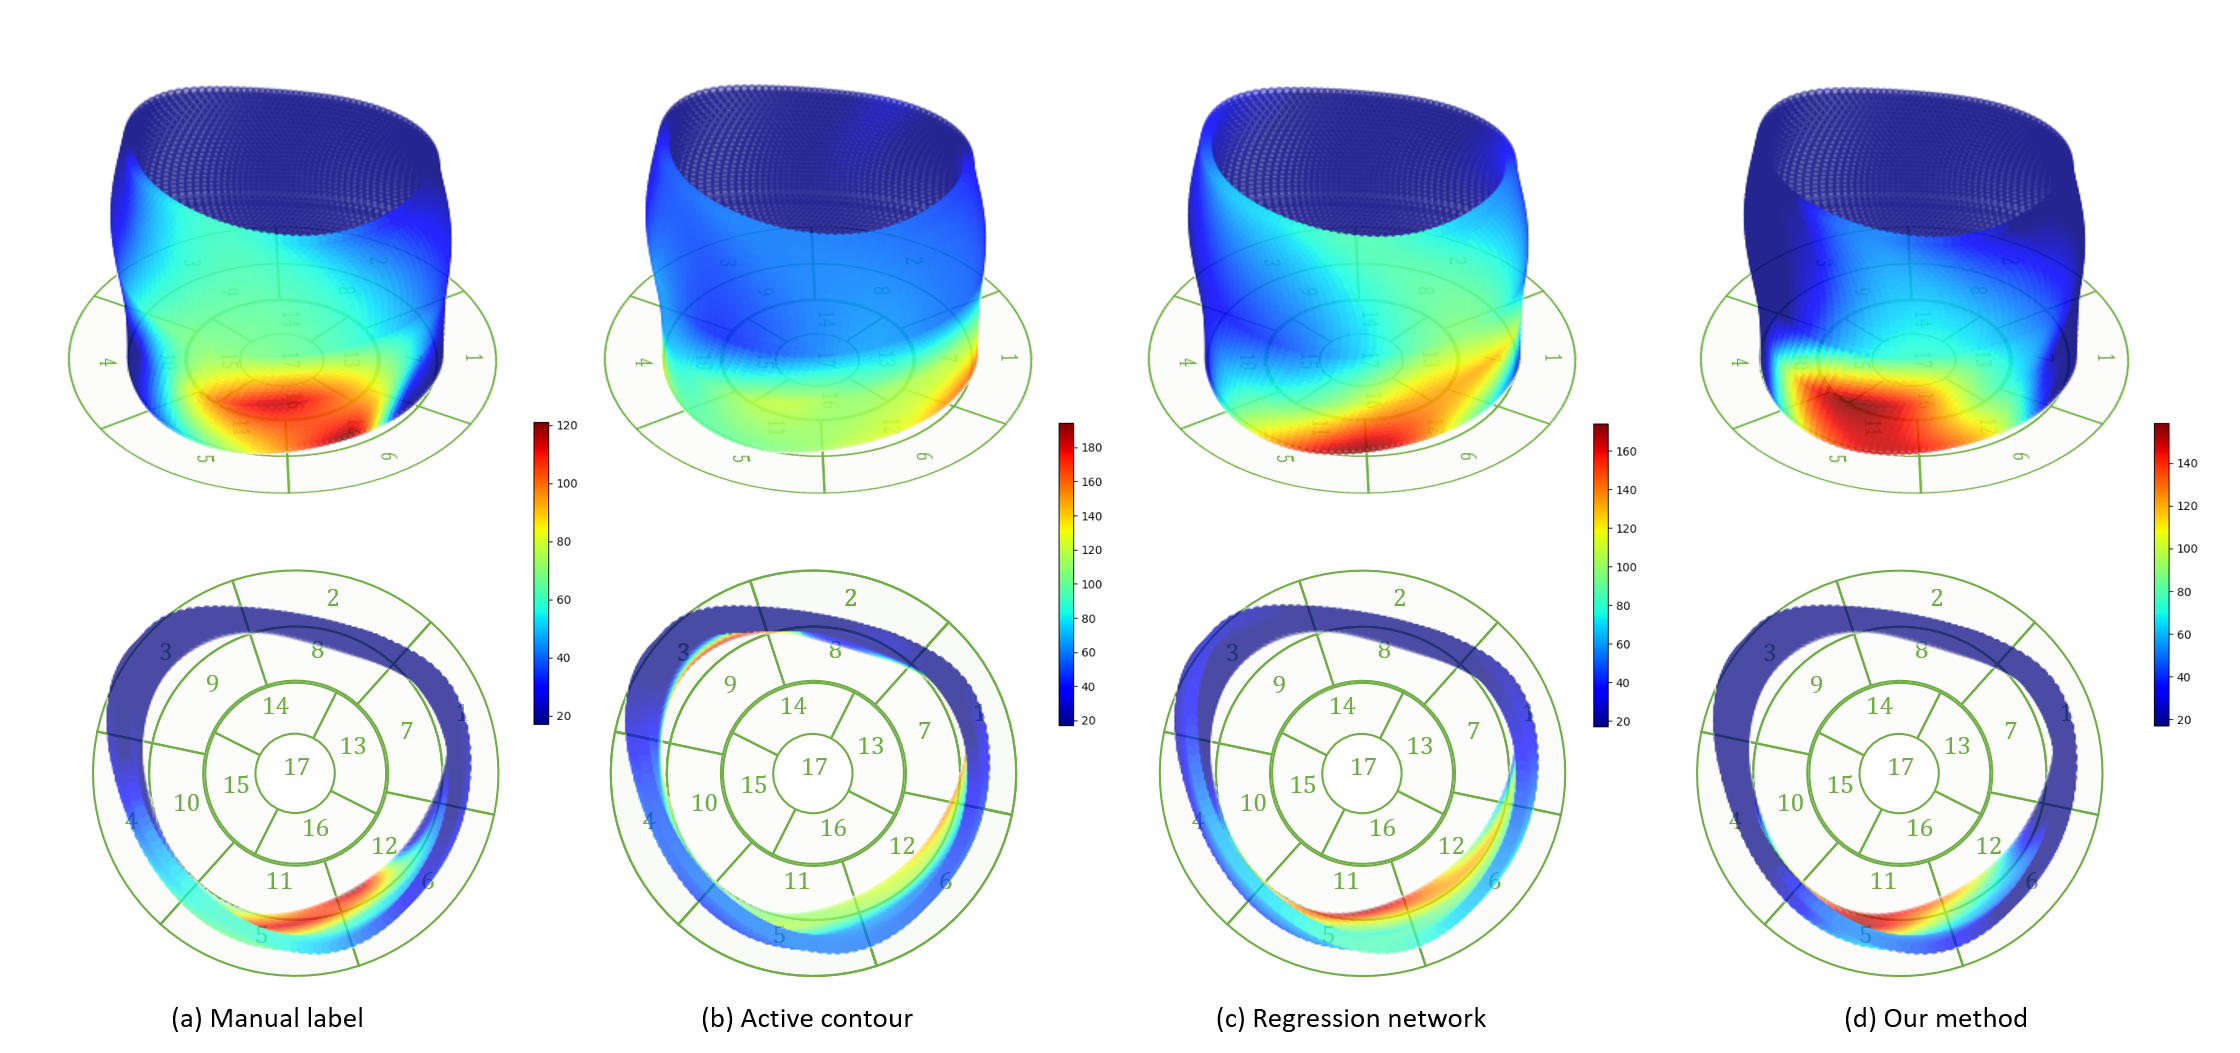
Fig 3 displays examples of predicted TOS curves of test data for manual delineated labels, our method, and two other baseline algorithms (active contour 3 and regression network 4). It shows that our joint network is more robust and stable to predict misleading regions, while the baseline methods output completely wrong results. Fig 4 shows examples of reconstructed 3D activation maps for all methods. For visualization purposes, we employ the $$$17$$$-segment American Heart Association cardiac model, which has been shown to provide the best agreement with the available anatomical data 6. The Basal and mid-plane slices from the short-axis view are divided into six segments, apical into four segments, and apex into one segment.Conclusion and Discussion
This work presents a novel multi-task network that offers fast and accurate predictions of delayed activation time of LV from cardiac images. We demonstrate that our algorithm outperforms the state-of-the-art methods 3,4 with improved accuracy. In addition, our method provides fast prediction of TOS with $$$1.73\times10^{-3}\text{ s}$$$ per image. The ability of our work predicting better TOS to locate regions of severely delayed activation has great potential to improve the CRT response rate.Acknowledgements
This work is supported by NIH R01HL147104.References
1. Bilchick, Kenneth C., et al. "Impact of mechanical activation, scar, and electrical timing on cardiac resynchronization therapy response and clinical outcomes." Journal of the American College of Cardiology 63.16 (2014): 1657-1666.
2. Ramachandran, Raghav, et al. "Singular value decomposition applied to cardiac strain from MR imaging for selection of optimal cardiac resynchronization therapy candidates." Radiology 275.2 (2015): 413-420.
3. Auger, Daniel A., et al. "Imaging left‐ventricular mechanical activation in heart failure patients using cine DENSE MRI: Validation and implications for cardiac resynchronization therapy." Journal of Magnetic Resonance Imaging 46.3 (2017): 887-896.
4. Xing, Jiarui, et al. "Deep Networks to Automatically Detect Late-activating Regions of the Heart." arXiv preprint arXiv:2012.04000 (2020).
5. Kingma, Diederik P., and Jimmy Ba. "Adam: A method for stochastic optimization." arXiv preprint arXiv:1412.6980 (2014).
6. American Heart Association Writing Group on Myocardial Segmentation and Registration for Cardiac Imaging:, et al. "Standardized myocardial segmentation and nomenclature for tomographic imaging of the heart: a statement for healthcare professionals from the Cardiac Imaging Committee of the Council on Clinical Cardiology of the American Heart Association." Circulation 105.4 (2002): 539-542.
Figures