0386
An interstitial fluid proxy of altered glymphatics in Alzheimer’s disease: the necessity of three-directional intravoxel incoherent motion1Department of Radiology and Nuclear Medicine, Maastricht University Medical Center, Maastricht, Netherlands, 2School for Mental Health & Neuroscience, Alzheimer Center Limburg, Maastricht, Netherlands, 3Department of Radiology, Leiden University Medical Center, Leiden, Netherlands, 4Department of Psychiatry and Neuropsychology, Maastricht University, Maastricht, Netherlands, 5School for Cardiovascular Disease, Maastricht University, Maastricht, Netherlands, 6Department of Electrical Engineering, Eindhoven University of Technology, Eindhoven, Netherlands
Synopsis
The interstitial fluid fraction assessed with spectral analysis in intravoxel-incoherent motion MRI can be a potential, non-invasive method to identify tissue damage on a microscopic level and to investigate glymphatic alterations within different disease states. The current multi-dimensional approach has a long acquisition time, thereby lowering the feasibility of IVIM as a measurement of ISF in clinical practice. This study simultaneously investigates potential group differences in the ISF-fraction in Alzheimer’s disease, mild cognitive impairment, and controls, and explores the possibility to shorten acquisition time drastically by examining the contribution of individual primary directions.
Introduction
Recently, a spectral analysis method using the non-negative least squares (NNLS) in intravoxel incoherent motion (IVIM) imaging has been introduced to identify an intermediate component between the two classical components.1 This intermediate component is argued to represent increased interstitial fluid within the parenchyma (the ISF-fraction).1,2 Thereby, this ISF-fraction could provide a non-invasive, tracer independent alternative to investigate glymphatic alterations within different disease states. The ISF-fraction was previously found to be associated to both vascular and neurodegenerative markers in a memory clinic sample, including patients with mild cognitive impairment (MCI) and Alzheimer’s disease (AD), and was suggested to relate to glymphatic alterations within these specific disease states.2Traditionally, IVIM images are acquired with one or three diffusion encoding directions. When acquired in three directions, these are averaged to form a trace image, thereby removing any influence of diffusional directionality.3 Unfortunately, this multi-dimensional approach largely extends the acquisition time, thereby lowering the feasibility of IVIM as a measurement of ISF in clinical practice.
This study simultaneously investigates potential group differences in the ISF-fraction in AD, MCI, and controls, and explores the possibility to shorten acquisition time drastically by examining the contribution of individual primary directions. When tissue has a strong directionality, as in the corpus callosum (CC), it is expected that the ISF movement will be prominent in the same direction. Additionally, we foresee to find a higher ISF-fraction in patient groups compared with controls, as processes underlying their pathology, such as inflammation and oedema, would ultimately lead to cell loss and cause an increase in ISF volume.4,5
Methods
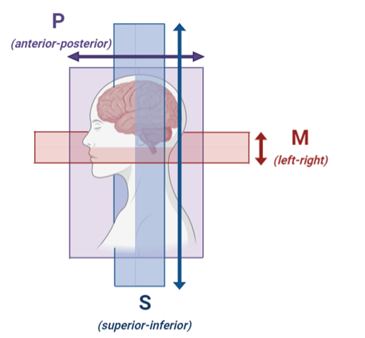
Subjects: Thirty patients with AD (n=15) and MCI (n=15), and 33 cognitively normal controls were included in this study.MRI acquisition: All subjects underwent MRI (Philips 3.0 Tesla) with a 32-channel head coil, as previously described in more detail.6 Diffusion MR images were acquired using single-shot spin-echo echo planar imaging sequence (TR/TE=6800/84ms; matrix=112x112x58; pixel size=2.4x2.4mm; transverse slice thickness=2.4mm), after cerebrospinal fluid suppression (TI=2230ms). In addition to a non-diffusion weighted b=0 s/mm2 image, fourteen diffusion sensitive b-values were employed (b=0,5,7,10,15,20,30,40,50,60,100,200,400,700 and 1000 s/mm2). Images were acquired in three orthogonal directions: M (left-right), P (anterior-posterior) and S (superior-inferior)(Fig.1).
Image analysis: Trace images were calculated by averaging the signal from the three directions. Thereafter, M, P, S and trace images were corrected separately for head displacements, eddy current and EPI distortions (ExploreDTI version 4.8.4)7 and smoothed with a 3mm FWHM Gaussian kernel (FSL version 6.0.1).8 The anatomical T1 images were automatically segmented with Freesurfer (version 5.1.0), with visual inspection and manual correction.9 White matter (WM) was separated into WM hyperintensities and normal appearing WM (NAWM).6,10 The NAWM and CC regions were downsampled and coregistered to native IVIM space via the T1 anatomical images (FLIRT, FSL).11
Spectral analysis using NNLS was conducted to independently analyse the M, P, S and trace images in a voxel-based manner.1 The intermediate diffusion component (Dint) was identified as 1.5<Diffusivity<4.0*10-3 mm2/s, and the contribution of the intermediate component to the signal was determined by quantifying the ISF-fraction (fint), while correcting for T1- and T2-relaxation effects.1 The median value of the parenchymal diffusivity (Dpar), Dint, fint, absolute (aSSR) and relative (rSSR) sum of squared residuals were extracted for both ROIs.
Differences in group characteristics were assessed using one-way analyses of variance with post-hoc Tukey pairwise comparisons. Per ROI, the fint, Dpar and Dint derived from the M, P, S and trace images of each cognitive group were compared using multivariate linear regression, while correcting for age, sex, aSSR and rSSR, to ensure that significant associations were not biased by the quality of the NNLS model fit (IBM SPSS statistics version 25).
Results
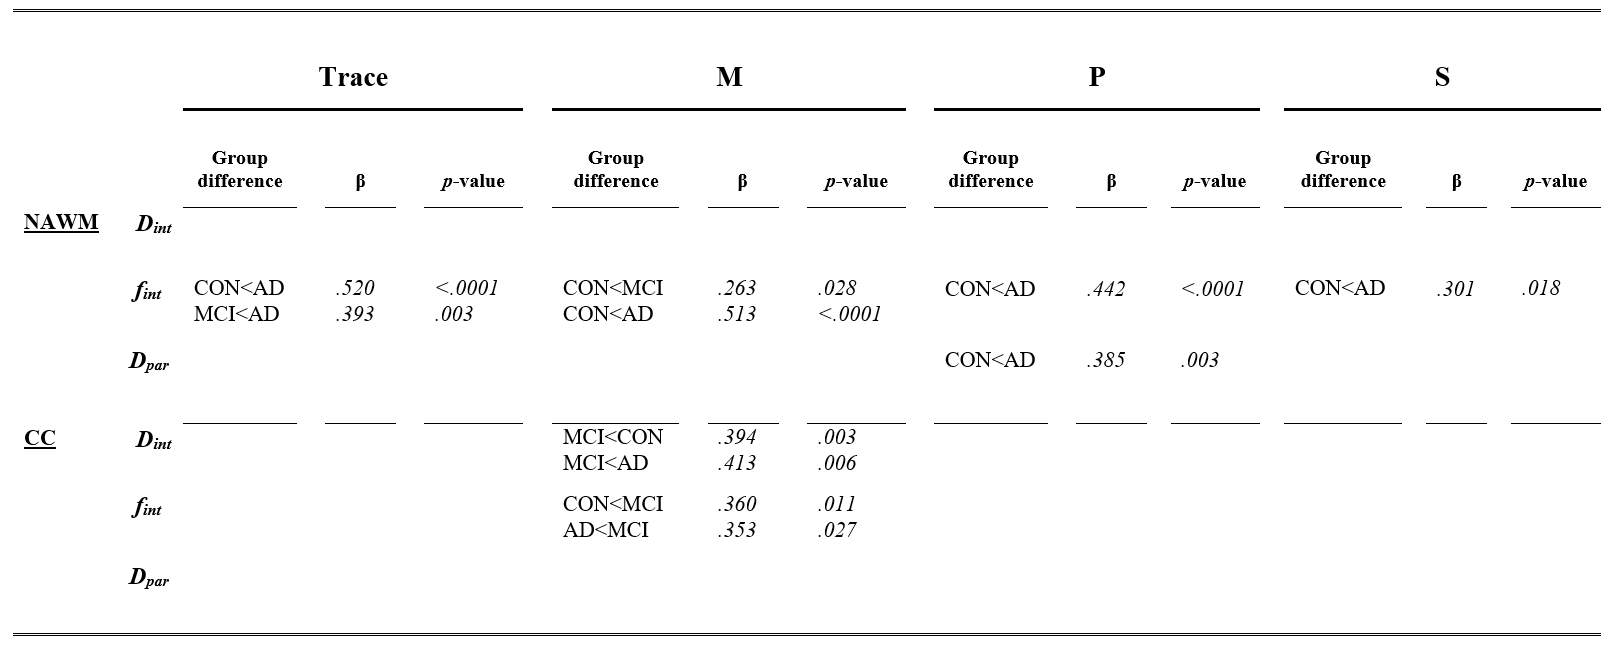
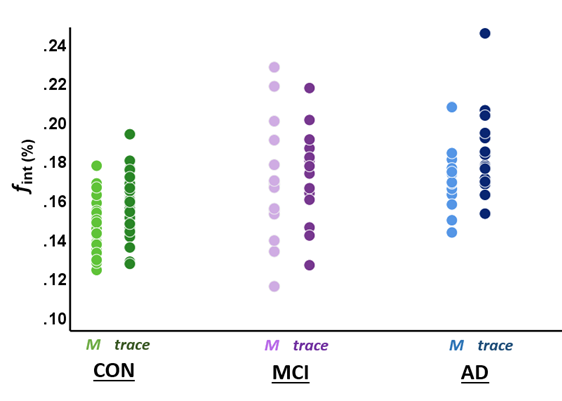
The characteristics per diagnostic group are summarized in Table 1. The descriptive statistics of fint, Dpar, Dint, aSSR and rSSR, extracted from the M, P, S and trace images, can be seen in Table 2. Table 3 contains all the significant group differences of fint, Dpar, and Dint, derived by the M, P, S and trace images. For example, similar group differences in fint can be obtained from the M-direction and the trace (Fig.2).Discussion
Overall, in the NAWM, the one-directional (M, left-right) images seem to be as sensitive to clinical group differences in the ISF-fraction as the trace image. These findings indicate that acquisition in only the M-direction may be a faster alternative for the time-consuming three-directional acquisition. Thereby, this study put forward the possibility to shorten acquisition time in clinical practice by identifying the M-direction essential for the identification of clinical group differences in ISF.Interestingly, when ISF diffusion is prominent in one direction (anisotropic), the averaging into the trace leads to an underestimation of the ISF-fraction. Our results show that in the CC, a highly anisotropic region in the M-(left-right) direction, the trace image is not sensitive enough to identify group differences, in contrast to the primary acquisition direction (M).
In line with the expectations, a higher ISF-fraction was found in AD patients as compared to controls. These findings highlight the ISF-fraction assessed with spectral analysis in IVIM as a potential non-invasive method to identify tissue damage on a microscopic level and to further investigate glymphatic alterations within different disease states.
Acknowledgements
This research was supported by Alzheimer Nederland (research grant WE.03-2018-02).References
1. Wong S, Backes W, Drenthen G, et al. Spectral Diffusion Analysis of Intravoxel Incoherent Motion MRI in Cerebral Small Vessel Disease. Journal of Magnetic Resonance Imaging. 2019.
2. van der Thiel M, Freeze W, Postma A, et al. Exploring the vascular and neurodegenerative origin of increased interstitial fluid diffusion in intravoxel incoherent motion. ISMRM 2020.4459.
3. Iima M, Le Bihan D. Clinical intravoxel incoherent motion and diffusion MR imaging: past, present, and future. Radiology. 2015;278(1):13-32.
4. Weller RO. Pathology of cerebrospinal fluid and interstitial fluid of the CNS: significance for Alzheimer disease, prion disorders and multiple sclerosis. Journal of Neuropathology and Experimental Neurology. 1998;57(10):885.
5. Abbott NJ. Evidence for bulk flow of brain interstitial fluid: significance for physiology and pathology. Neurochemistry International. 2004;45(4):545-552.
6. Freeze WM, Jacobs HI, de Jong JJ, et al. White matter hyperintensities mediate the association between blood-brain barrier leakage and information processing speed. Neurobiology of Aging. 2019.
7. Leemans A, Jeurissen B, Sijbers J, Jones D. ExploreDTI: a graphical toolbox for processing, analyzing, and visualizing diffusion MR data. Paper presented at: Proc Intl Soc Mag Reson Med2009.
8. Jenkinson M, Beckmann CF, Behrens TE, Woolrich MW, Smith SM. FSL. Neuroimage. 2012;62(2):782-790.
9. Fischl B. FreeSurfer. Neuroimage. 2012;62(2):774-781.
10. Jacobs HI, Clerx L, Gronenschild EH, Aalten P, Verhey FR. White matter hyperintensities are positively associated with cortical thickness in Alzheimer's disease. Journal of Alzheimer's Disease. 2014;39(2):409-422.
11. Jenkinson M, Bannister P, Brady M, Smith S. Improved optimization for the robust and accurate linear registration and motion correction of brain images. Neuroimage. 2002;17(2):825-841.
12. De Bie Sd, Vegter J. Standaardvragen 1987 voorstellen voor uniformering van vraagstellingen naar achtergrondkenmerken in interviews. Vereniging van onderzoek instituten (VOI); 1987.
Figures