0384
In vivo characterization of the optic nerve glymphatic system1Department of Ophthalmology, New York University Grossman School of Medicine, New York, NY, United States, 2Department of Radiology, New York University Grossman School of Medicine, New York, NY, United States
Synopsis
To date, it remains unclear if a functional glymphatic system exists in the optic nerve (ON), partly because of limited in vivo methods for characterizing the cerebrospinal fluid (CSF) dynamics in the deeper brain regions. Here, we measured the spatiotemporal profiles in the ON using contrast-enhanced MRI after intrathecal gadolinium infusion, and observed indications for the existence of a molecular size-dependent and aquaporin-4 (AQP4) modulated glymphatic-like system in the ON. These findings may provide imperative insights into the waste clearance mechanisms of the visual system in health and disease.
Introduction
As an extension of the diencephalon, the ON shares many similarities with the brain in terms of tissue organization, spatial confinement, and the absence of lymphatic vessels. Recent studies have identified the existence of the glymphatic system in the brain for metabolic waste removal1. However, except for a few ex-vivo studies illustrating the presence of anatomical glymphatic components in the ON2-4, there is no direct physiological evidence yet to support a functional glymphatic system along the visual pathway. Characterization of the properties of CSF entry and clearance in the ON via in vivo imaging may allow for the identification of the ON glymphatic system. CE-MRI allows for the monitoring of glymphatic dynamics in CNS with no depth limitation5. Here, we used CE-MRI to examine the CSF dynamics in the ON by investigating its dependency with the molecular weight of the contrast agent as well as the effects of pharmacological blockade of AQP4 water channels.Methods
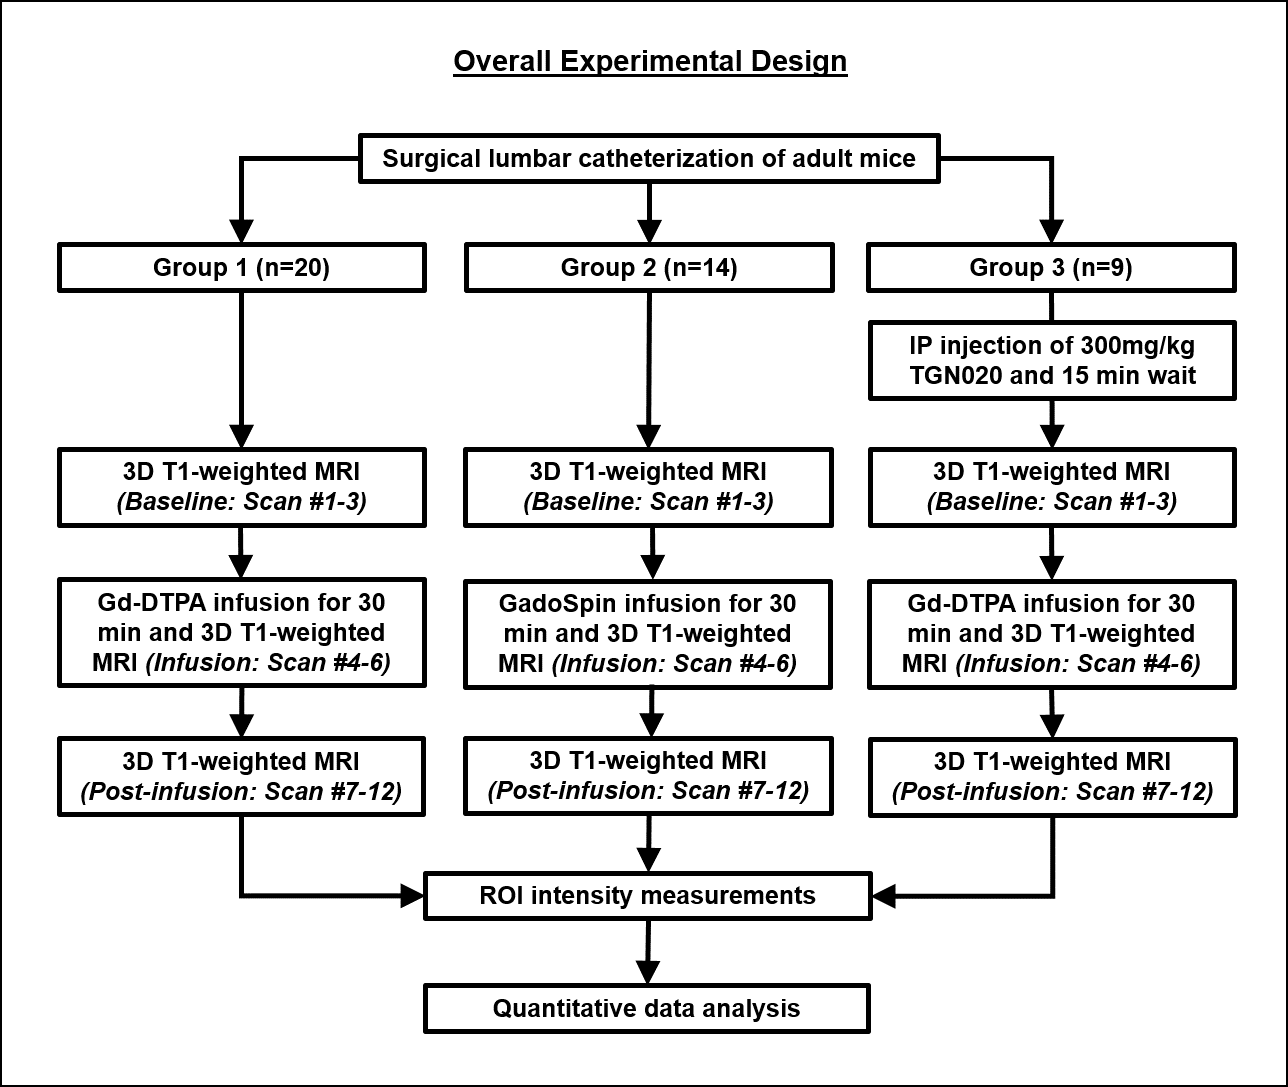
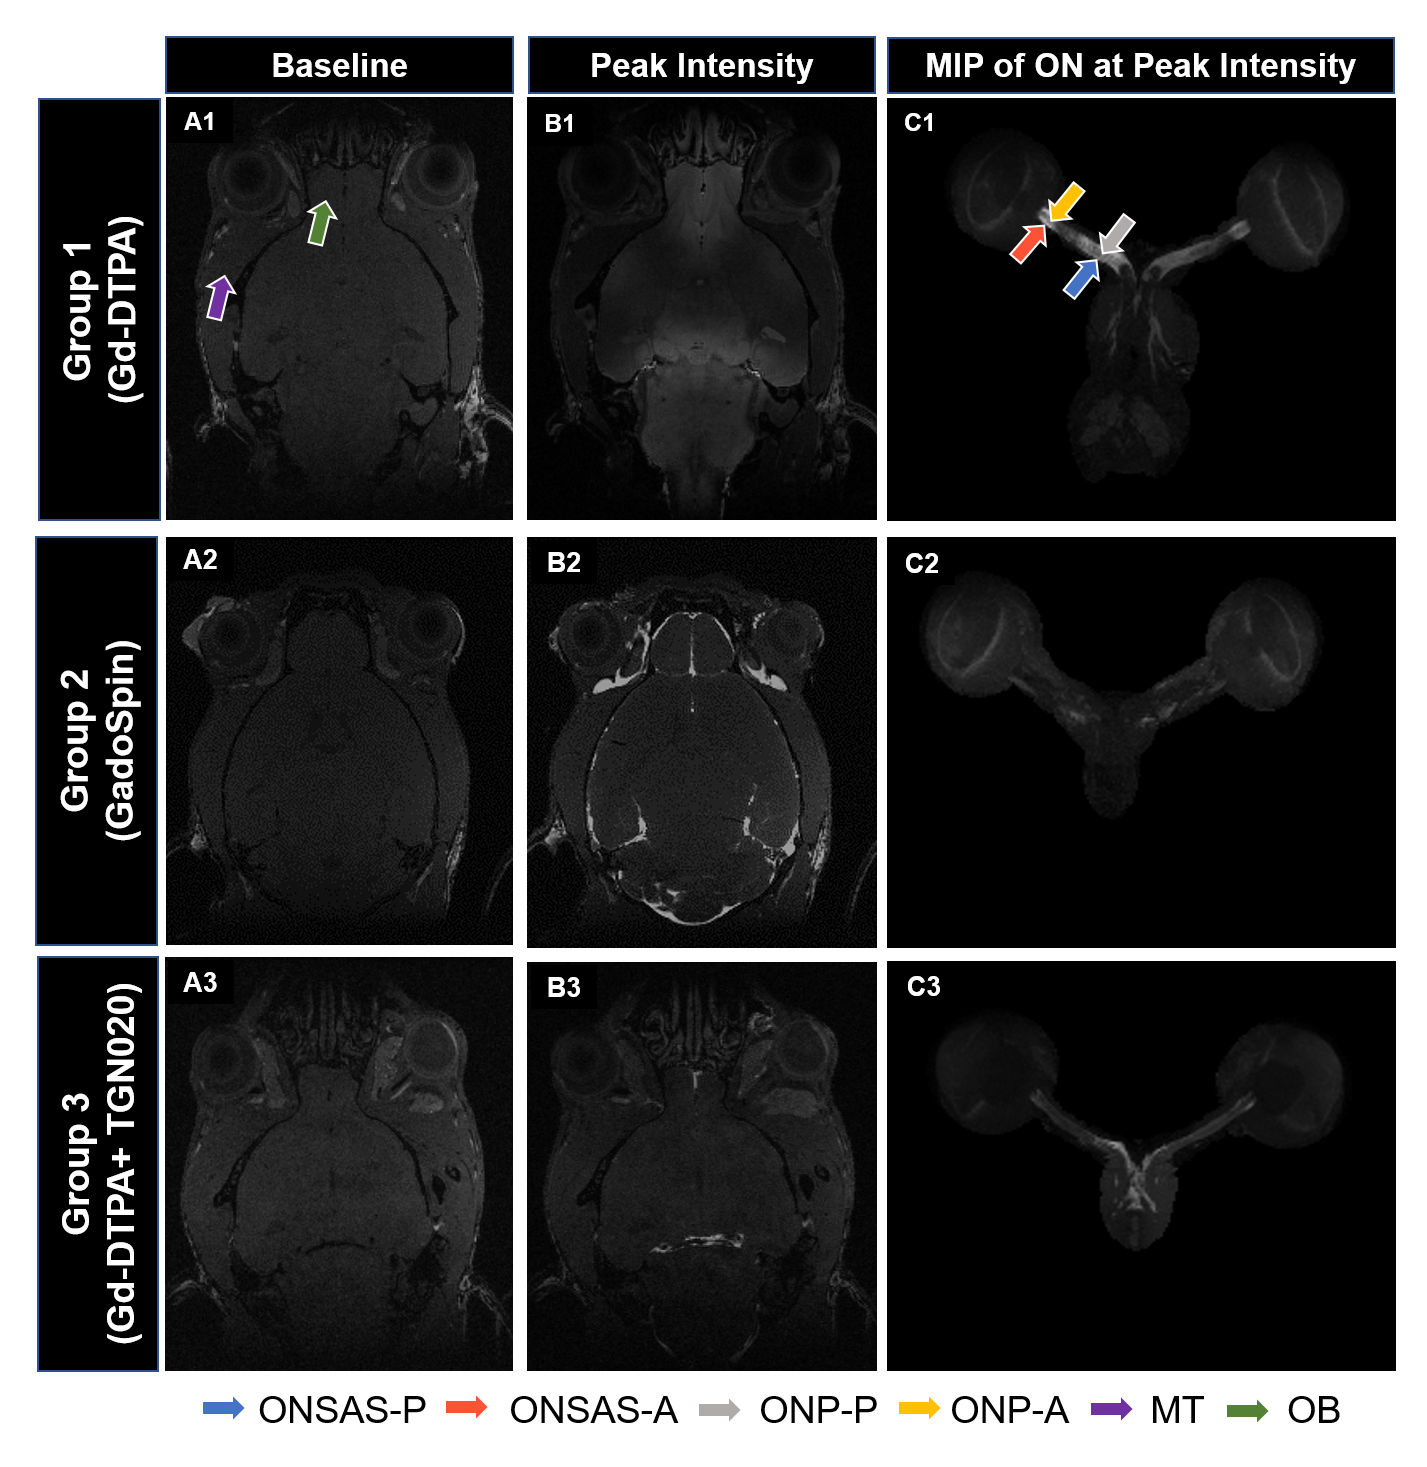
A polyethylene tubing (inner diameter= 0.28 mm; outer diameter= 0.60 mm) was surgically placed intrathecally at the lumbar region (L4-L5) of 43 healthy adult male C57BL/6J mice. The animals were divided into three groups and were subjected to CE-MRI using a 7-Tesla Bruker BioSpec 7030 system (Figure 1). Animals from Group 1 (n=20) and Group 3 (n=9) received Gd-DTPA (MW=0.9kDa) as the contrast agent, while animals from Group 2 (n=14) received GadoSpin (MW=200kDa). In addition, TGN020, a specific AQP4 inhibitor was intraperitoneally injected into the animals in Group 3 at 15 min before CE-MRI at a dose of 300mg/kg. During MRI, animals were maintained under 1.0%-1.5% isoflurane and rectal temperature was maintained at 37±1 oC. Contrast dynamics was monitored using a 3D T1-weighted FLASH sequence with echo time= 3.3 ms, repetition time= 15 ms, flip angle= 25o, field-of-view= 30x30x30 mm3, and an isotropic resolution of 78x78x78 µm3. Each FLASH scan lasted 10 min. A total of 12 continuous FLASH scans were performed with 3 baseline acquisitions followed by 30 min of contrast infusion at 1.6 µl/min via the surgically placed catheter while the scanning continued until the 12th timepoint. T1-weighted signal intensity changes over time were quantified in 6 anatomical regions of interest (ROIs) and compared within and between groups (Figure 2). These ROIs included the posterior ON subarachnoid space (ONSAS-P) caudal/distal to the eye, anterior ON subarachnoid space (ONSAS-A) rostral/proximal to the eye, posterior ON parenchyma (ONP-P), anterior ON parenchyma (ONP-A), olfactory bulb (OB), and muscle tissues (MT).Results
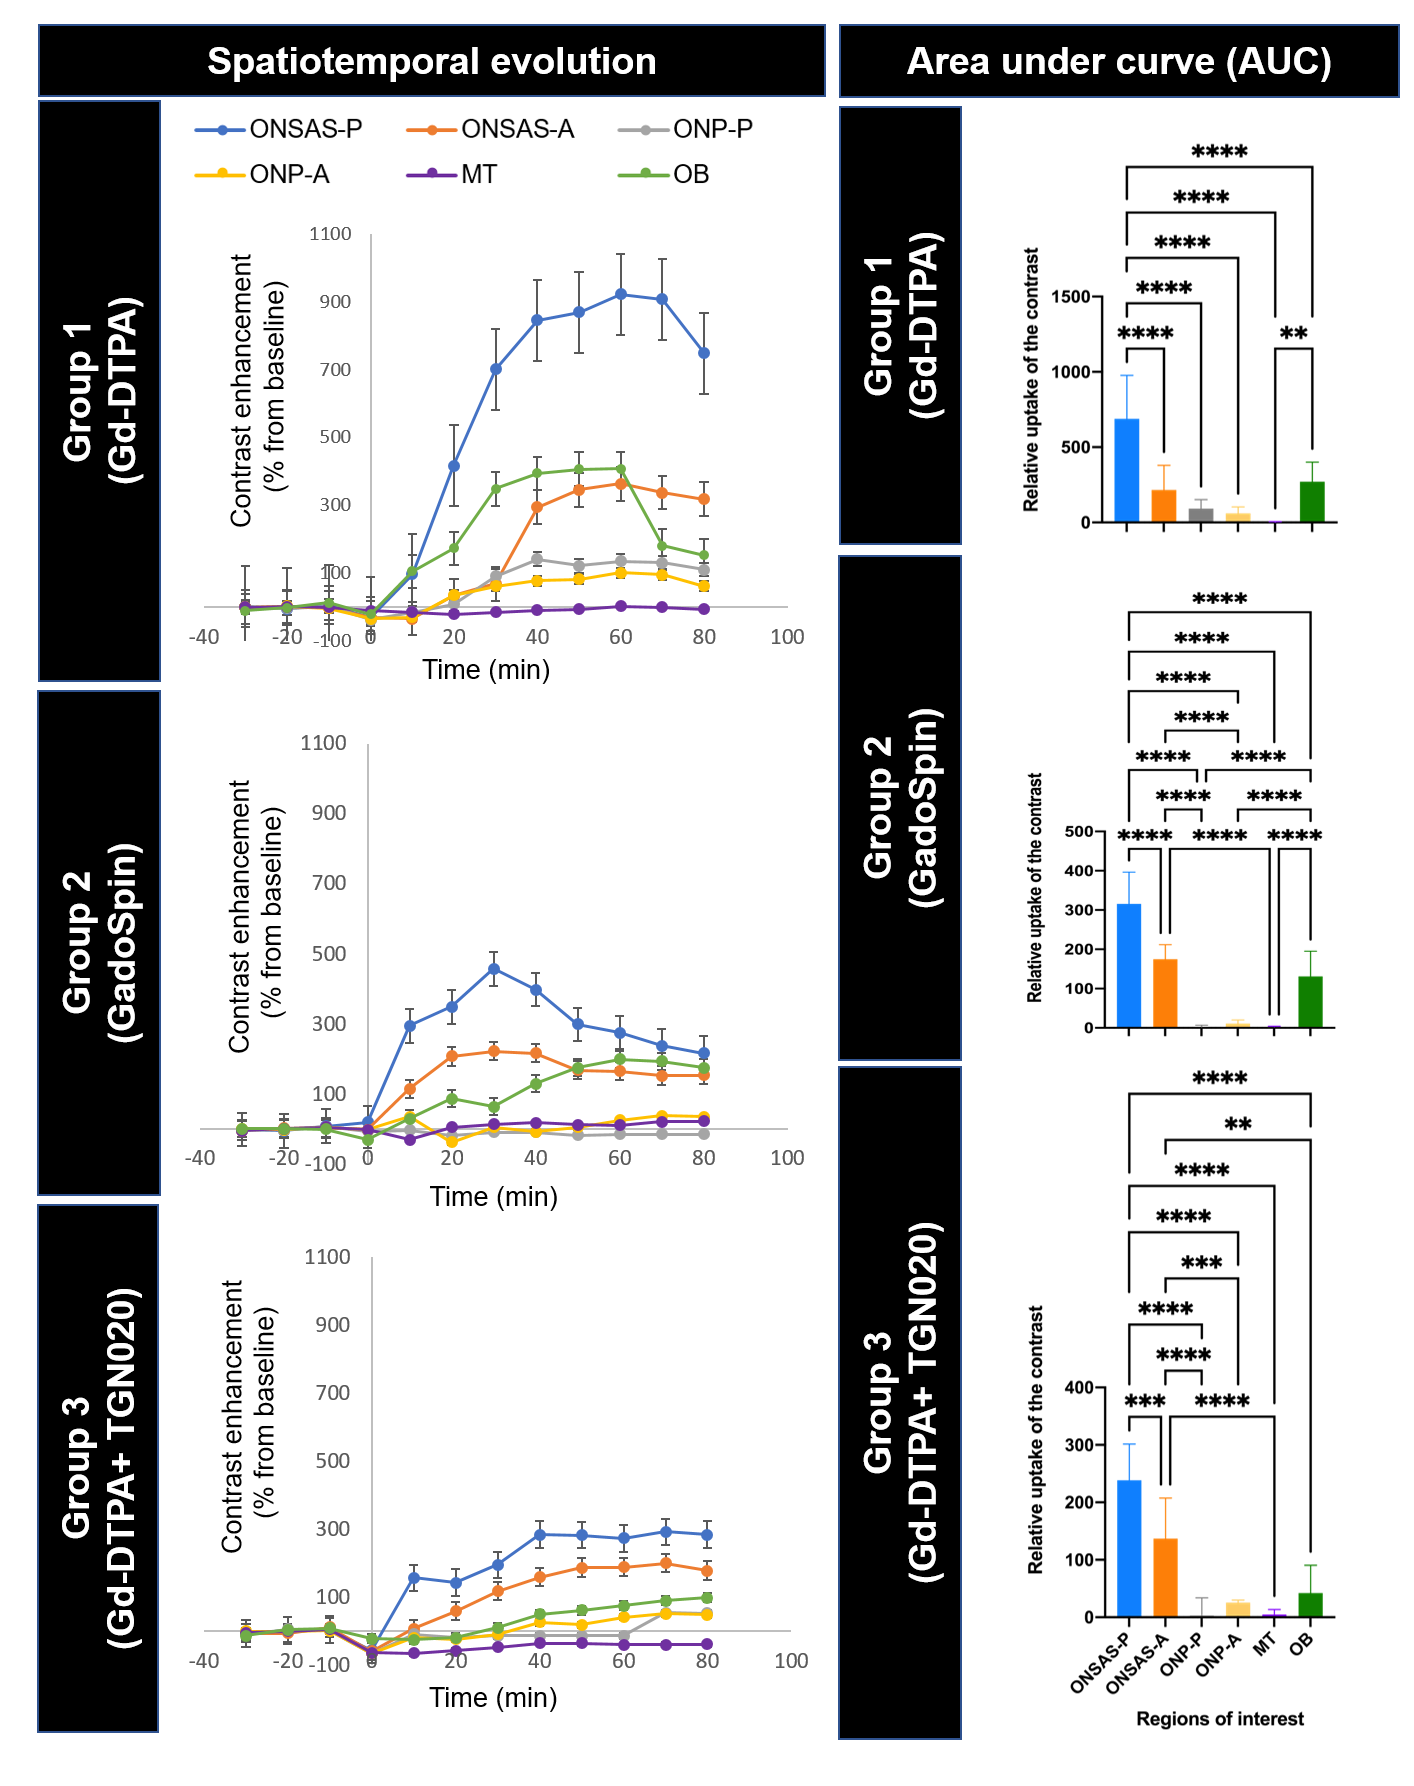
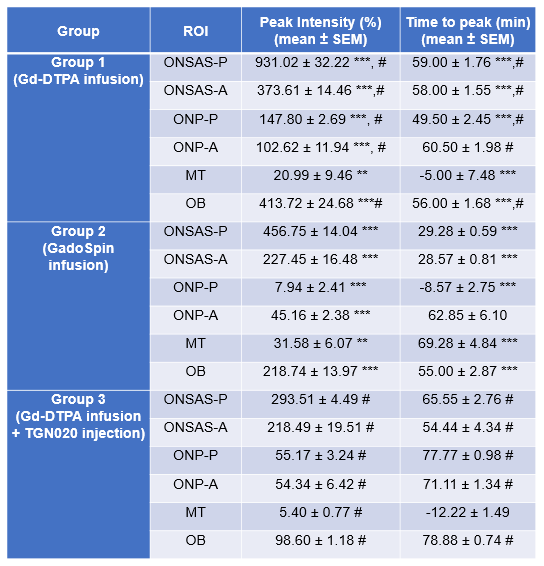
For each group, a series of one-way ANOVAs evaluating the change in contrast values (% change from baseline) over time was conducted (Figure 3). In Group 1, there was significant linear contrast enhancement over time (timepoints: 0, 10, 20, 30, 40, 50, 60, 70, 80 min from start of contrast infusion) in ONSAS-P [F(8,152)=266.234, p<.001, ηp2=.933], ONSAS-A [F(8,152)=417.546, p<.001, ηp2=.956], ONP-P [F(8,152)=390.877, p<.001, ηp2=.954], and ONP-A [F(8,152)=88.450, p<.001, ηp2=.825]. Bonferroni-corrected pairwise comparisons revealed significant increases between each subsequent timepoint (all p’s <.001) until peak intensity (Table 1) where this trend plateaued (Figure 3), and reduced to non-significant levels, with a final significant dip (all p’s<.001). In Group 2, there was significant linear contrast enhancement over time (timepoints: 0, 10, 20, 30, 40, 50, 60, 70, 80 min from start of contrast infusion) in ONSAS-P [F(8,104)=266.234, p<.001, ηp2=.933], and ONSAS-A [F(8,104)= 95.341, p<.001, ηp2=.880]. Bonferroni-corrected pairwise comparisons revealed significant increases between each subsequent timepoint in ONSAS-P and ONSAS-A (all p’s <.001) until peak intensity (Table 1) while this trend was not observed n ONP-P and ONP-A. In Group 3, there was significant linear contrast enhancement over time (timepoints: 0, 10, 20, 30, 40, 50, 60, 70, 80 minutes from start of contrast infusion) in ONSAS-P [F(8,64)=247.007, p<.001, ηp2=.969], and ONSAS-A [F(1,8)=1401.436, p<.001, ηp2=.994]. There was a delay in the enhancement (Figure 3), whereby the contrast intensity enhancement turned significant at later timepoints (Table 1). Bonferroni-corrected pairwise comparisons revealed significant increases between timepoint 60 and 80 min (all p’s <.001) until peak intensity (Table 1). A two-way mixed ANOVA between groups, with repeated measures on maximum value in each ROI showed a significant main effect of region, F(2.398, 95.925)=333.665, p<.001, ηp2=.893 (Greenhouse-Geisser corrected), a significant main effect of group contrast, F(2,40)=415.294, p<.001, ηp2=.954, and finally a significant interaction effect of region group, F(4.796,95.925)=45.584, p<.001, ηp2=.695. Pairwise comparisons showed that all contrasts (Gd-DTPA, GadoSpin, TGN020) significantly varied from one another (all p’s<.001), and all ROIs varied from one another (all p’s<.001), with the exceptions of ONSAS-A, OB, ONP-P, and ONP-A (all p’s=1).Discussion and Conclusions
Our results suggest that the ON has a paravascular waste clearance system embedded within the CSF flow and dynamics. This system has properties comparable to the brain’s glymphatic system in terms of molecular size dependency as well as relevance to the AQP4 function. These findings may give rise to the possibility of devising new drug delivery targets to the optic nerves. They may also open up new areas of research understanding neurodegenerative disorders of the visual pathways in relation to glymphatic malfunction.Acknowledgements
This work was supported in part by the National Institutes of Health R01-EY028125, P30-CA016087 and P41-EB017183 (Bethesda, Maryland); BrightFocus Foundation G2019103 (Clarksburg, Maryland); Feldstein Medical Foundation Research Grant (Clifton, New Jersey); Research to Prevent Blindness/Stavros Niarchos Foundation International Research Collaborators Award (New York, New York); and an unrestricted grant from Research to Prevent Blindness to NYU Langone Health Department of Ophthalmology (New York, New York).References
1. Iliff JJ, Wang M, Liao Y, et al. A paravascular pathway facilitates CSF flow through the brain parenchyma and the clearance of interstitial solutes, including amyloid beta. Sci Transl Med 2012;4:147ra111.
2. Mathieu E, Gupta N, Ahari A, Zhou X, Hanna J, Yucel YH. Evidence for Cerebrospinal Fluid Entry Into the Optic Nerve via a Glymphatic Pathway. Invest Ophthalmol Vis Sci 2017;58:4784-4791.
3. Wang X, Lou N, Eberhardt A, et al. An ocular glymphatic clearance system removes beta-amyloid from the rodent eye. Sci Transl Med 2020;12.
4. Deng W, Liu C, Parra C, et al. Quantitative imaging of the clearance systems in the eye and the brain. Quant Imaging Med Surg 2020;10:1-14.
5. Iliff JJ, Lee H, Yu M, et al. Brain-wide pathway for waste clearance captured by contrast-enhanced MRI. J Clin Invest 2013;123:1299-1309.
Figures