0383
The association of intracranial arterial pulsatility with enlarged perivascular spaces1Department of Radiology & Nuclear Medicine, Maastricht University Medical Center, Maastricht, Netherlands, 2School for Mental Health & Neuroscience, Maastricht University, Maastricht, Netherlands, 3Department of Psychiatry & Neuropsychology, Maastricht University, Maastricht, Netherlands, 4Department of Neurology, Maastricht University Medical Center, Maastricht, Netherlands, 5School for Cardiovascular Disease, Maastricht University, Maastricht, Netherlands, 6Department of Internal Medicine, Maastricht University Medical Center, Maastricht, Netherlands, 7Department of Electrical Engineering, Eindhoven University of Technology, Maastricht, Netherlands
Synopsis
Intracranial vessel wall alterations may lead to an increased blood flow pulsatility and the enlargement of perivascular spaces (ePVS). To examine the relationship between these measures, this 7T MRI study applied phase contrast MRI to measure blood flow velocity in the middle cerebral artery and lenticulostriate arteries (LSAs) and obtained ePVS visual rating scores. An increased LSA pulsatility index was found to be related to a higher number of ePVS in the basal ganglia and centrum semiovale. These findings are in support of underlying alterations of the cerebral small vessel wall, which influence both the ePVS and the pulsatility.
Introduction
The pulsatile behavior of cerebral arteries is thought to be an important contributing mechanism in the development of cerebrovascular diseases.1 An increased blood flow pulsatility in the small intracranial perforating arteries, such as the lenticulostriate arteries (LSAs), makes the surrounding subcortical brain tissue particularly susceptible for damage.2 Stiffening of the conduit vessel wall results in a decreased dampening of the blood flow pulse, leading to an increased pulsatility of small arterioles and deposition of kinetic energy, and the enlargement of perivascular spaces (ePVS).2,3,4,5 ePVS are markers for cerebral small vessel disease and thought to play an important role in impaired glymphatic waste clearance.3 High resolution MRI at 7 Tesla enables the visualization and velocity measurement of the LSAs, which branch of the middle cerebral artery (MCA).4,5,6 This study aimed to investigate the consequences of vessel wall alterations by examining the relation of the pulsatility index (PI), velocity and flow characteristics of both the MCA and LSA, and the associated dampening factor (DF), with the number of ePVS.Methods
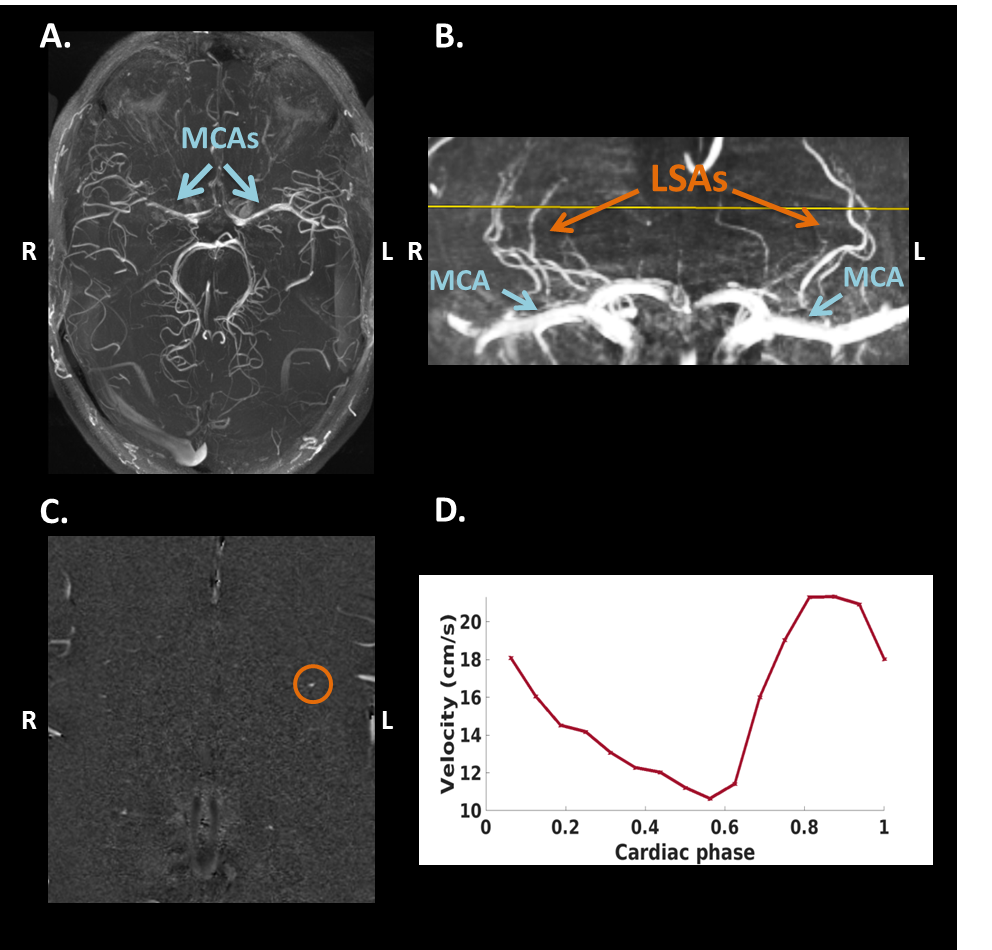
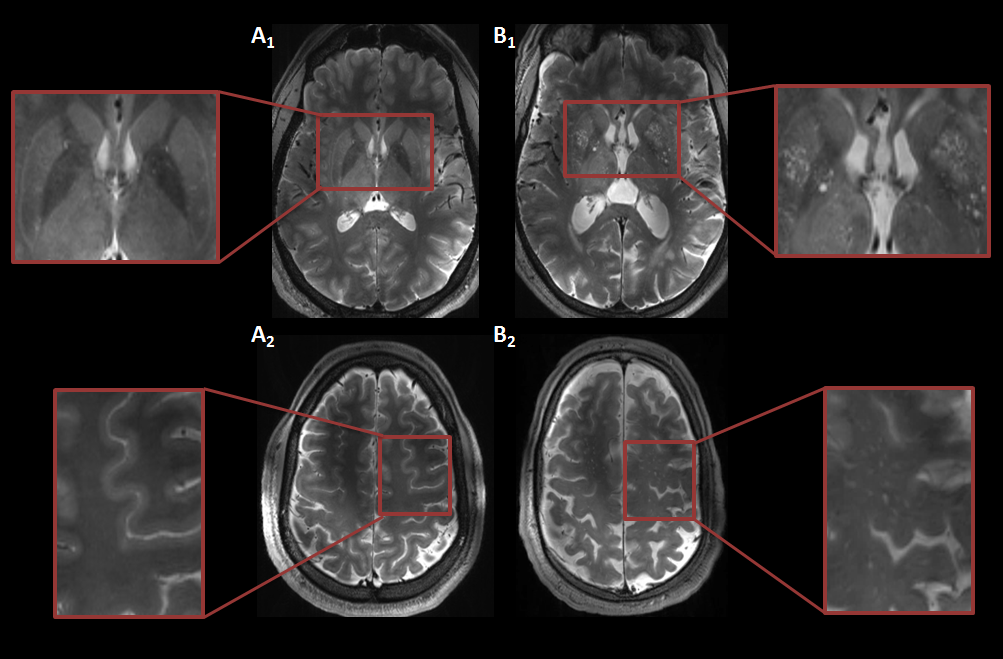
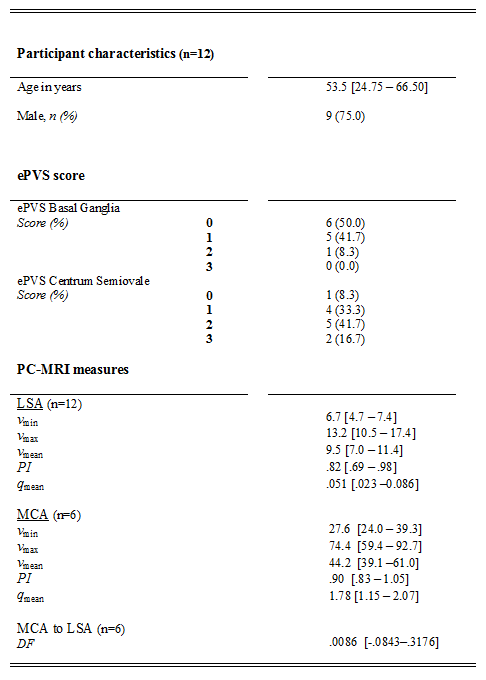
MRI acquisition: Twelve subjects (age range: 20-77 years, nine males) were included in this study. The MCA measurements were performed in a subset of six subjects (age range: 23-72 years, three males). Images were acquired with a 7T MRI system (Magnetom, Siemens Healthineers, Erlangen, Germany) with a 32-channel phased-array head coil. For the depiction of the branching and trajectories of the MCAs and LSAs, a Time-Of-Flight angiogram (Fig.1A) was acquired (TR/TE=15.0/5.1 ms, flip angle=18⁰, cubic voxel size=0.31 mm, bandwidth=78 Hz/pixel, and field-of-view=135x180 mm2). Maximum intensity projections were calculated for the geometrical planning of the LSA slice (Fig.1B). A prospectively gated 2D PC sequence was applied for the velocity measurements of the MCA (TR/TE=44.5/4.1 ms, flip angle=27⁰, pixel size=0.28x0.28 mm2, slice thickness=2.0 mm, bandwidth=434 Hz/pixel, and field-of-view=180x180 mm2). Twenty cardiac phases were obtained in one heart cycle. An additional prospectively gated 2D PC sequence (TR/TE=50-70/4-5 ms, flip angle=26⁰, pixel size=0.31x0.31 mm2, slice thickness 2.6 mm, VENC=30 cm/s, and bandwidth=181-280 Hz/pixel) was applied, which was planned perpendicular to the spatial trajectories of as many LSAs as possible. The bandwidth and TR were chosen as low as possible, but high enough to ensure that a minimum of 16 cardiac phases were obtained, with visually sufficient signal-to-noise. For visualization of the ePVS, T2-weighted turbo spin echo images were acquired (TR/TE=4000.0/283.0 ms, flip angle=120⁰, pixel size=0.6x0.6 mm2, voxel size=2.0 mm, bandwidth=372 Hz/pixel, and field-of-view=192x192 mm2, 104 slices).Image analysis: The largest LSA and the MCA located in the same hemisphere were processed to assess the blood flow velocity measures. First, correction for background noise and aliasing were applied. The vessel area, required as input for the calculation of the flow (q), was quantified based on the magnitude images. The PI was calculated using Gosling’s equation: $$$PI = \frac{v_{max}-v_{min}}{v_{mean}}$$$, where v represents peak velocity.7 The DF was calculated by subtracting the PI in the LSA from the PI in the MCA. The ePVS were rated in one hemisphere in the basal ganglia (BG) and centrum semiovale (CSO) based on 4 groups: 0≤10, 1=10-25, 2=25-40, 3≥40 ePVS (Fig.2).8 Consensus scoring was performed on the T2-weighted images by three raters, including two neuroscientists who had received training and an experienced neuroradiologist.
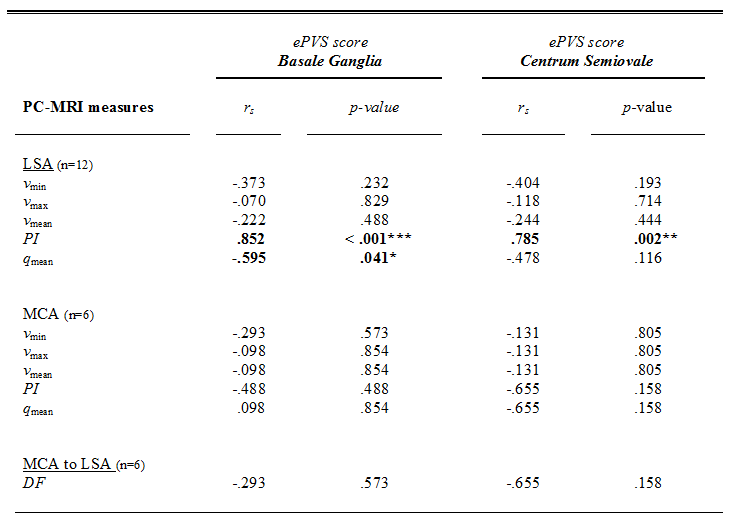
Statistics: Spearman’s rho correlations were computed between the ePVS scores and the PI, DF, flow and velocity characteristics in the MCA and the LSA (IBM SPSS statistics version 25).
Results
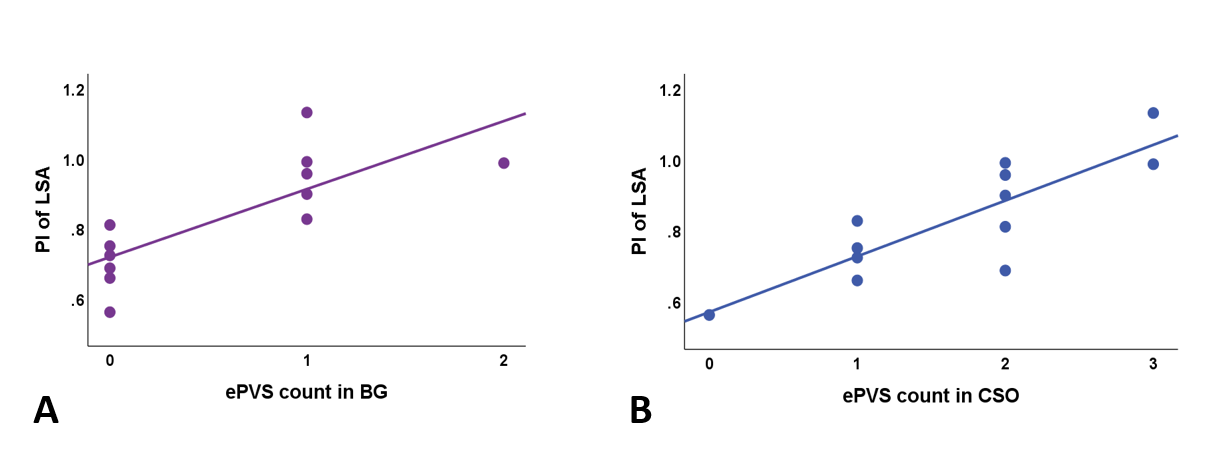
An example of an acquired blood flow velocity profile of the LSA is shown in Figure 1D. Table 1 provides information on the demographics and descriptive statistics of the PI, DF, velocity and flow characteristics. Table 2 shows the Spearman’s rho correlations between the ePVS scores and the characteristics of the MCA and the LSA. Interestingly, the PI of the LSA is associated to ePVS score in both the BG and CSO (Fig.3). Furthermore, a relation was identified between the qmean of the LSA and the ePVS score in the BG. No other significant associations were found.Discussion and Conclusion
The PI of the LSA was found to be associated to the ePVS count in both the BG and CSO. This finding is in support of underlying alterations of the cerebral small vessel wall, which are of influence on both the ePVS and the pulsatility. Another association was found for the qmean and the ePVS count, which is in line with the occurrence of hypoperfusion as suggested in cSVD.9,10 In contrast, this study was unable to confirm previous findings showing an association between the PI of the MCA and ePVS score, which may be explained by the limited sample size for the MCA measurements.11 More data is currently being acquired, which will allow to investigate the influence of the DF on the ePVS in more detail.In conclusion, this study examined the consequences of vessel wall alterations, and found an association between the pulsatility index in the LSA and the number of ePVS.
Acknowledgements
The first two authors contributed equally to this work.References
1. Mitchell GF. Effects of central arterial aging on the structure and function of the peripheral vasculature: implications for end-organ damage. J Appl Physiol. november 2008;105(5):1652–60.
2. Iadecola C, Gottesman RF. Neurovascular and Cognitive Dysfunction in Hypertension: Epidemiology, Pathobiology, and Treatment. Circ Res. 29 maart 2019;124(7):1025–44.
3. Mestre H, Kostrikov S, Mehta RI, Nedergaard M. Perivascular spaces, glymphatic dysfunction, and small vessel disease. Clin Sci. 1 september 2017;131(17):2257–74.
4. Schnerr RS, Jansen JFA, Uludag K, Hofman PAM, Wildberger JE, van Oostenbrugge RJ, e.a. Pulsatility of Lenticulostriate Arteries Assessed by 7 Tesla Flow MRI—Measurement, Reproducibility, and Applicability to Aging Effect. Front Physiol. 24 november 2017;8:961.
5. Kang C-K, Park C-A, Lee DS, Lee Y-B, Park C-W, Kim Y-B, e.a. Velocity measurement of microvessels using phase-contrast magnetic resonance angiography at 7 tesla MRI: Velocity Measurement of Microvessels. Magn Reson Med. april 2016;75(4):1640–6.
6. Bouvy WH, Geurts LJ, Kuijf HJ, Luijten PR, Kappelle LJ, Biessels GJ, e.a. Assessment of blood flow velocity and pulsatility in cerebral perforating arteries with 7-T quantitative flow MRI: Blood Flow Velocity And Pulsatility In Cerebral Perforating Arteries. NMR Biomed. september 2016;29(9):1295–304.
7. Gosling RG, King DH. The Role of Measurement in Peripheral Vascular Surgery: Arterial Assessment by Doppler-shift Ultrasound. Proc R Soc Med. juni 1974;67(6P1):447–9.
8. Klarenbeek P, van Oostenbrugge RJ, Rouhl RPW, Knottnerus ILH, Staals J. Ambulatory Blood Pressure in Patients With Lacunar Stroke: Association With Total MRI Burden of Cerebral Small Vessel Disease. Stroke. november 2013;44(11):2995–9.
9. Pantoni L. Cerebral small vessel disease: from pathogenesis and clinical characteristics to therapeutic challenges. Lancet Neurol. juli 2010;9(7):689–701.
10. Blair GW, Hernandez MV, Thrippleton MJ, Doubal FN, Wardlaw JM. Advanced Neuroimaging of Cerebral Small Vessel Disease. Curr Treat Options Cardiovasc Med. juli 2017;19(7):56.
11. Nam K-W, Kwon H-M, Lee Y-S. Distinct association between cerebral arterial pulsatility and subtypes of cerebral small vessel disease. Mogi M, redacteur. PLOS ONE. 16 juli 2020;15(7):e0236049.
Figures