0382
Fast whole brain MR imaging of dynamic susceptibility contrast changes in the CSF (cDSC MRI)1Johns Hopkins University, Baltimore, MD, United States, 2Kennedy Krieger Institute, Baltimore, MD, United States
Synopsis
The circulation of cerebrospinal fluid (CSF) influences various aspects of brain physiology. This study aims to develop and optimize MRI sequences that can detect dynamic signal changes in the CSF after Gd administration with a sub-millimeter spatial resolution, temporal resolution of <10s, and whole brain coverage. Bloch simulations were performed to determine optimal imaging parameters. Simulations were validated with phantom scans. An optimized turbo-spin-echo (TSE) sequence was performed on healthy volunteers on 3T and 7T. In human scans, dynamic signal changes after Gd injection in the CSF were detected at location where cerebral lymphatic vessels were identified in previous studies.
Introduction:
The circulation of cerebrospinal fluid (CSF) influences various aspects of brain physiology. Cerebral lymphatic vessels are believed to play an important role in the drainage of CSF into the cervical lymph nodes (1-6), which has intriguing clinical implications for the clearance of abnormal protein and other products in many brain diseases. Recent studies have shown that some meningeal lymphatic vessels in the brain can be visualized using MRI with Gd contrast in human brains (6). However, most studies to date adopt anatomical scans such as FLAIR which typically take at least a few minutes to achieve whole brain coverage and sufficient spatial resolution. The purpose of the current study is to develop an MRI sequence which can image dynamic Gd-based signal changes in the CSF with a sub-millimeter spatial resolution, a temporal resolution of <10s and whole-brain coverage. Here, we demonstrate the theoretical calculations, phantom validations and initial results in healthy human subjects with this proposed MRI approach for dynamic susceptibility contrast in the CSF (cDSC) (7).Methods:
A 3D turbo-spin-echo (TSE) sequence was adopted and modified to achieve the following goals:1. long TE (>600ms) was used to minimize signals from grey matter (GM), white matter (WM) and blood, and separate the CSF signal from the rest of the brain.
2. Gd shortens both T1 and T2 in the CSF, which affects the TSE signal oppositely. Therefore, two types of sequences were evaluated: T1-dominant sequences that furnish a positive contrast (increased signal after Gd injection) and T2-dominant sequences that furnish a negative contrast (decreased signal after Gd injection) in the CSF.
3. To avoid the extravascular effects from Gd, a spin-echo based sequence was adopted.
4. To get whole brain coverage with a temporal resolution of <10s and a sub-millimeter spatial resolution, the CS-SENSE technique (8,9) was used to accelerate the acquisition.
Bloch simulations were performed to optimize the proposed pulse sequence above. Phantom scans were performed to validate the simulations.
Ten healthy volunteers were recruited for this study. The following scans were performed on 3T (Philips): 1) FLAIR: TR/TI/TE=4800/1650/307ms, voxel=1mm isotropic; 2) 3D TSE: TR/TE= 9000/1289ms, voxel=0.75mm isotropic, during which Gd contrast (Prohance) was administered; 3) post-Gd FLAIR; and on 7T: 1) MPRAGE: TR/TI/TE=4.0/1000/1.8ms, voxel=1mm isotropic; 2) 3D TSE during Gd: TR/TE=9000/1187ms, voxel=0.75mm isotropic; 3) post-Gd MPRAGE.Data analysis: 3D-TSE images were motion corrected and co-registered with anatomical images. Regions-of-interest were manually delineated where cerebral lymphatic vessels have been identified in human brain (6).
Results and Discussion:
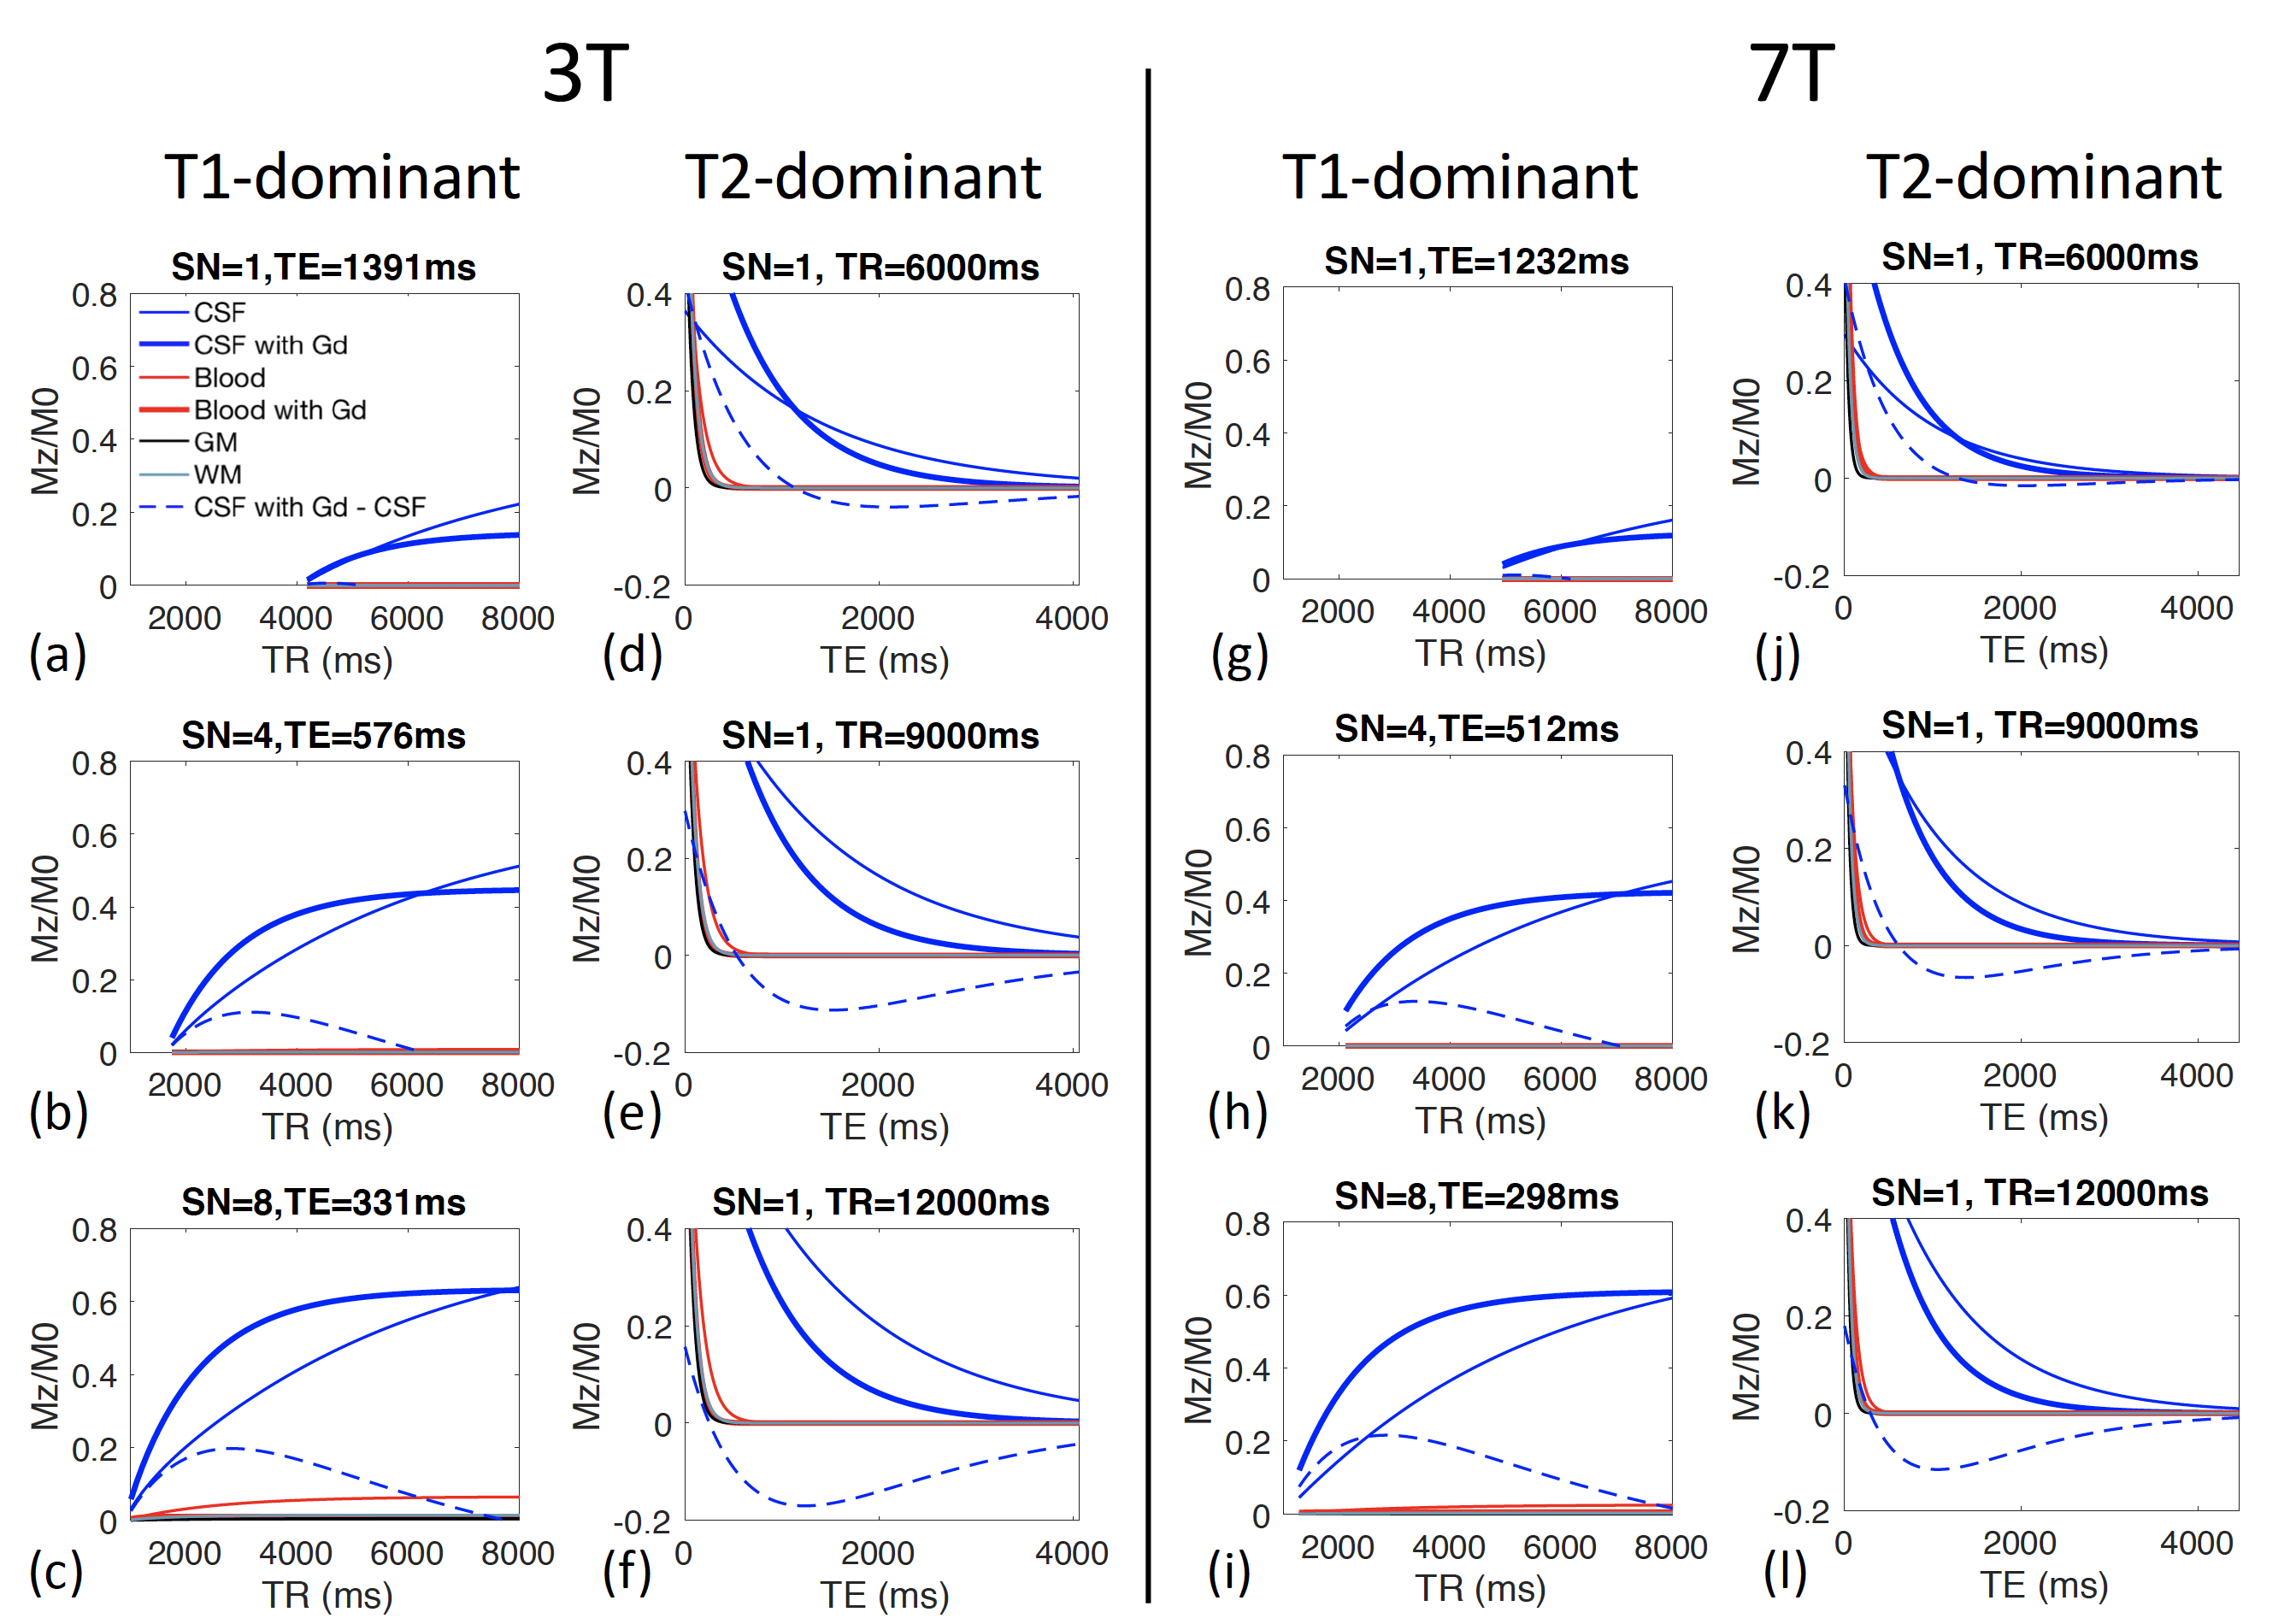
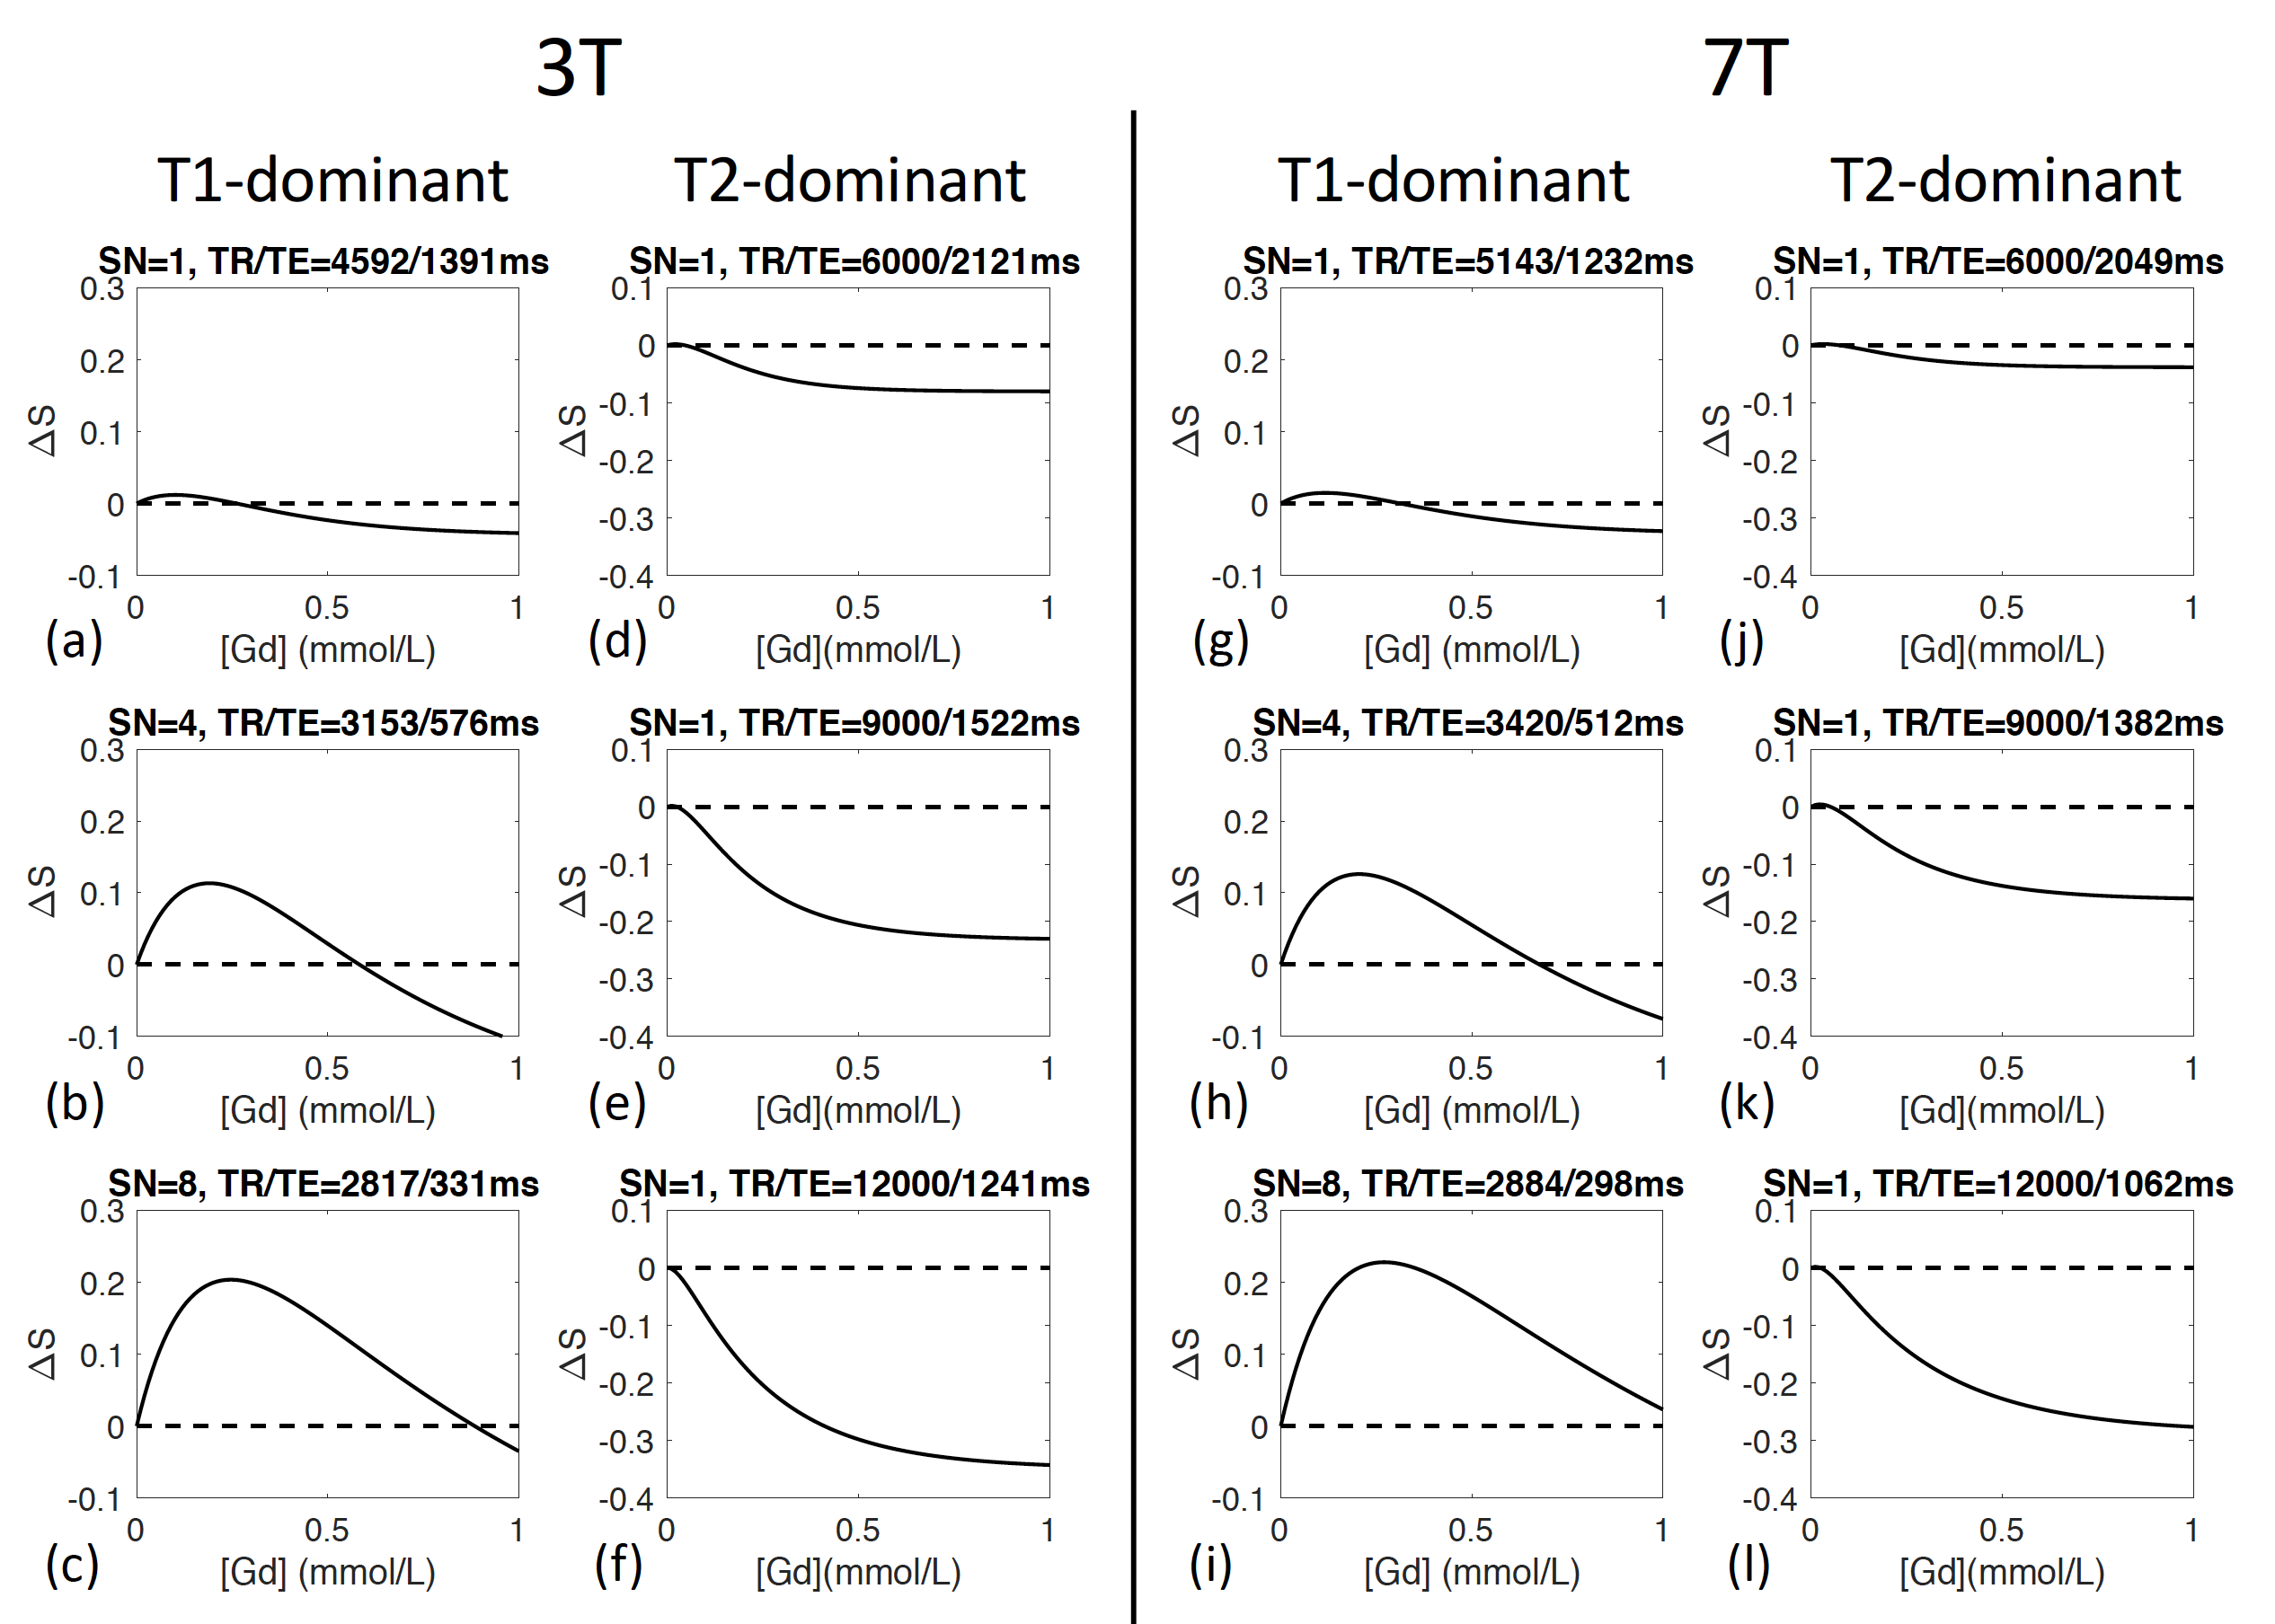
In the proposed 3D-TSE sequence, three key parameters can be adjusted to maximize the signal contrast in CSF before and after Gd injection: shot number, TR, and TE. Simulations for T1-dominant sequences (Figures 1(a-c)) show that the contrasts in CSF signals before and after Gd injection peak at relatively short TRs for a given shot number, and the maximum contrast increases with shot number. Simulations for T2-dominant sequences (Figures 1(d-f)) show that the contrasts in CSF signals before and after Gd injection peak at long TEs, and the maximum contrast increases with TR. Simulations for 7T (Figures 1(g-l)) show similar effects.Gd concentration ([Gd]) can affect MR signals substantially. Figure 2 shows that the CSF contrast in T1-dominant sequences have a biphasic relationship with [Gd], whereas in T2-dominant sequences, the CSF contrast increases monotonically with [Gd]. When the in vivo [Gd] is uncertain, a biphasic relationship can be problematic while a monotonic relationship may provide a method to estimate the [Gd]. Therefore, the T2-dominant 3D-TSE sequence was chosen for subsequent human scans.
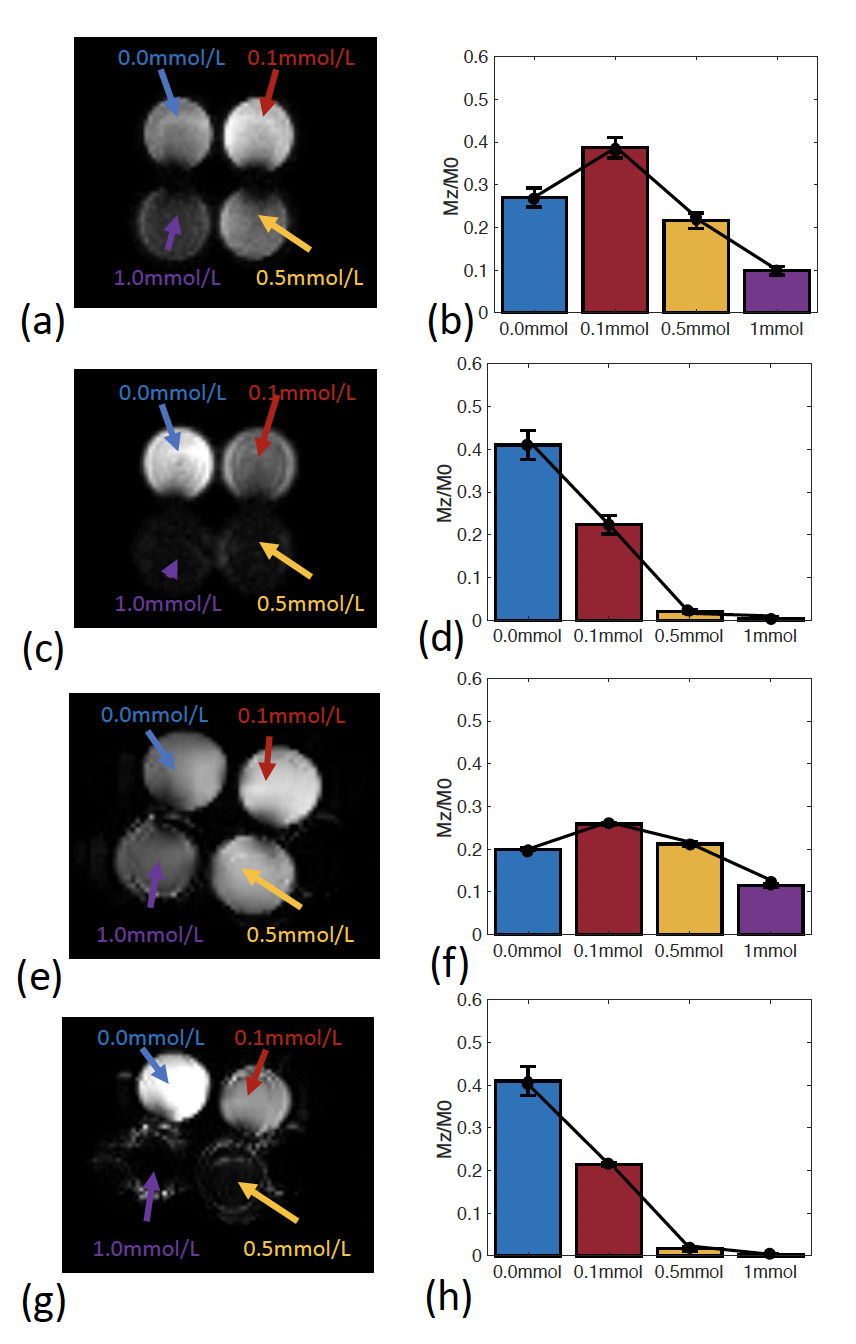
Figure 3 demonstrates the agreement between phantoms scans on 3T and 7T and the simulations.
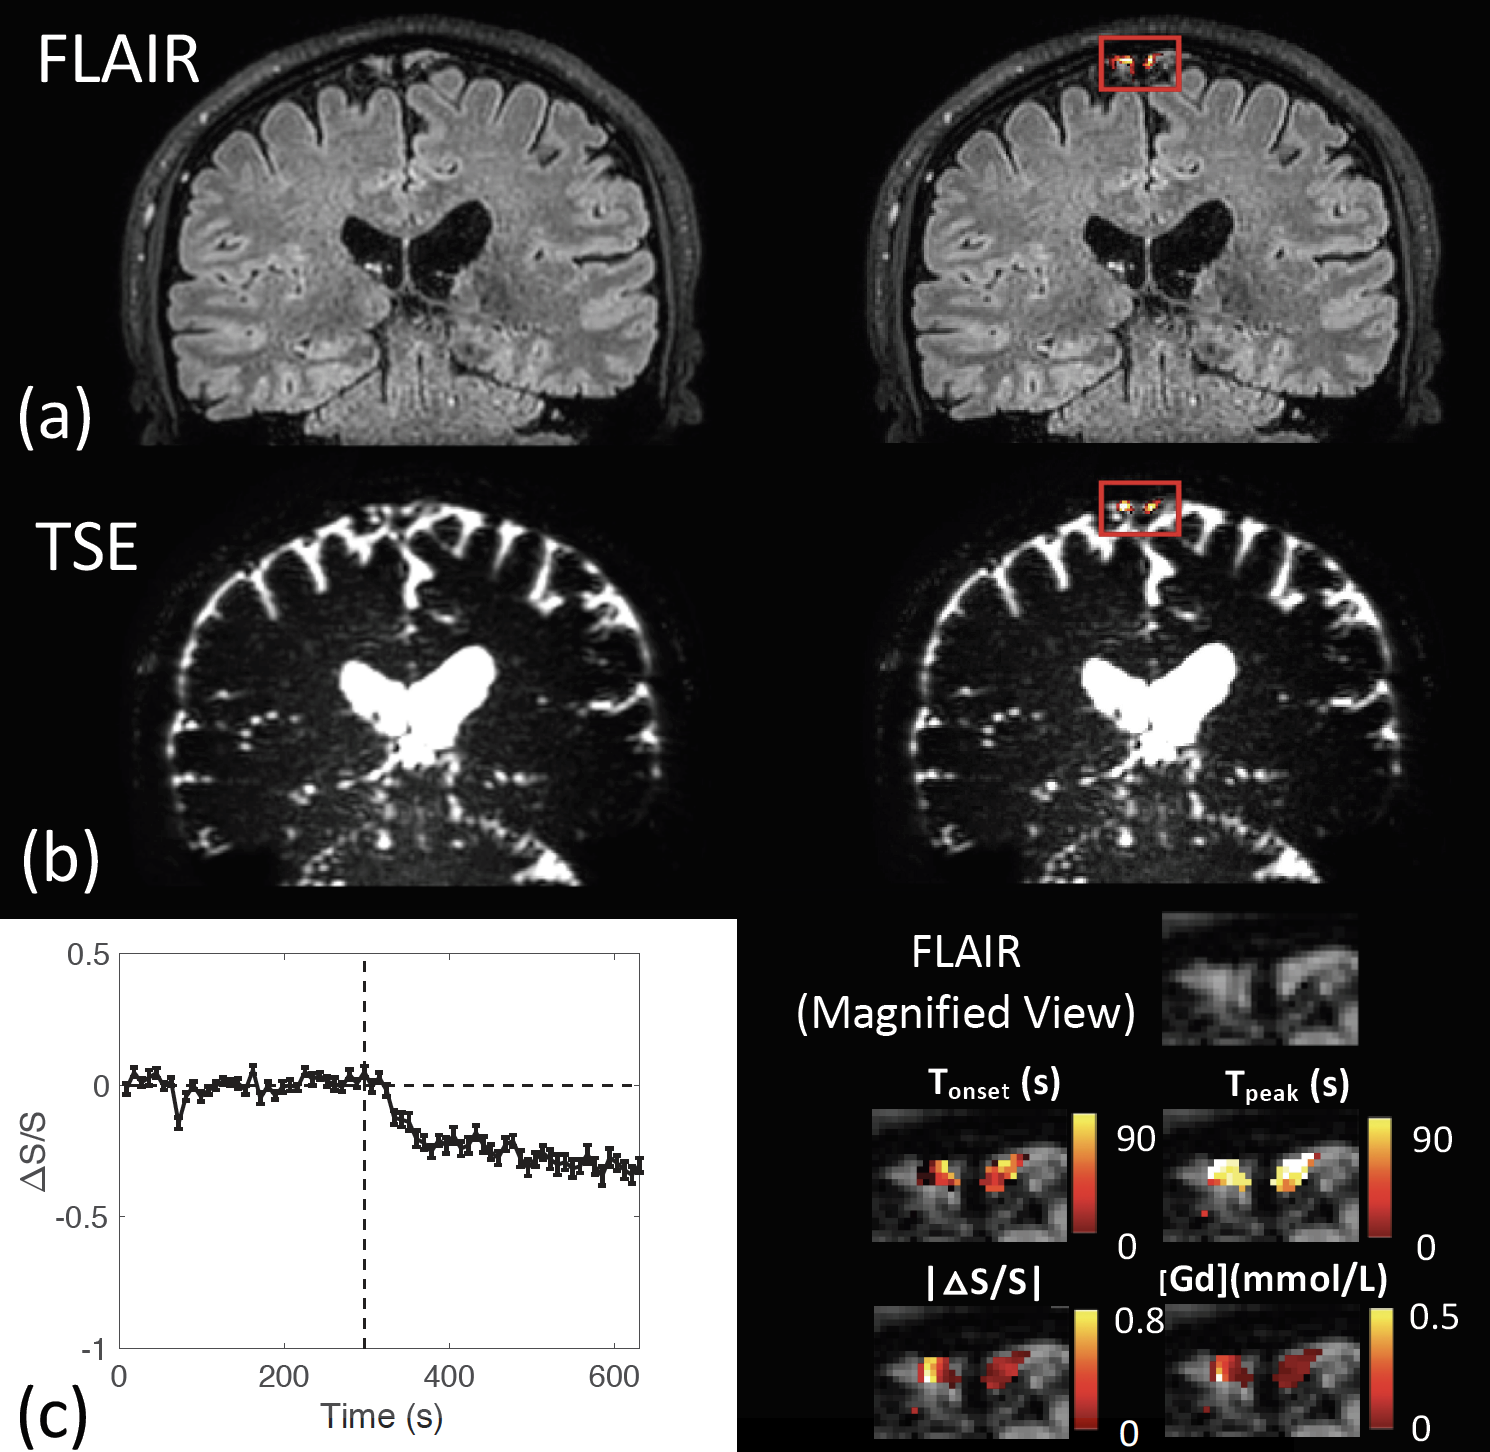
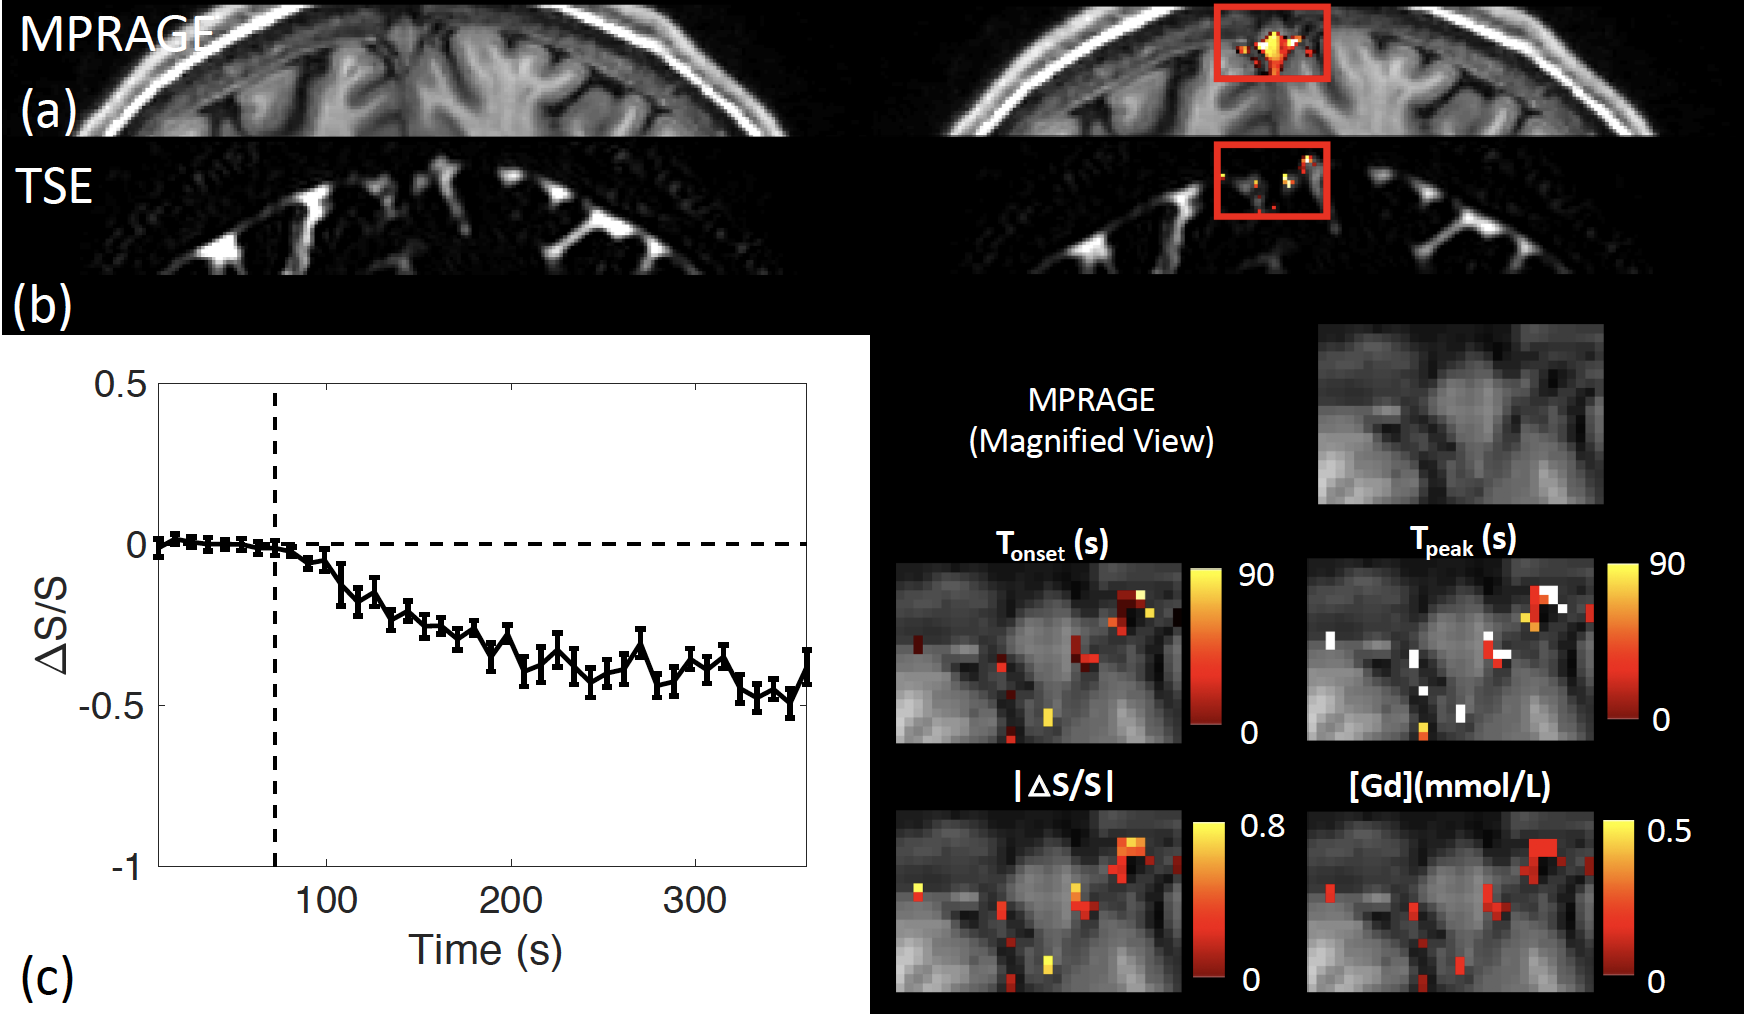
Figure 4 shows typical 3T results from one participant in the regions around the dural sinuses, where cerebral lymphatic vessels have been identified in human brains. CSF signal changes after Gd injection were detected in FLAIR (Figure 4(a)) similar to previous studies (6), as well as in the proposed 3D-TSE sequence in the current study (Figure 4(b)). Figure 4(c) shows the average time course detected using the T2-dominant 3D-TSE sequence from the region, and four maps of the following parameters extracted from the time courses: onset time (Tonset), time to peak (Tpeak), absolute value of relative signal change |ΔS/S| between pre- and post-Gd, and [Gd] estimated from ΔS/S.
Figure 5 shows typical 7T results from one participant, which showed similar effects as 3T.
Conclusion
We demonstrate a 3D-TSE sequence with an optimized contrast for the detection of Gd induced MR signal changes in the CSF with a sub-millimeter spatial resolution, a temporal resolution of <10s and whole-brain coverage. Our initial results in healthy human subjects demonstrate that the proposed method can detect dynamic signal changes after Gd injection in the CSF at locations where cerebral lymphatic vessels have previously been visualized using Gd enhanced FLAIR images (6).Acknowledgements
This project was supported by the National Institutes of Health through grants from the NINDS (1R01NS108452), the NIBIB (R21EB023538 and P41 EB015909) and the NICHD (U54 HD079123), and the Department of Defense through the grant PD160104.References
1. Aspelund A, Antila S, Proulx ST, Karlsen TV, Karaman S, Detmar M, Wiig H, Alitalo K. A dural lymphatic vascular system that drains brain interstitial fluid and macromolecules. J Exp Med 2015;212(7):991-999.
2. Louveau A, Smirnov I, Keyes TJ, Eccles JD, Rouhani SJ, Peske JD, Derecki NC, Castle D, Mandell JW, Lee KS, Harris TH, Kipnis J. Structural and functional features of central nervous system lymphatic vessels. Nature 2015;523(7560):337-341.
3. Patel TK, Habimana-Griffin L, Gao X, Xu B, Achilefu S, Alitalo K, McKee CA, Sheehan PW, Musiek ES, Xiong C, Coble D, Holtzman DM. Dural lymphatics regulate clearance of extracellular tau from the CNS. Mol Neurodegener 2019;14(1):11.
4. Da Mesquita S, Fu Z, Kipnis J. The Meningeal Lymphatic System: A New Player in Neurophysiology. Neuron 2018;100(2):375-388.
5. Louveau A, Herz J, Alme MN, Salvador AF, Dong MQ, Viar KE, Herod SG, Knopp J, Setliff JC, Lupi AL, Da Mesquita S, Frost EL, Gaultier A, Harris TH, Cao R, Hu S, Lukens JR, Smirnov I, Overall CC, Oliver G, Kipnis J. CNS lymphatic drainage and neuroinflammation are regulated by meningeal lymphatic vasculature. Nat Neurosci 2018;21(10):1380-1391.
6. Absinta M, Ha SK, Nair G, Sati P, Luciano NJ, Palisoc M, Louveau A, Zaghloul KA, Pittaluga S, Kipnis J, Reich DS. Human and nonhuman primate meninges harbor lymphatic vessels that can be visualized noninvasively by MRI. eLife 2017;6.
7. Cao D, Kang N, Pillai JJ, Miao X, Paez A, Xu X, Xu J, Li X, Qin Q, Van Zijl PCM, Barker P, Hua J. Fast whole brain MR imaging of dynamic susceptibility contrast changes in the cerebrospinal fluid (cDSC MRI). Magn Reson Med 2020.
8. Lustig M, Donoho D, Pauly JM. Sparse MRI: The application of compressed sensing for rapid MR imaging. Magn Reson Med 2007;58(6):1182-1195.
9. Liang D, Liu B, Wang J, Ying L. Accelerating SENSE using compressed sensing. Magn Reson Med 2009;62(6):1574-1584.
Figures