0380
Visually-evoked cerebrospinal fluid flow in the human brain during wakefulness1Psychological and Brain Sciences, Boston University, Boston, MA, United States, 2Biomedical Engineering, Boston University, Boston, MA, United States, 3Boston University, Boston, MA, United States
Synopsis
Cerebrospinal fluid (CSF) flow is essential for brain health, and previous studies have shown that it is driven by systemic physiological factors, such as breathing. Recent work has shown that neural activity is coupled to CSF flow during sleep, but whether this relationship reflects a causal link has not been tested. Here we investigated whether driving neural activity can induce changes in CSF flow. We found that we could induce CSF flow in the human brain during the awake state by manipulating hemodynamics with stimulus-evoked neural activity.
Introduction
During wakefulness, CSF flow is driven by a variety of systemic physiological factors such as respiration and the cardiac cycle1,2,3. During stage 2 non-rapid eye movement sleep, large waves of CSF flow appear, and this CSF inflow is coupled to slow waves in neural activity and blood oxygenation4. This coupling suggests that neural activity may also modulate CSF flow, via its entrainment of blood volume changes that displace CSF, but this causal link has not yet been tested, and neural slow waves are also coupled to systemic physiology5. We hypothesized that we could evoke CSF flow by driving neural activity with visual stimuli. We performed three experiments to test this hypothesis, using high-contrast flickering checkerboard visual stimuli to induce widespread neural activity and BOLD responses.Methods
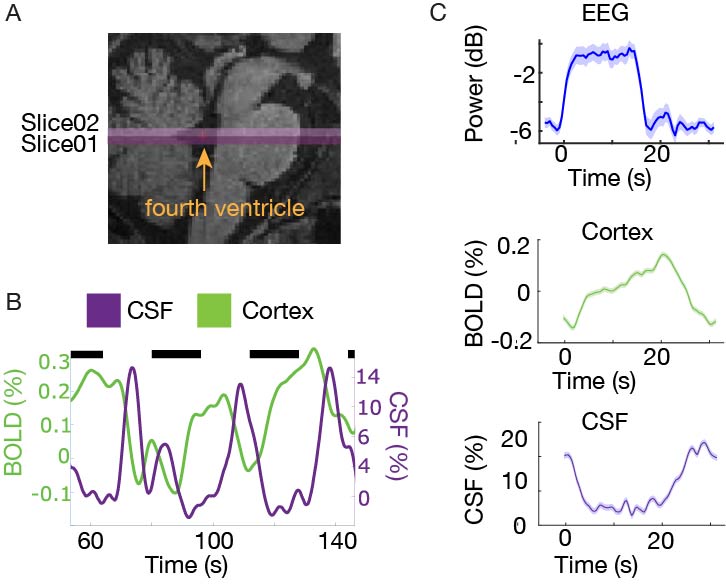
We measured neural, hemodynamic, and CSF inflow signals in response to flickering checkerboard stimuli. All imaging sessions included a multi-echo MPRAGE6 scan for anatomical localization. In each study, to measure CSF inflow, we positioned the bottom slice of our fMRI acquisition volume in the fourth ventricle (Fig. 1a). This positioning enables detection of flow-related enhancement signals linked to CSF velocity in the ventricle4. We manually traced the intersection of the fourth ventricle with the bottom slice of the imaging volume for each run, and the mean signal as the CSF inflow signal. We defined the cortical gray matter using the automated Freesurfer segmentation and extracted the mean cortical BOLD signal, to determine overall hemodynamic response amplitude.In Experiment 1, we used simultaneous fast fMRI and electroencephalography (EEG) in 6 subjects. EEG was acquired using MR-compatible 256-channel nets (Electrical Geodesics, Inc., Eugene, OR USA) at a sampling rate of 1000 Hz. Scans were performed on a 3T Siemens Prisma scanner using single-shot gradient echo SMS-EPI7, with TR=0.367 s, 2.5 mm3 isotropic, 40 slices, Multiband factor=8, matrix=92×92, blipped CAIPI shift=FOV/4, flip angle=32-37°, and no in-plane acceleration. Each task run lasted 254 seconds, with fixed 16 second ON and 16 second OFF periods. The frequency of the flickering checkboard varied across runs (1-12 Hz). Participants were asked to fixate on a dot at the center of the checkerboard, and press a button when they detected a color change.
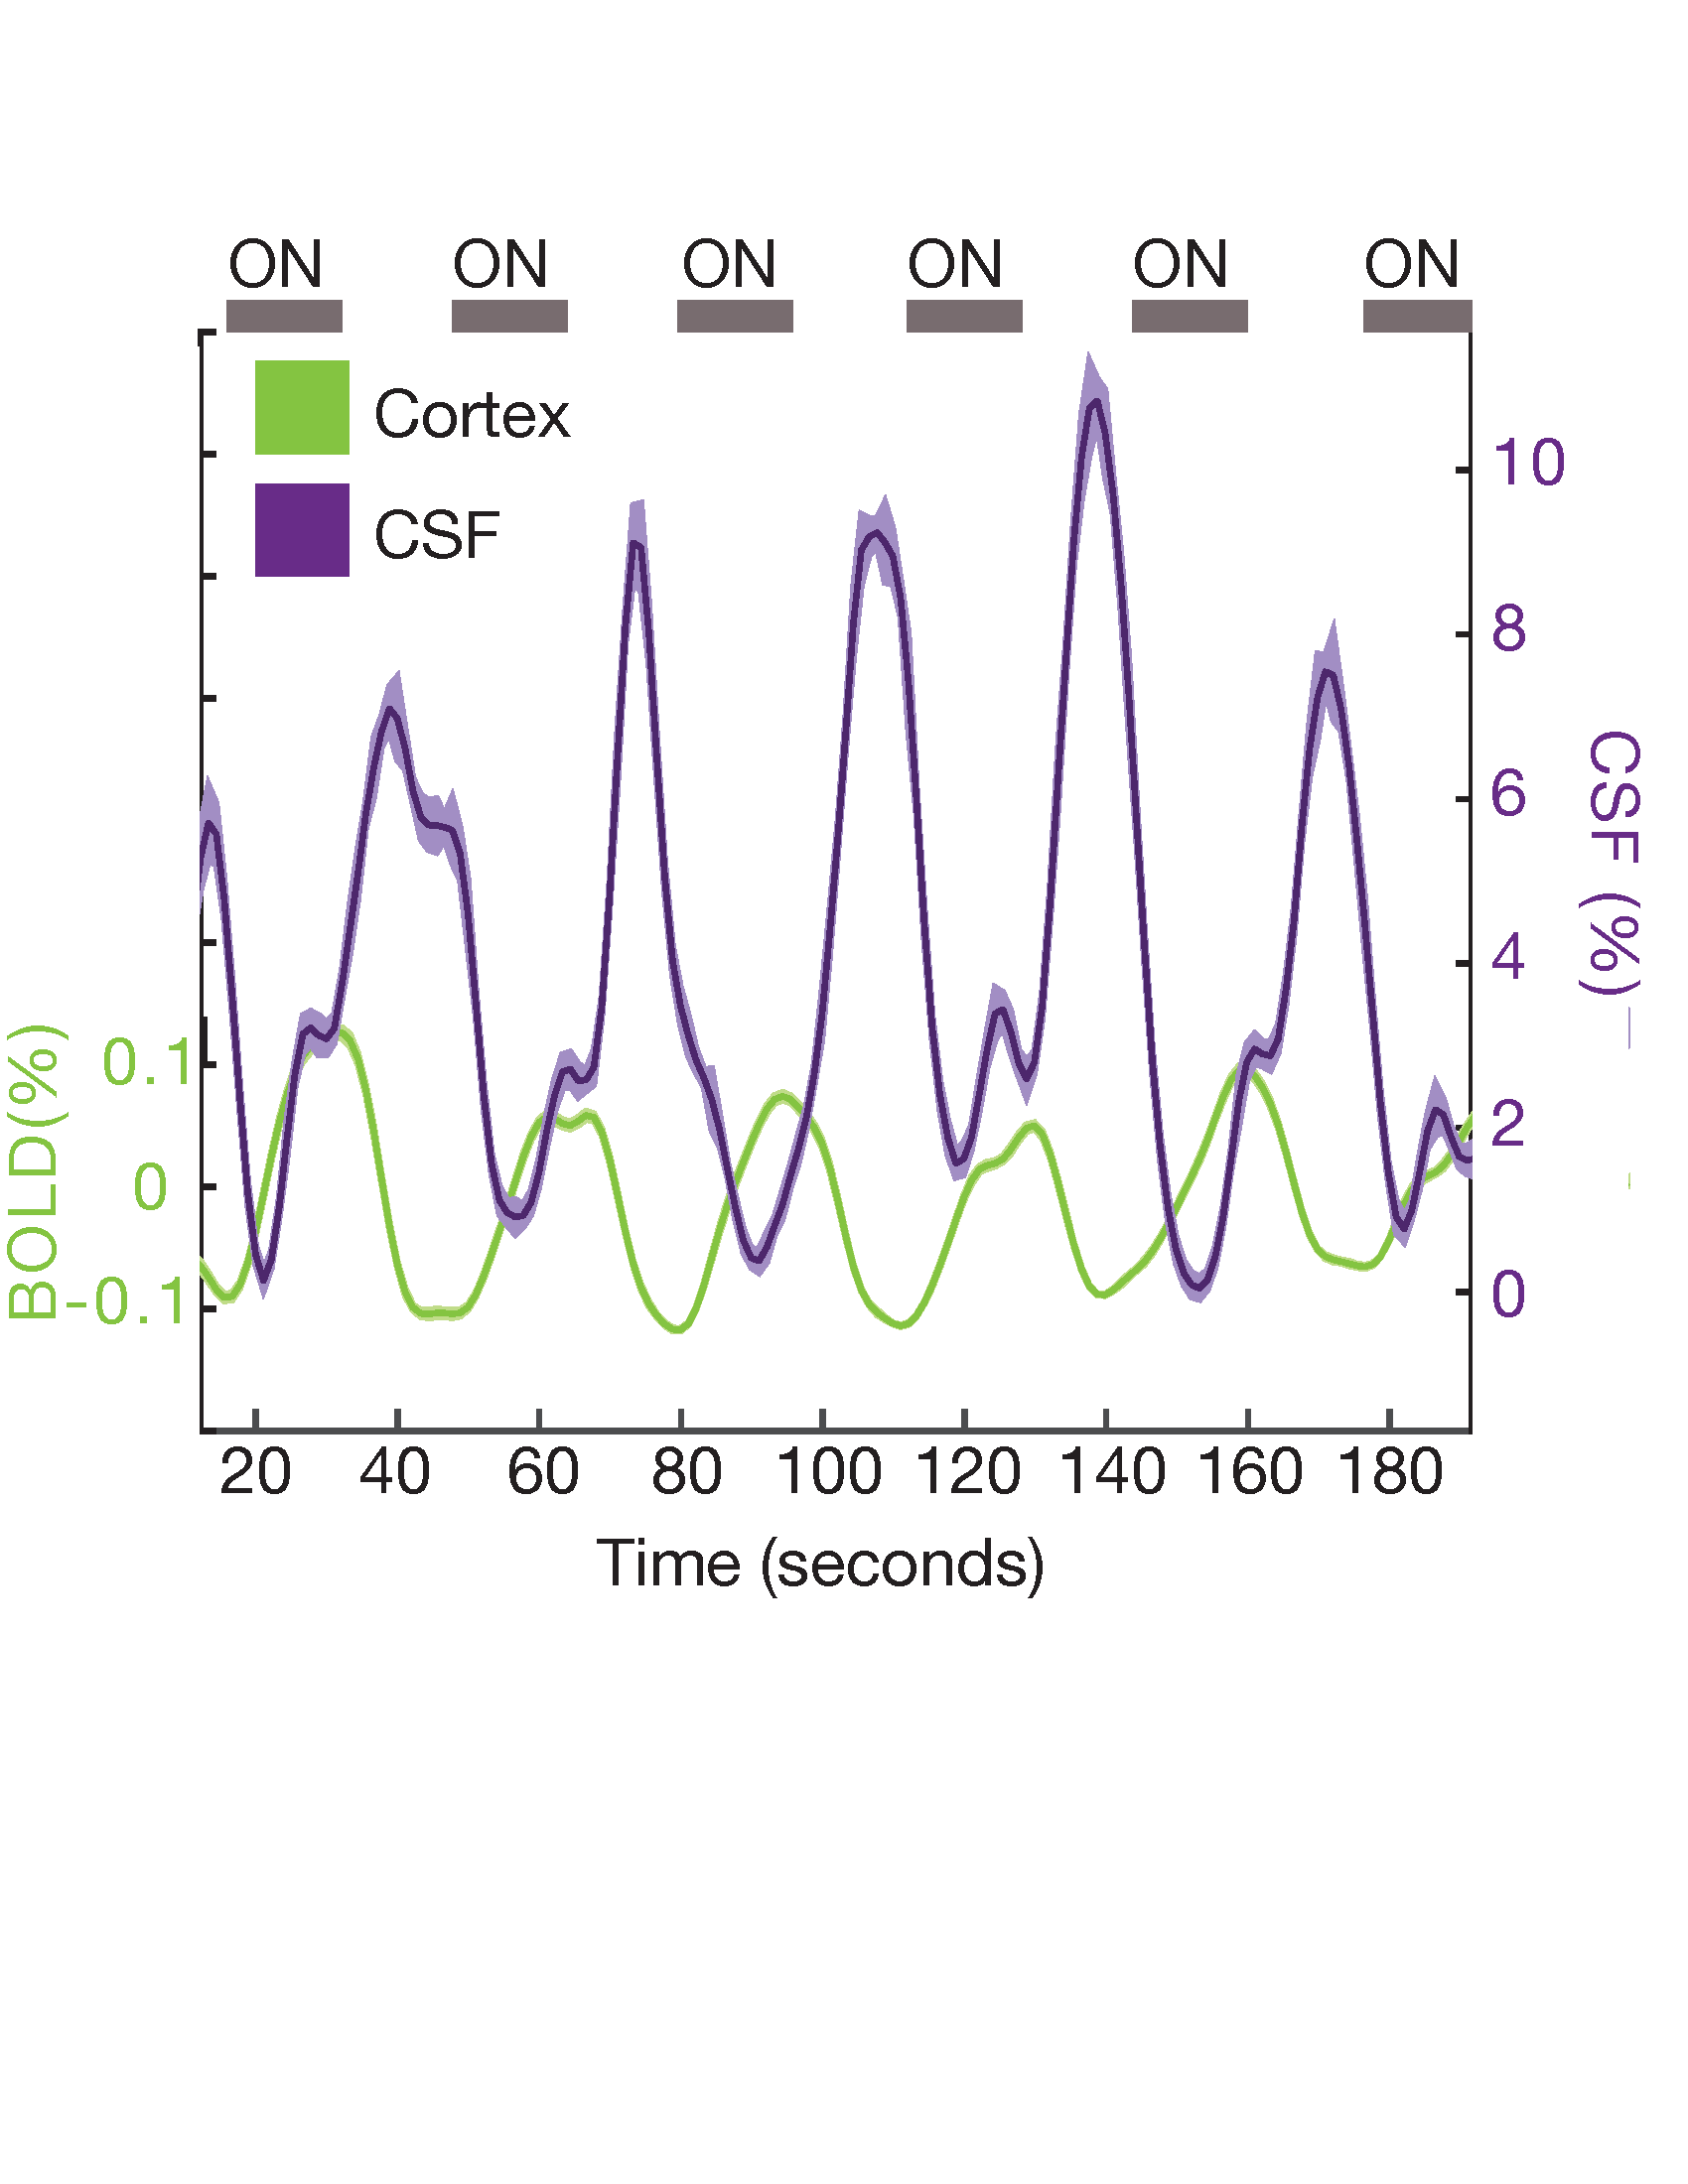
In Experiment 2 (N=20 subjects), we replicated our finding from Experiment 1 using a previously published fMRI dataset on a 7T Siemens whole-body scanner with slower temporal resolution but high spatial resolution8. Functional scans consisted of a single-shot gradient echo SMS-EPI at 1.1 mm3 isotropic resolution (TR=1.11 s, TE= 26 ms, 38 slices, R=4 acceleration, Multiband factor=2, matrix=174x174 full-Fourier, blipped CAIPI shift=FOV/2, flip angle=70°). The flicker rate of the checkerboard was 12 Hz across all runs.
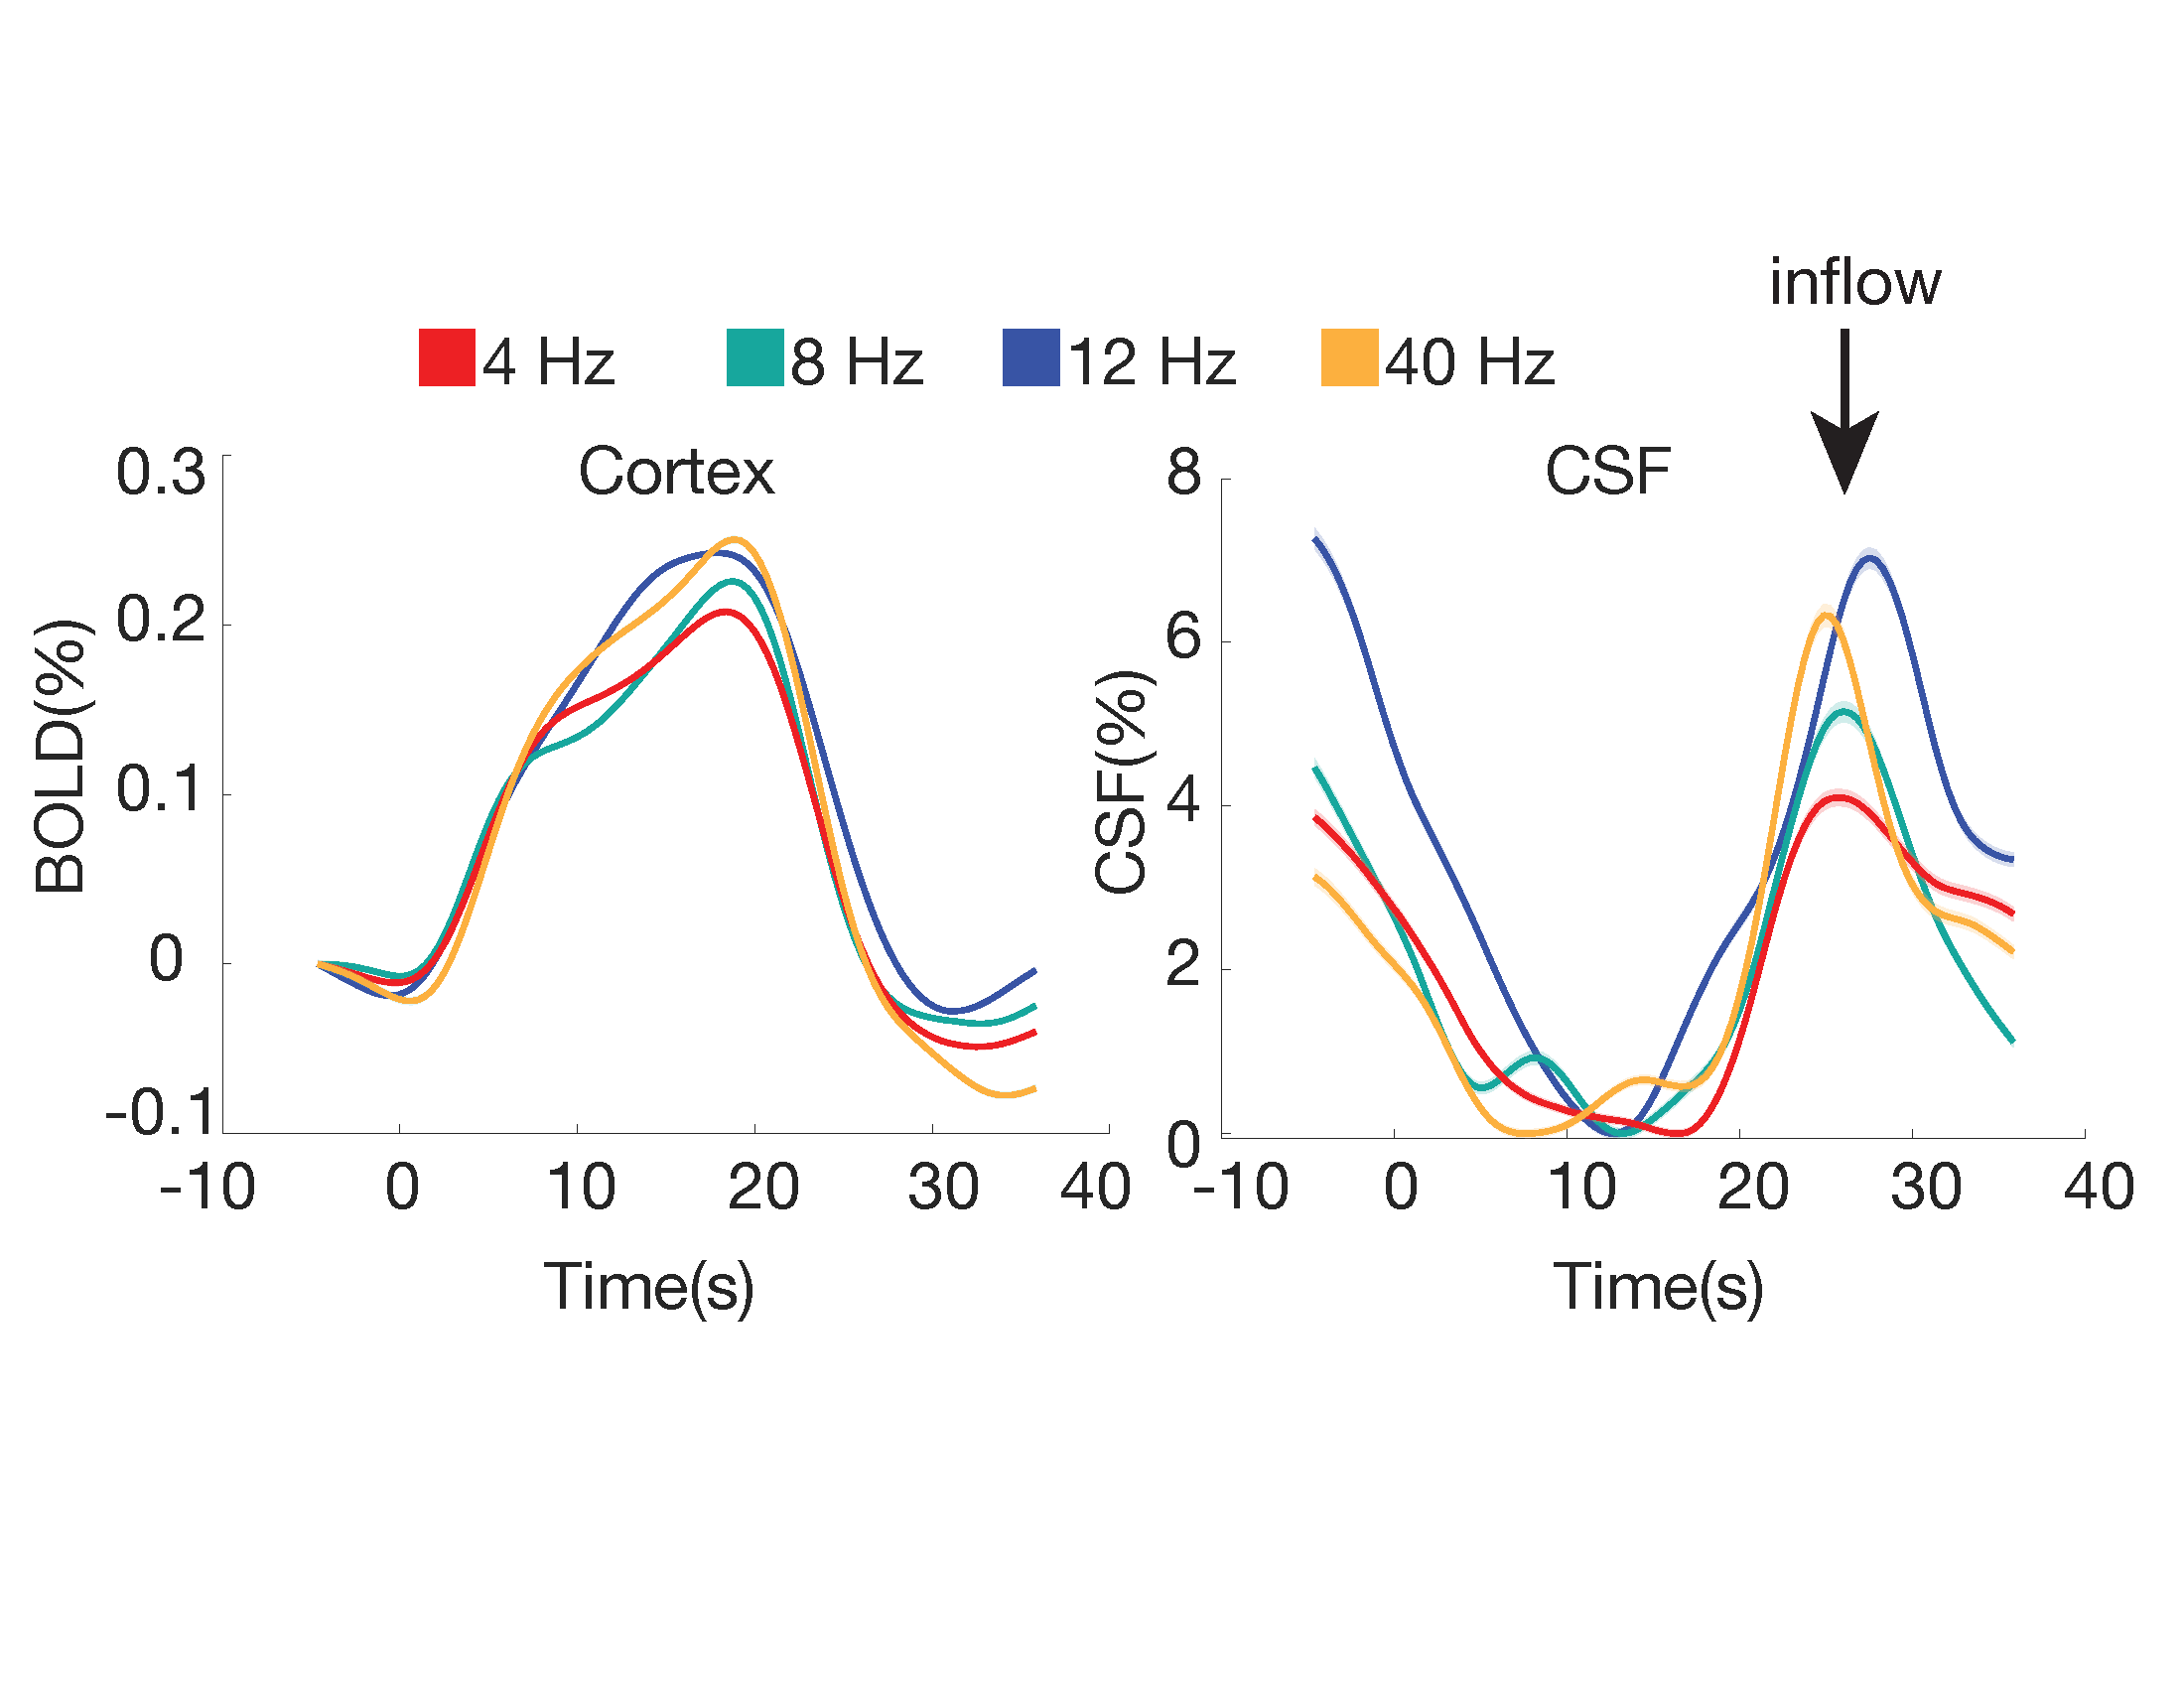
In Experiment 3 (N=6 subjects), we tested whether the CSF signal was modulated by stimulus parameters, using a 3T Siemens Prisma scanner (TR = 0.378 s, 2.5 mm3 isotropic, 40 slices, Multiband factor=8, blipped CAIPI shift=FOV/4, flip angle=35-37°, no in-plane acceleration). We varied the flicker frequency of the checkerboard (4, 8, 12, 40 Hz) across runs.
Results
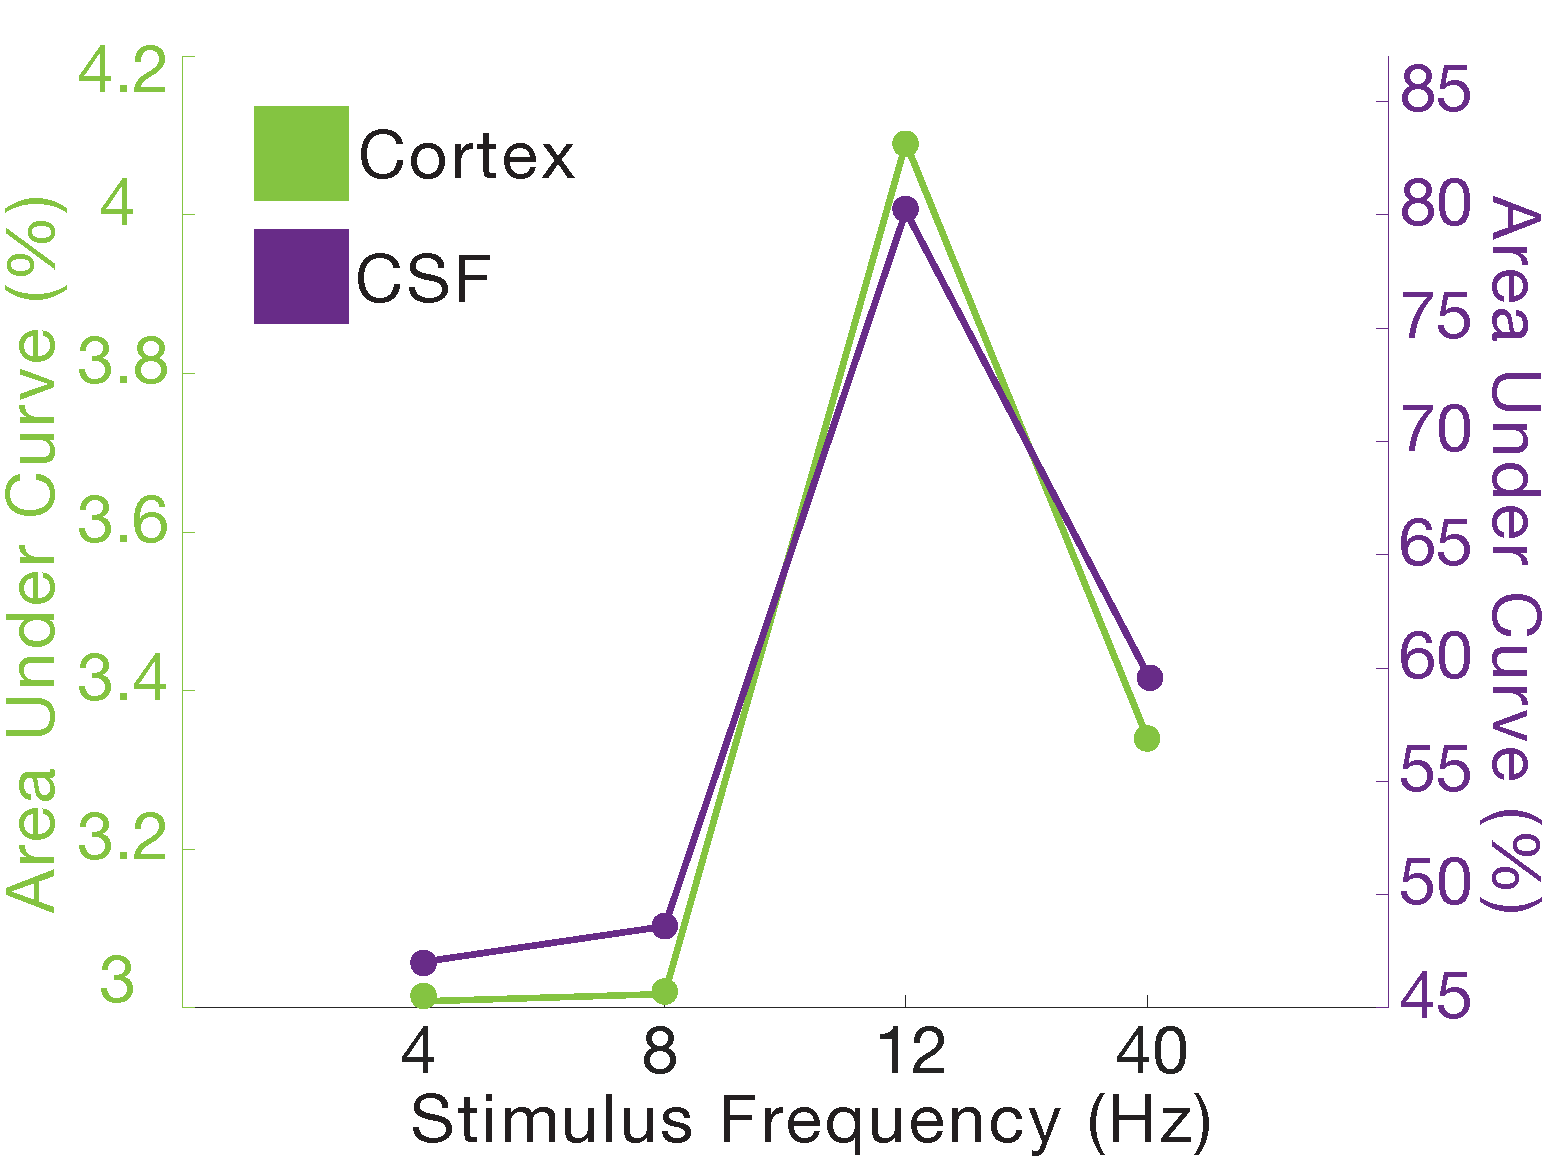
In Experiment 1, we found that the stimulus induced a large EEG response and a subsequent BOLD response detected in the mean cortical gray matter signal (Fig. 1c). We also identified a stimulus-locked CSF inflow signal that was anticorrelated with the task-evoked cortical BOLD signal. We observed a clear sequence of events: stimulus-evoked EEG power preceded the BOLD response, which preceded the CSF inflow signal. We next replicated the analysis in Experiment 2, and again found that a robust evoked CSF signal was anticorrelated to the cortical signal, with CSF inflow increasing when the BOLD signal declines after stimulation (Fig. 2). We next examined whether this effect was dependent on the frequency of the flickering checkerboard, which modulates the degree of BOLD activation9, in Experiment 3. We found that the amplitude of both the BOLD and CSF signals varied with differing flicker frequencies (Fig. 3). The 12 Hz frequency induced the greatest cortical and CSF response, followed by 40Hz, 8 Hz, and 4Hz (Fig. 4).Discussion
Across three experiments, we found that high-intensity visual stimulation can induce CSF flow. Our findings are consistent with the hypothesis that widespread neural activity drives increases in cerebral blood volume that alternate with compensatory changes in CSF flow, as CSF flow is strongly anticorrelated to the stimulus-induced BOLD signal. In addition, our results in Experiment 3 suggest that stimulus-locked CSF flow is modulated by the amplitude of the BOLD response, which can be manipulated by altering stimulus parameters.Conclusion
These experiments demonstrate that CSF flow can be driven by neural activity during the awake state in humans. Both neural and systemic physiological dynamics, such as vasoconstriction driven by the autonomic system, affect fMRI signals during sleep5. Our results suggest that in addition to the well-established effects of systemic physiology on CSF, neural activity and neurovascular coupling can drive CSF flow. Sleep is associated with clearance of toxic protein aggregates such as amyloid-beta from the brain10, and sensory-driven changes in arteriole diameter can induce in metabolite clearance from the brain11, suggesting potential functional roles for CSF flow dynamics. Future work could investigate whether sensory-driven CSF manipulation can drive metabolite clearance in awake humans.Acknowledgements
This work was funded by NIH grant R00-MH111748 and the Searle Scholars Program. We are grateful to Dr. Stephanie McMains for contributing to the imaging experiments.References
1. Feinberg, D. A., & Mark, A. S. (1987). Human brain motion and cerebrospinal fluid circulation demonstrated with MR velocity imaging. Radiology, 163(3), 793–799. https://doi.org/10.1148/radiology.163.3.3575734
2. Chen, L., Beckett, A., Verma, A., & Feinberg, D. A. (2015). Dynamics of respiratory and cardiac CSF motion revealed with real-time simultaneous multi-slice EPI velocity phase contrast imaging. NeuroImage, 122, 281–287. https://doi.org/10.1016/j.neuroimage.2015.07.073
3. Dreha-Kulaczewski, S., Joseph, A. A., Merboldt, K.-D., Ludwig, H.-C., Gartner, J., & Frahm, J. (2015). Inspiration Is the Major Regulator of Human CSF Flow. Journal of Neuroscience, 35(6), 2485–2491. https://doi.org/10.1523/jneurosci.3246-14.2015
4. Fultz, N. E., Bonmassar, G., Setsompop, K., Stickgold, R. A., Rosen, B. R., Polimeni, J. R., & Lewis, L. D. (2019). Coupled electrophysiological, hemodynamic, and cerebrospinal fluid oscillations in human sleep. Science, 366(6465), 628–631. https://doi.org/10.1126/science.aax5440
5. Özbay, P. S., Chang, C., Picchioni, D., Mandelkow, H., Chappel-Farley, M. G., van Gelderen, P., de Zwart, J. A., & Duyn, J. (2019). Sympathetic activity contributes to the fMRI signal. Communications biology, 2, 421. https://doi.org/10.1038/s42003-019-0659-06.
6. van der Kouwe, A., Benner, T., Salat, D. H., & Fischl, B. (2008). Brain morphometry with multiecho MPRAGE. NeuroImage, 40(2), 559–569. https://doi.org/10.1016/j.neuroimage.2007.12.025
7. K. Setsompop, B. A. Gagoski, J. R. Polimeni, T. Witzel, V. J. Wedeen, L. L. Wald, Blippedcontrolled aliasing in parallel imaging for simultaneous multislice echo planar imaging with reduced g-factor penalty. Magn. Reson. Med. 67, 1210–1224 (2012). doi:10.1002/mrm.23097 Medline
8. Lewis, L. D., Setsompop, K., Rosen, B. R., & Polimeni, J. R. (2018). Stimulus-dependent hemodynamic response timing across the human subcortical-cortical visual pathway identified through high spatiotemporal resolution 7T fMRI. NeuroImage, 181, 279–291. https://doi.org/10.1016/j.neuroimage.2018.06.056
9. Chai, Y., Handwerker, D. A., Marrett, S., Gonzalez-Castillo, J., Merriam, E. P., Hall, A., Molfese, P. J., & Bandettini, P. A. (2019). Visual temporal frequency preference shows a distinct cortical architecture using fMRI. NeuroImage, 197, 13–23. https://doi.org/10.1016/j.neuroimage.2019.04.048
10. Xie, L., Kang, H., Xu, Q., Chen, M. J., Liao, Y., Thiyagarajan, M., O’Donnell, J., Christensen, D. J., Nicholson, C., Iliff, J. J., Takano, T., Deane, R., & Nedergaard, M. (2013). Sleep Drives Metabolite Clearance from the Adult Brain. Science, 342(6156), 373–377
11. van Veluw, S. J., Hou, S. S., Calvo-Rodriguez, M., Arbel-Ornath, M., Snyder, A. C., Frosch, M. P., Greenberg, S. M., & Bacskai, B. J. (2020). Vasomotion as a Driving Force for Paravascular Clearance in the Awake Mouse Brain. Neuron, 105(3), 549-561.e5. https://doi.org/10.1016/j.neuron.2019.10.033
Figures