0378
Arterial, venous and cerebrospinal fluid flow oscillations in real-time phase contrast MRI: type of breathing matters1CADiTeR, IRCCS Fondazione Don Carlo Gnocchi ONLUS, Milan, Italy, 2University of Miami, Miami, FL, United States, 3MR R&D Collaborations, Siemens Medical Solutions USA, Inc., Cleveland, OH, United States, 4Siemens Healthcare, Milan, Italy, 5Department of Electronics, Information, and Bioengineering, Politecnico di Milano, Milan, Italy
Synopsis
We used real-time phase contrast MRI for assessing the cardiac and respiratory influence on the neck arterial and venous flows, and on the cervical cerebrospinal fluid (CSF) flow. Changes due to the type of breathing were investigated acquiring six healthy volunteers for 60s during normal and deep breathing. The power spectra were computed from the flow rates. Two main peaks, corresponding to the breathing rate (BR) and the heart rate (HR), were found. Comparing deep breathing to normal breathing, we observed the following trends: decrement of average blood flow rates; reversal of average CSF flow rate; increment of BR power.
Introduction
Cardiac-gated phase contrast (PC) MRI allows to quantify blood and cerebrospinal fluid (CSF) flows to/from the brain1. Used routinely2 and for clinical studies, it revealed flow alterations linked to various pathological conditions3-6. Nevertheless, besides heart rate, the respiratory motion also influences the venous return7,8. Since the skull is rigid, temporal changes of blood and CSF volumes inside it are linked.9,10 Therefore, respiratory influence on CSF flow is also expected 11, 12.With real-time (RT) PC-MRI, it became recently possible to show that coughing, inspiration, and expiration have an effect on the blood13, and CSF11,13,14 flows.
In our study, we used RT PC-MRI to assess the cardiac and respiratory influences on the neck blood flow and on the cervical CSF flow. Furthermore, we tested potential changes due to the breathing type.
Methods
MRI acquisitionsSix healthy volunteers (age range: 23-38 years; 5 female) were examined using a 3T clinical MR scanner (MAGNETOM Prisma, Siemens Healthcare, Erlangen, Germany) equipped with a 64-channel head-neck coil. A prototype RT-PC11 with a segmented EPI readout, parallel acceleration factor in the temporal direction, and 2-sided shared velocity encoding reconstruction algorithm, was used to measure blood flow and CSF flow at the first cervical level (FOV=153x175mm2, matrix=96x128, interpolated to 0.7x0.7mm2, slice thickness=8.6 mm, acquisition time=60s). For the neck blood flow measurement, the imaging slice was placed perpendicular to the main neck vessels, with the following parameters: temporal resolution=58.5 ms, VENC=70 cm/s, GRAPPA=3, TR/TE=14.6/8 ms, flip angle=15°. For the CSF flow quantification, the imaging slice was placed orthogonal to the spinal cord, with temporal resolution=94ms, VENC=6 cm/s, GRAPPA=2, TR/TE=15.7/9 ms, flip angle=5°.
RT-flow acquisitions were repeated twice in the following conditions: i) paced breathing, ii) deep breathing. Breathing rate (BR) and heart rate (HR) were measured using a belt and a pulse oximeter.
MRI Data Processing
RT-PC scans were processed using signal processing in NMR (SPIN) software (SpinTech Inc, Bingham Farms, MI)15 by a single trained operator. The time frames with the highest flow were visually selected, and regions of interest (ROIs) corresponding to the internal carotid arteries (ICAs), internal jugular veins (IJVs), and CSF were drawn using a semiautomated method.15 Four regions of static tissue (no-flow areas - NFA) were manually drawn near the ROIs, for background phase correction. ROIs were copied to all the time frames and manually adjusted if needed. Phase image values were mapped into velocity, then the average velocity in cm/s was computed inside each ROI, and corrected for the phase offset derived from the NFA. For convention, velocities directed upward (to the head) are positive and those directed downward are negative. The average flow rate in ml/s was computed by multiplying the average velocity inside each ROI for the ROI area.
Spectral computation
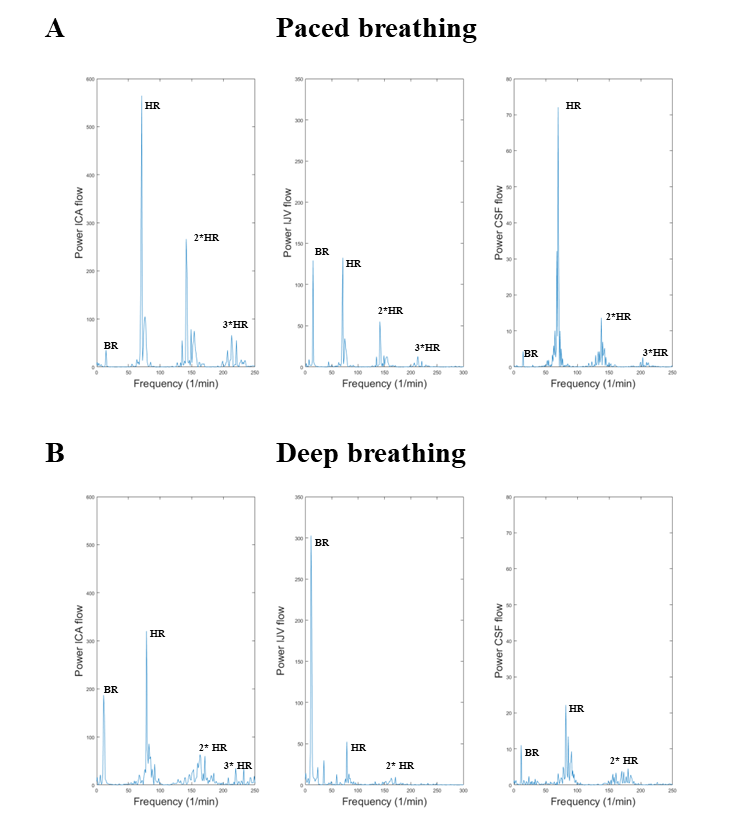
Matlab(version 2019A, Mathworks, Natick, WA, USA) was used. After signal demeaning, the power spectrum was computed, separately for ICAs, IJVs, and CSF flow rates, in the two breathing conditions. For each spectrum, two fundamental peaks were identified, corresponding to the HR (around 60/min) and to the BR (around 10/min). The powers of the respiratory and cardiac components were computed as integrals in the two bands, as in 11.
Statistical analysis
Descriptive statistics were computed for the ICAs, IJVs, CSF average flow rates, for the power at BR, and for the BR power normalized to the HR power.
Results
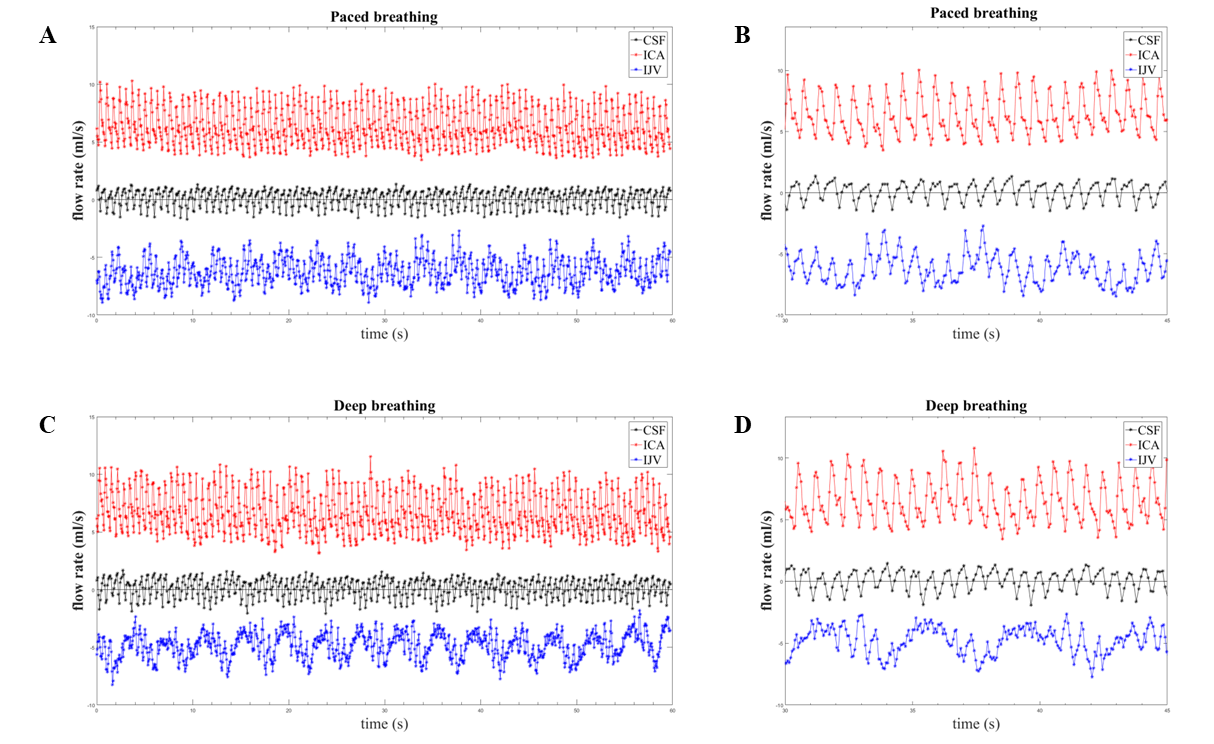
The temporal curves of the ICAs, IJVs and CSF flow rates are shown in Figure 1 for a healthy volunteer, the median values and ranges across subjects are in Table 1. The median [range] HR were 72.4 [59.3-93.4] bpm for the paced, and 76.0 [68.2-96.8] bpm for the deep breathing. The spectra (Figure 2) clearly showed the two peaks: one at the BR and another one at the HR. The absolute and normalized powers in the BR band are reported in Tables 2 and 3. The second and third HR harmonics were also evident. Comparing deep to paced breathing, the trends were: i) decrement of ICAs and IJVs average flow rates, and reversal of the average CSF flow rate (Table 1); ii) increment of the powers (Table 2) and normalized powers (Table 3) of the BR band; iii) decrement of the powers in the HR band.Discussion
The RT-PC MRI during two controlled respiratory conditions allowed us to assess the influence of respiration on the blood and CSF flow rate. The increment of the breathing strength partially influenced the average blood flow rates, with a trend for flow decrement that might be ascribed to autoregulation. Although the respiratory modulation was not always evident with regular paced breathing, it was clearer during the deep respiration. Increased respiratory influence was observed for the arterial, venous, and CSF flows, as it can be seen from the powers of Tables 2 and 3 and from the exemplificative spectra of Figure 2. Since altered blood flow, and CSF net volume or peak velocity were described in many pathological conditions 2, 3, 6, the application of RT-PC MRI into clinical studies might allow to investigate how the flows in/out of the brain are modulated by breathing patterns.Acknowledgements
No acknowledgement found.References
1. Battal B, Kocaoglu M, Bulakbasi N, Husmen G, Tuba Sanal H, Tayfun C. Cerebrospinal fluid flow imaging by using phase-contrast MR technique. Br J Radiol 2011;84:758-765.
2. Bradley WG, Jr. Magnetic Resonance Imaging of Normal Pressure Hydrocephalus. Semin Ultrasound CT MR 2016;37:120-128.
3. Zhang C, Wu B, Wang X, et al. Vascular, flow and perfusion abnormalities in Parkinson's disease. Parkinsonism Relat Disord 2020;73:8-13.
4. Öner S, Kahraman AS, Özcan C, et al. Cerebrospinal Fluid Dynamics in Patients with Multiple Sclerosis: The Role of Phase-Contrast MRI in the Differential Diagnosis of Active and Chronic Disease. 2018;19:72-78.
5. Jakimovski D, Zivadinov R, Weinstock-Guttman B, et al. Longitudinal analysis of cerebral aqueduct flow measures: multiple sclerosis flow changes driven by brain atrophy. 2020;17:9.
6. Magnano C, Schirda C, Weinstock-Guttman B, et al. Cine cerebrospinal fluid imaging in multiple sclerosis. J Magn Reson Imaging 2012;36:825-834.
7. Lagana MM, Di Rienzo M, Rizzo F, et al. Cardiac, Respiratory and Postural Influences on Venous Return of Internal Jugular and Vertebral Veins. Ultrasound Med Biol 2017;43:1195-1204.
8. Daouk J, Bouzerar R, Baledent O. Heart rate and respiration influence on macroscopic blood and CSF flows. Acta Radiol 2017;58:977-982.
9. Tain RW, Alperin N. Noninvasive intracranial compliance from MRI-based measurements of transcranial blood and CSF flows: indirect versus direct approach. IEEE Trans Biomed Eng 2009;56:544-551.
10. Beggs CB, Shepherd SJ, Cecconi P, Lagana MMJAS. Predicting the aqueductal cerebrospinal fluid pulse: a statistical approach. 2019;9:2131.
11. Yildiz S, Thyagaraj S, Jin N, et al. Quantifying the influence of respiration and cardiac pulsations on cerebrospinal fluid dynamics using real-time phase-contrast MRI. J Magn Reson Imaging 2017;46:431-439.
12. Vinje V, Ringstad G, Lindstrom EK, et al. Respiratory influence on cerebrospinal fluid flow - a computational study based on long-term intracranial pressure measurements. Sci Rep 2019;9:9732.
13. Ohno N, Miyati T, Noda T, et al. Fast Phase-Contrast Cine MRI for Assessing Intracranial Hemodynamics and Cerebrospinal Fluid Dynamics. Diagnostics (Basel) 2020;10.
14. Aktas G, Kollmeier JM, Joseph AA, et al. Spinal CSF flow in response to forced thoracic and abdominal respiration. Fluids Barriers CNS 2019;16:10.
15. Jiang J, Kokeny P, Ying W, Magnano C, Zivadinov R, Mark Haacke E. Quantifying errors in flow measurement using phase contrast magnetic resonance imaging: comparison of several boundary detection methods. Magn Reson Imaging 2015;33:185-193.
Figures