0377
Blood-CSF Barrier Imaging in the Human Brain with Arterial Spin Labeling1C.J. Gorter Center for High Field MRI, Department of Radiology, Leiden University Medical Center, Leiden, Netherlands, 2Leiden Institute for Brain and Cognition (LIBC), Leiden, Netherlands, 3UCL Centre for Advanced Biomedical Imaging, Division of Medicine, University College London, London, United Kingdom, 4Neuroradiological Academic Unit, Department of Brain Repair and Rehabilitation, UCL Queen Square Institute of Neurology, University College London, London, United Kingdom, 5Dementia Research Centre, UCL Queen Square Institute of Neurology, University College London, London, United Kingdom, 6Wellcome Centre for Human Neuroimaging, UCL Queen Square Institute of Neurology, University College London, London, United Kingdom
Synopsis
In order to measure the function of the blood-CSF barrier (BCSFB), a modified ASL experiment is introduced. This is accomplished with multiple time-points, including long labeling duration and post-labeling delay, and an echo train of 8 TEs from 10-1837ms. Long-T2 ASL signal, attributable to the CSF, was found both in the choroid plexus and around the cortex. Fitting of this signal to two models (a simple triexponential and a dynamic compartmental model) reveals an amount of CSF signal about 5 times lower than the perfusion. The transfer time of water across the BCSFB is estimated at around 100s.
Introduction
The emerging field of glymphatics studies waste clearance pathways in the brain, mediated through the cerebrospinal fluid (CSF). A key component of this system is thought to be the blood-CSF barrier (BCSFB); a membrane through which water and other molecules are exchanged. Assessing BCSFB function is of importance, as an imbalance in CSF volume could disrupt waste clearance, associated with many neurodegenerative disorders (e.g. Alzheimer’s disease)1.Arterial spin labeling (ASL) measures perfusion by magnetically labeling blood water. Leveraging the long T1 and T2 of CSF (~4200 and 1500 ms, respectively), modified ASL experiments in mice measured CSF-signal around the choroid plexus (ChP)2, thought to be the main site of CSF production. Here we expand upon this approach and capture the transfer of labeled blood water to CSF compartments in the human brain.
Methods
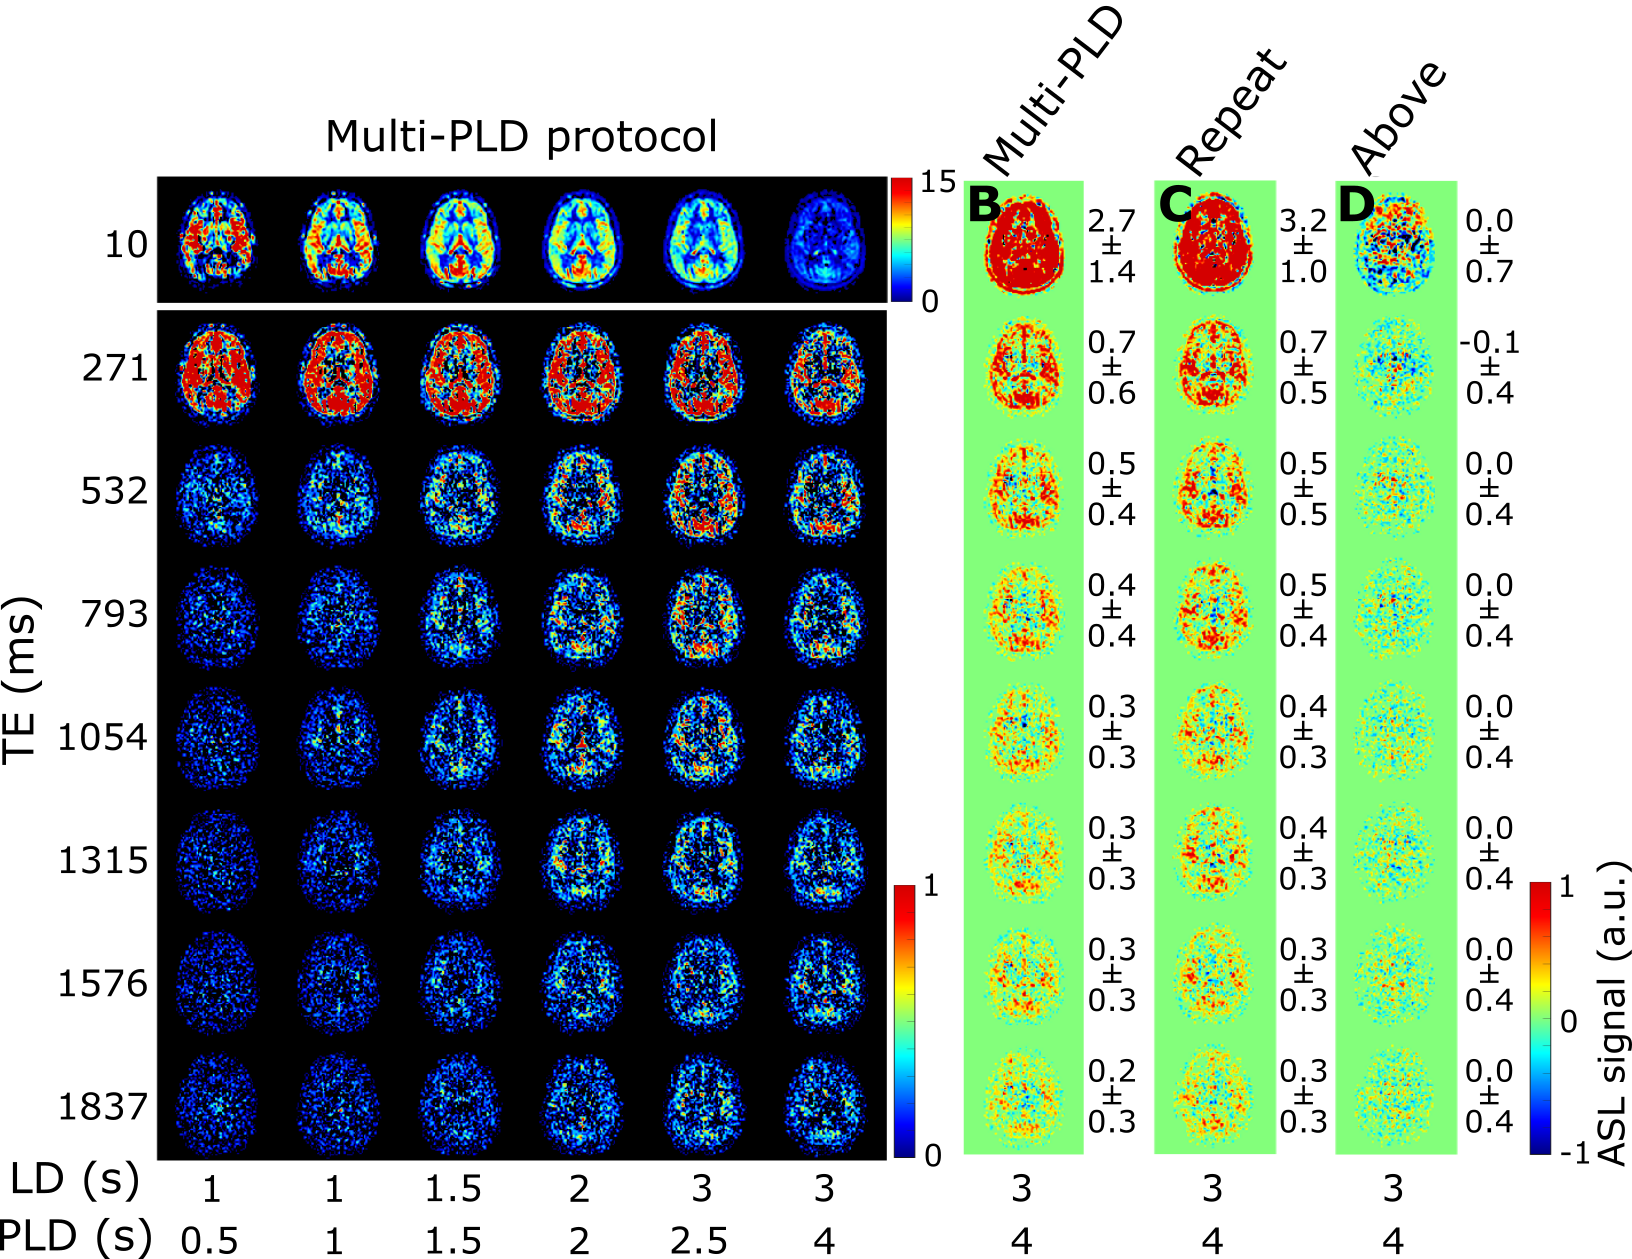
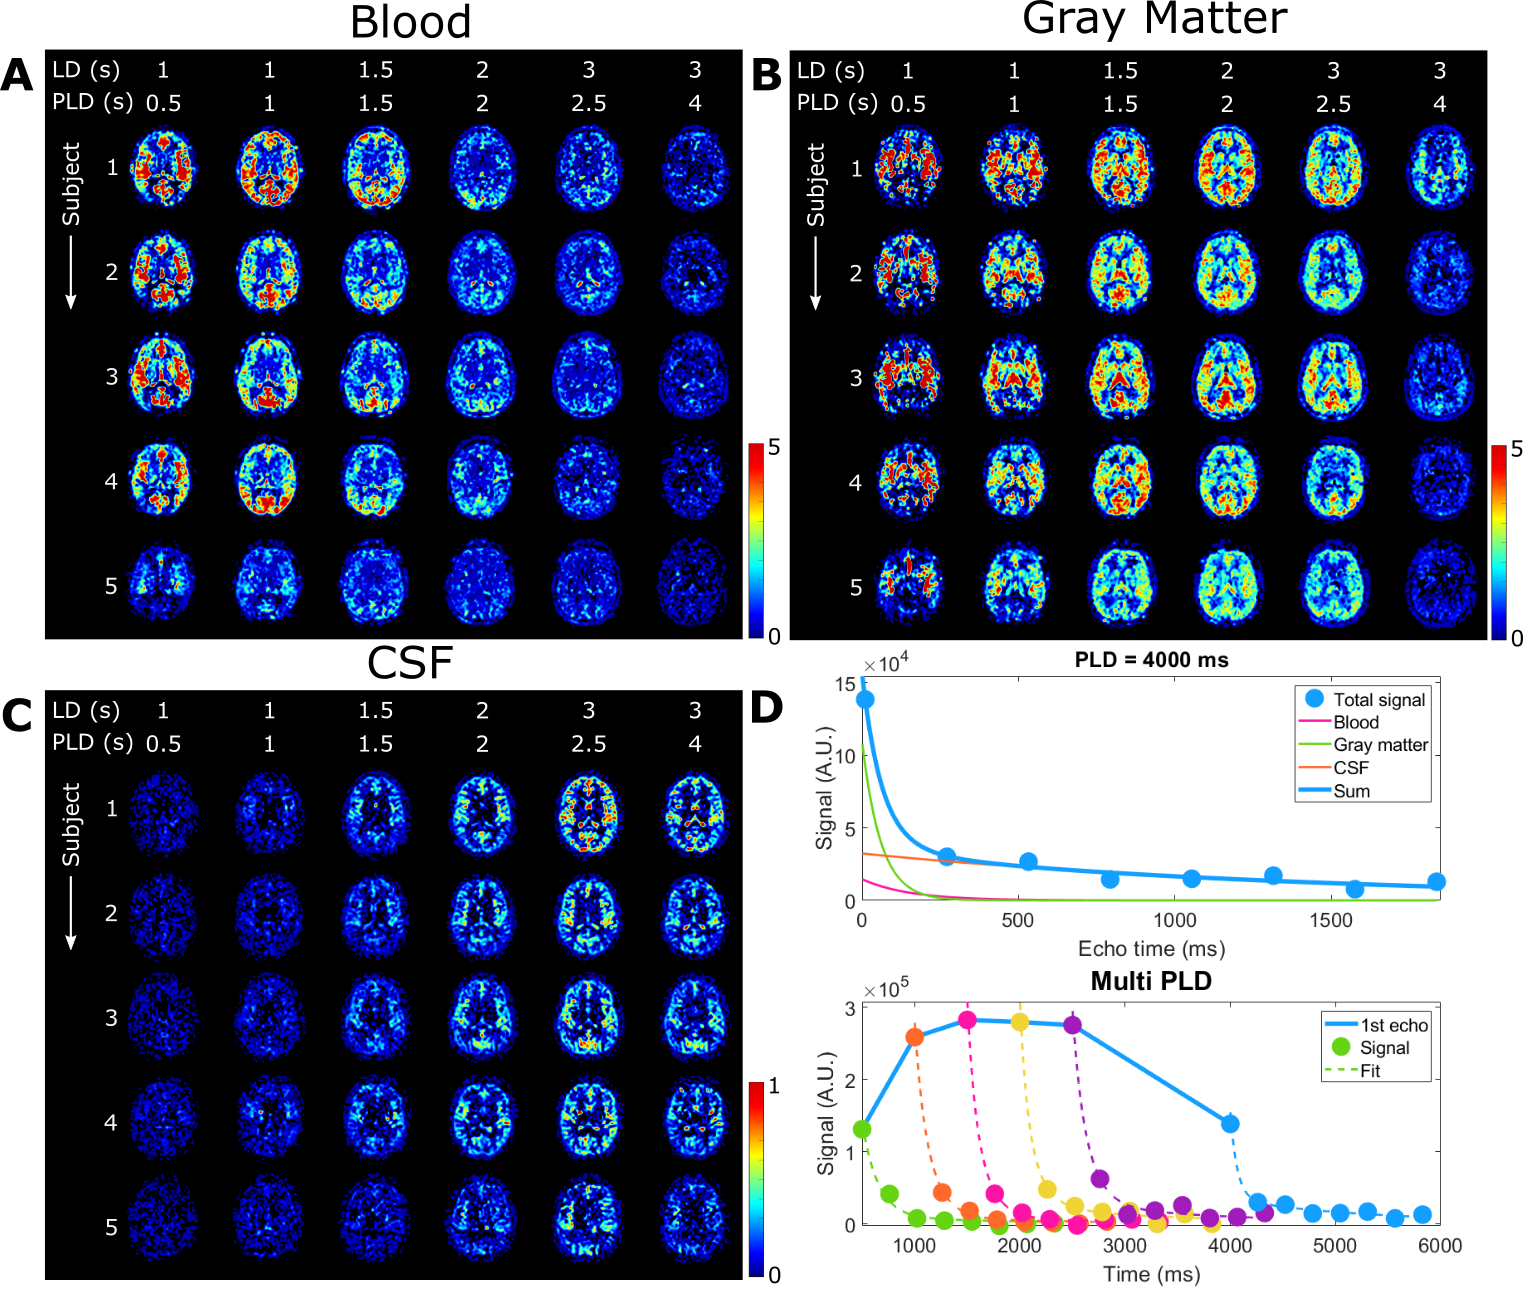
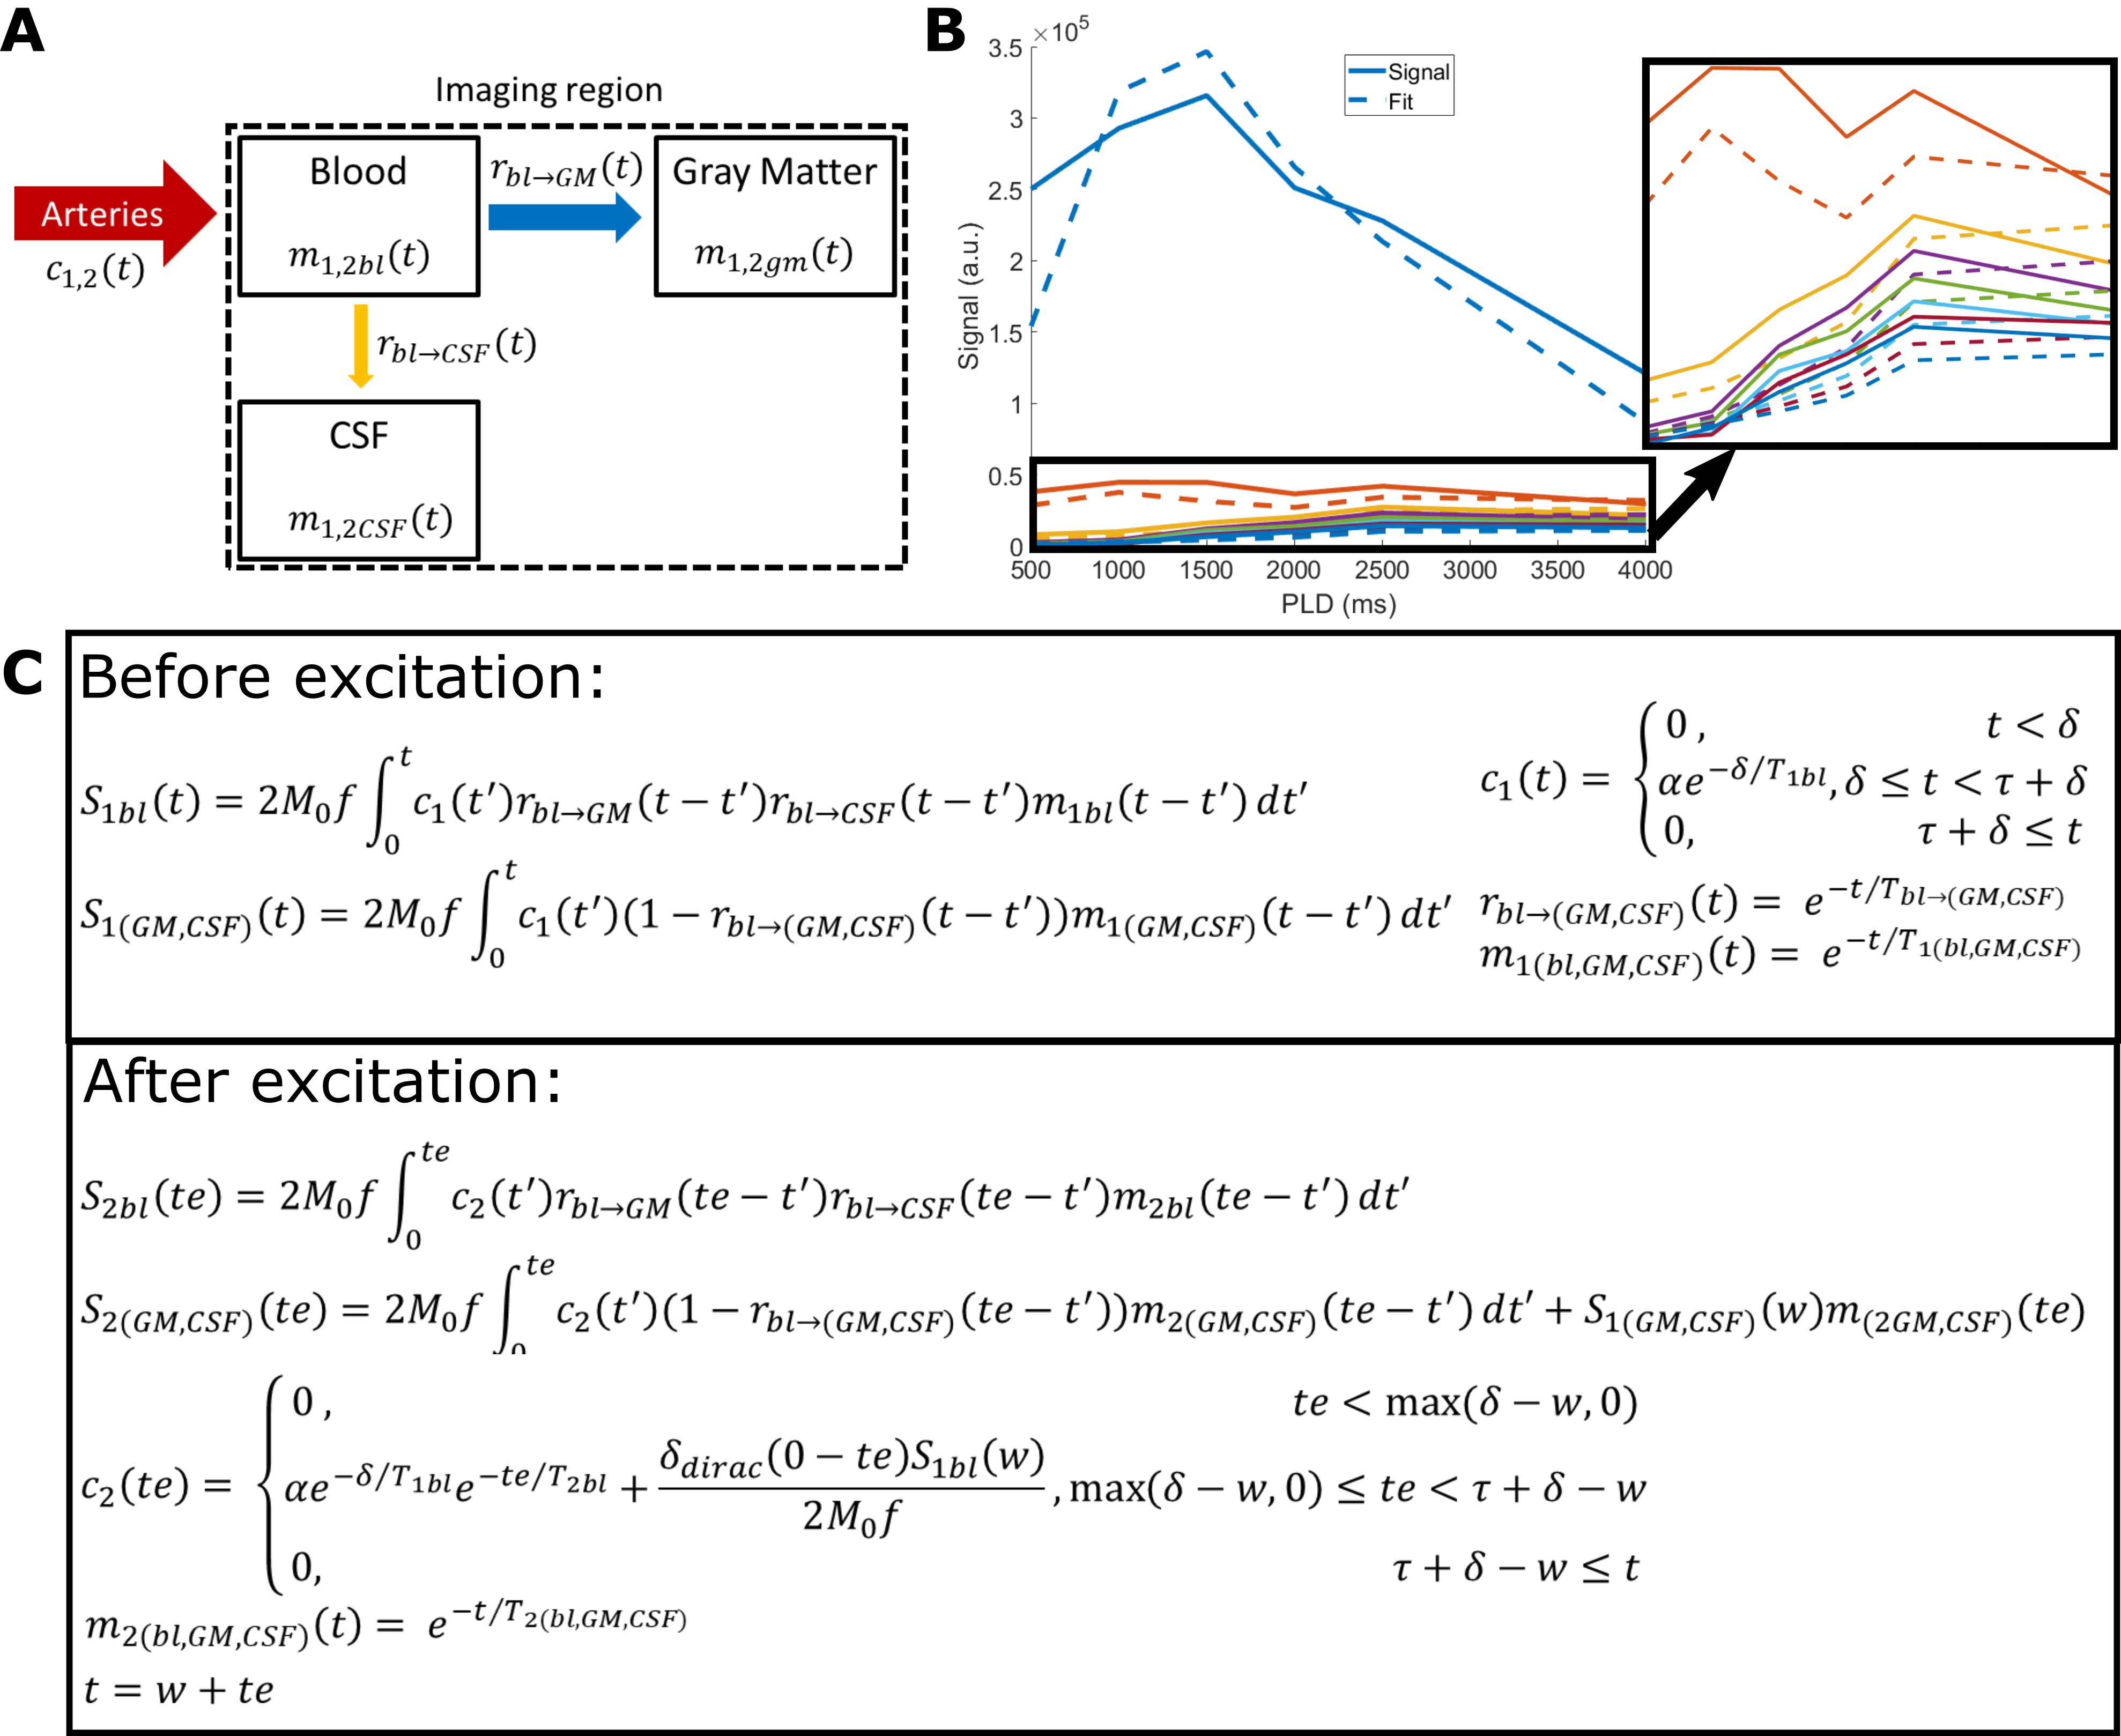
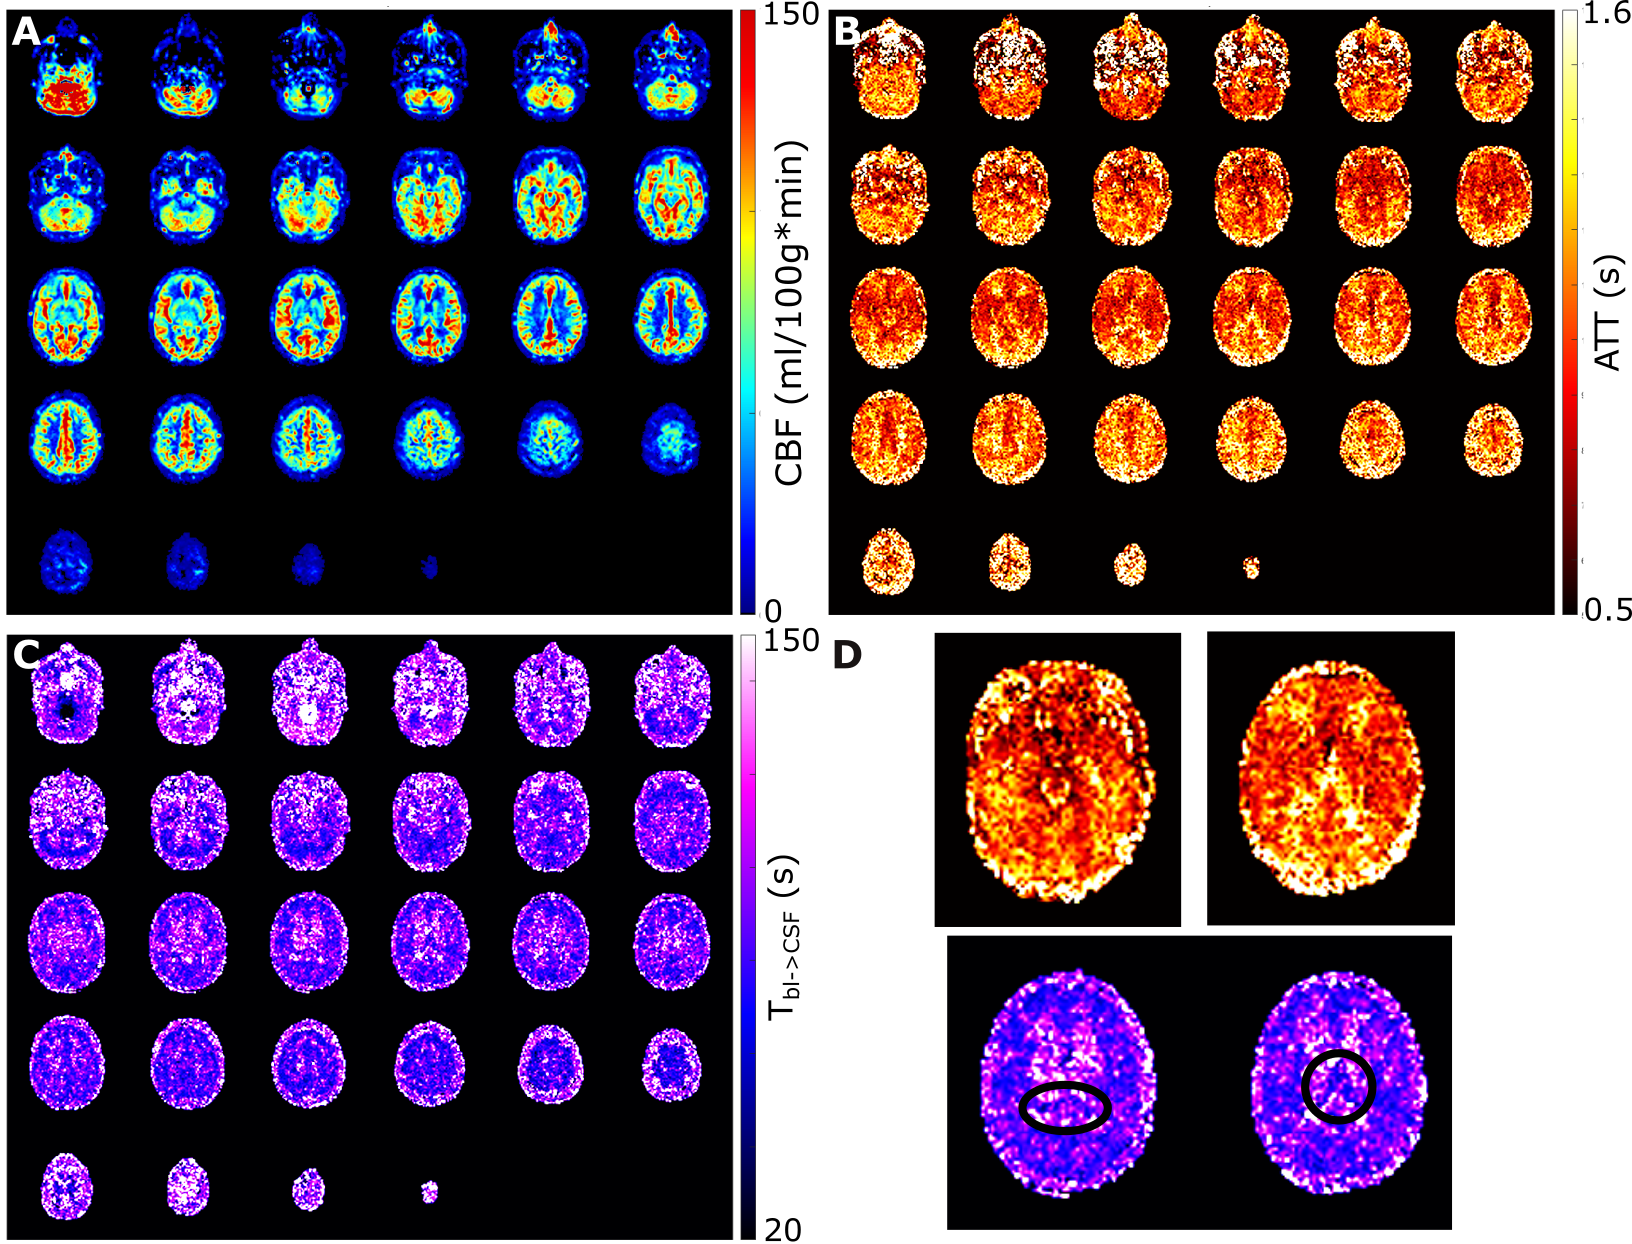
This study consists of two protocols: a multi-PLD acquisition to image time-dependent dynamics of ASL label arising in CSF (5 female subjects, 24-61 years, with informed consent in accordance with IRB-regulations), and a validation session (in three of the same subjects) to confirm that the observed signal is reproducible and not artefactual. All data were acquired on a Philips Achieva 3T system (Philips, the Netherlands) with a 32-channel head-coil. For the multi-PLD protocol, six pCASL scans were performed with labeling duration (LD)=1000, 1000, 1500, 2000, 3000, 3000ms and post-labeling delay (PLD)=500, 1000, 1500, 2000, 2500, 4000ms. The 3D-GRaSE readout (4 shots, 3x3x6mm3) was extended to 8 echo times (TE=10+(n-1)*261ms). To estimate M0, an additional scan was acquired without labeling. For the validation protocol, performed on a separate day, the last pCASL scan was repeated, as well as a scan with the labeling plane placed symmetrically above the brain.Analysis was performed in MATLAB. Perfusion images were calculated by pair-wise subtraction of label and control. These were smoothed with a 2x2 voxel gaussian kernel (σ=2 voxels). Two separate processing approaches were used: (i) a triexponential fit (Stotal=Sblexp(-TE/T2bl)+SGMexp(-TE/T2GM)+SCSFexp(-TE/T2CSF)) with set T2s was used to separate the ASL-signal residing in blood, gray matter (GM) and CSF for each LD/PLD combination; and (ii) a dynamic compartmental model3 (figure 3) to obtain whole-brain maps of cerebral blood flow (CBF or f), arterial transit time (ATT or δ), Tbl->GM and Tbl->CSF, the water transfer-time from the blood to GM and CSF, respectively. Using these maps, the fractions of signal coming from the compartments could be calculated at arbitrary time points to facilitate dynamic visualization.
Results
The ASL-signal at long TE becomes visible at longer LD/PLD, indicating the inflow of labeled water into CSF (Figure 1a). The intensity and location of the signal are reproducible across sessions (Figure 1b,c), and no significant signal is created when the labeling plane is situated above the head (Figure 1d). Note that label not only reaches the CSF in the choroid plexus (ChP), but also around the cortex, in the subarachnoid space. Figure 2 shows distinct spatial and temporal patterns for the three compartments with the simple triexponential fit. Figure 3 describes the model and results of dynamic fitting. CBF (Figure 4a) pattern and values are consistent with literature4. ATT (Figure 4b) shows short values in the circle of Willis and the expected X-pattern of longer ATT in the white matter (Figure 4d, top). Tbl->CSF values are shorter in the ChP and cortical area (Figure 4d, bottom, circles) (avg±SD 102±75s and 103±54s, respectively) and longer in the white matter. Finally, the animated GIF in Figure 5 shows dynamically the early arrival of label in the blood compartment, prolonged stay in tissue, and delayed arrival and decay in CSF. The two processing approaches extracted a non-negligible fraction of CSF-signal, on a scale about 5 times lower than blood and gray matter signal (Figures 2 and 5), with slightly differing patterns.Discussion
We show that imaging of ASL-signal in the CSF can be achieved in the human brain. Our results appear to contradict the common belief that the vast majority of water-exchange from blood to CSF occurs in the ChP. As Figure 1 already shows, at medium to long LD/PLD, ASL-signal with a long T2 (indicating the presence of labeled water that travelled from the blood to the CSF), is present both in the ventricles and around the cortex. This unexpectedly high CSF-signal could be explained by recent studies showing BCSFB exchange sites in the leptomeningeal vasculature5. It should be noted that water exchange during the (1.8s!) echo-train is neglected in the triexponential fit, while it is taken into account by the dynamic model; this is likely to explain differences in results observed by the two approaches (Figures 2 and 5). Similar Tbl->CSF values estimated in the ChP and cortex appear to point towards similar exchange pathways.For the dynamic model, we assumed no venous outflow, instantaneous mixing within compartments, and no exchange between the GM and CSF (figure 3a). The T2s of blood, GM and CSF were set at 150, 60 and 1500ms, respectively. In future experiments, these assumptions could be challenged, and the T2s could be varied or fitted. The presence of some ASL-signal in CSF will also have a minor effect on partial volume correction methods that currently ignore CSF-signal.
Acknowledgements
This work is part of the programme Innovational Research Incentives Scheme Vici (project 016.160.351), financed by NWO.
David Thomas is supported by the UCL Leonard Wolfson Experimental Neurology Centre (PR/ylr/18575), UCLH NIHR Biomedical Research Centre, and the Wellcome Trust (Centre Award 539208).
Jack Wells is supported by the Wellcome Trust/Royal Society (204624/Z/16/Z).
References
1. Tarasoff-Conway, J. M. et al. Clearance systems in the brain - Implications for Alzheimer disease. Nat. Rev. Neurol. 11, 457–470 (2015).
2. Evans, P. G. et al. Non-Invasive MRI of Blood-Cerebrospinal Fluid Barrier Function. Nat. Commun. 11, 2081 (2020).
3. Gregori, J., Schuff, N., Kern, R. & Günther, M. T2-based arterial spin labeling measurements of blood to tissue water transfer in human brain. J. Magn. Reson. Imaging 37, 332–342 (2013).
4. Alsop, D. C. et al. Recommended implementation of arterial spin-labeled Perfusion mri for clinical applications: A consensus of the ISMRM Perfusion Study group and the European consortium for ASL in dementia. Magn. Reson. Med. 73, 102–116 (2015).
5. Li, Q. et al. Aquaporin 1 and the Na+/K+/2Cl- cotransporter 1 are present in the leptomeningeal vasculature of the adult rodent central nervous system. Fluids Barriers CNS 17, 1–16 (2020).
Figures