0372
Prediction of Overall Survival in Patients with Pancreatic Cancer: Texture Analysis of ADC Value and Correlation with Intratumoral Necrosis1Department of Radiology, Gifu University, Gifu, Japan, 2Department of Tumor Pathology, Gifu University, Gifu, Japan, 3Innovative and Clinical Research Promotion Center, Gifu University Hospital, Gifu, Japan, 4Department of Frontier Science for imaging, Gifu University, Gifu, Japan
Synopsis
The use of texture analysis in clinical images can provide surrogate information on tumor microenvironment and predict the prognosis of patients. In this study, we evaluate the utility of texture analysis of tumor ADC values to predict the overall survival in patients with pancreatic cancer and to correlate with pathological evaluated massive intratumoral necrosis. Our results showed that the kurtosis of tumor ADC values obtained from texture analysis is correlated with massive intratumoral necrosis and is associated with poor prognosis in patients with pancreatic cancer.
Purpose
To evaluate the utility of texture analysis (TA) of tumor apparent diffusion coefficient (ADC) values to predict the overall survival (OS) in patients with pancreatic pancer (PC) and to correlate with pathological evaluated massive intratumoral necrosis (MITN).Materials and Methods
This retrospective study was approved by our Institutional Review Board, and written informed consent was waived. Thirty-nine patients with known PC based on a previously performed endoscopic ultrasound-guided fine-needle aspiration underwent MR imaging between February 2015 and March 2020 were included. Using a 3T MR system (Intera Achieva Quasar Dual or Ingenia 3.0T CX; Philips Medical Systems, Best, the Netherlands) equipped with a 32-channel digital coil, we performed MR imaging of the pancreas. The following sequences comprise the MR imaging protocol: three-dimensional fat-suppressed axial T1-weighted fast field echo imaging; in-phase and opposed-phase T1-weighted axial gradient-recalled-echo imaging; respiratory-triggered two-dimensional fat-suppressed axial T2-weighted turbo spin-echo imaging (using Multi Vane in Ingenia 3.0T CX); and respiratory-triggered two-dimensional axial diffusion-weighted imaging with a single-shot echo-planar sequence. Two radiologists reviewed ADC maps and performed TA using a commercially available DICOM viewer, which was programmed to perform TA. A series of TA parameters were calculated, including mean, standard error, median, mode, standard deviation, variance, kurtosis, skewness, coefficient of variance, minimum, maximum, entropy, and energy. The intratumoral necrosis was defined as an area that occurs in cancer tissue regardless of its extent and is usually found in both cancer cells and cancer stroma. We defined it as massive intratumoral necrosis (MITN), according to a previous report, when coagulation necrosis was extensively developed [1]. Risk factors associated with OS were assessed by Cox proportional hazard model with adjustment for age. Time-dependent receiver operating characteristic (ROC) curve was used to assess the predictive performance of the risk factors strongly associated with OS by results using a Cox proportional hazard analysis. An appropriate threshold for predicting mortality was also calculated by averaging the thresholds obtained from each ROC. To assess the relationship between the risk factor and MITN, logistic regression analysis was performed adjusting for age.Results
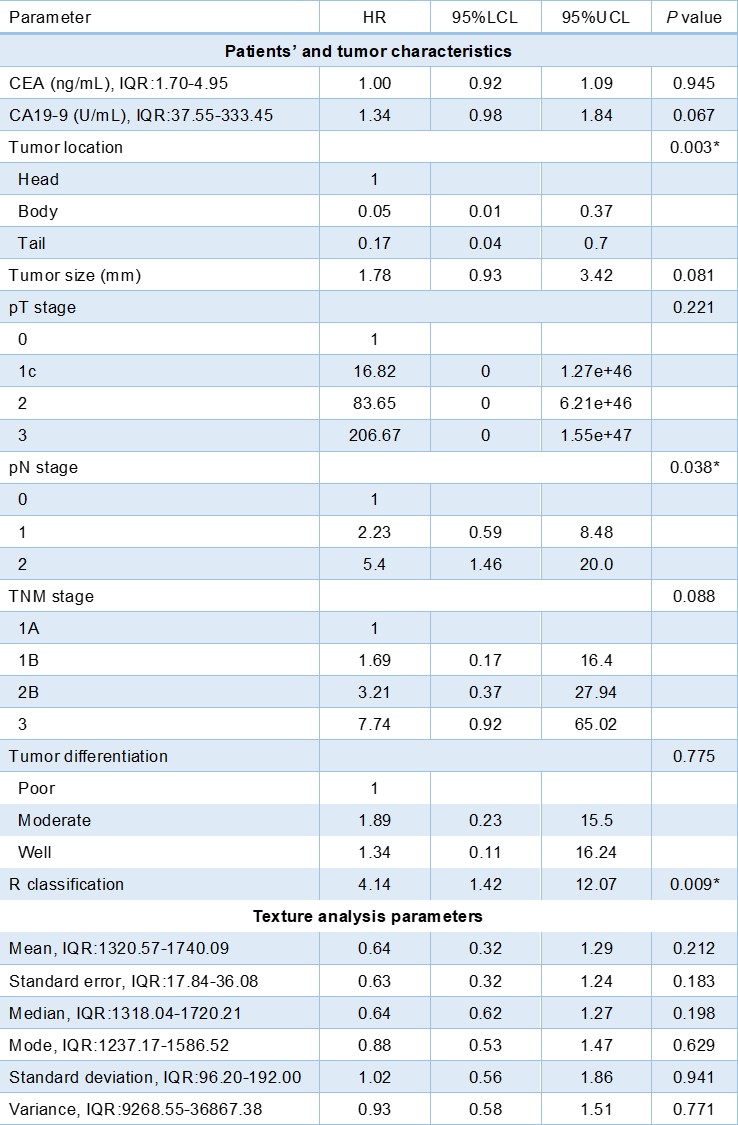
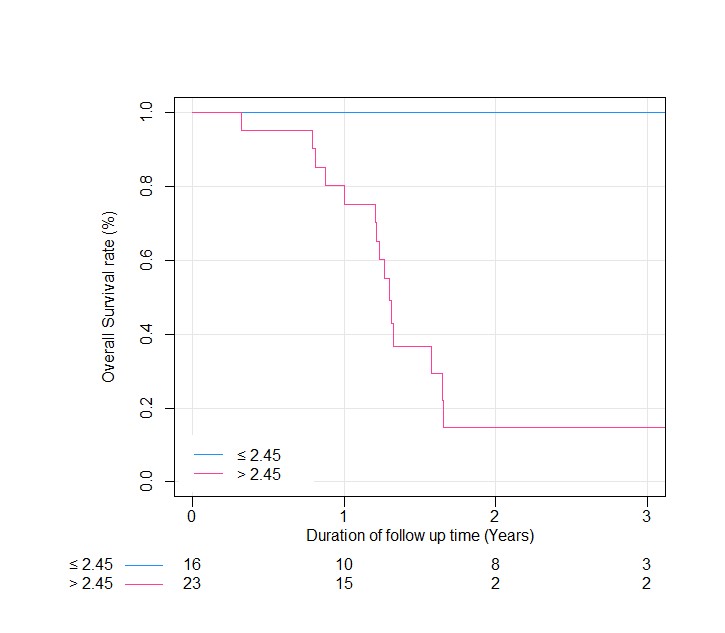
Median OS was 19.9 months, and 23 (59.0%) patients were alive at the last follow-up for data collection. Kurtosis (hazard ratio for the 75th vs 25th percentile, 7.11; P < 0.001) had the strongest association with OS among prognostic factors (Figure 1). The cutoff values of the kurtosis for predicting 1- and 3-year survival were 2.83 and 2.45. The bootstrap AUCs for predicting 1- and 3-year survival were 0.755 and 0.824 when using these cutoff values. Patients with high kurtosis (greater than cutoff value) exhibited lower survival rates than those with low kurtosis (cutoff value or less) (P < 0.001: 1-year survival rate, 75.2% vs. 100%: 3-year survival rate, 14.7% vs. 100%) (Figure 2). The kurtosis is associated with MITN (odds ratio, 4.20; P = 0.045). In MITN positive cases, the kurtosis was significantly higher than in negative cases (3.10 vs. 2.41; P = 0.023).Discussion
TA parameters could reflect information within tumors that cannot be evaluated in conventional image analyses, including tumor heterogeneity that may represent tumor aggressiveness and prognostic implication [2]. We infer that the reason why the patients with high kurtosis exhibited lower survival rates than those with low kurtosis was associated with the heterogeneity of PCs, hypovascular or hypoxic tissues, and MITN. The kurtosis of tumor ADC values was significantly higher in MITN positive cases than in negative cases, as shown in this study, and the kurtosis of tumor ADC values was significantly associated with MITN. We believe that the kurtosis of tumor ADC values could indicate the presence of MITN and could be a prognostic factor in patients with PC. In conclusion, the kurtosis of tumor ADC values obtained from TA was associated with prognosis and MITN in patients with PC. Therefore, this value could be a quantitative imaging biomarker for predicting OS.Acknowledgements
The authors of this manuscript declare no relationships with any companies whose products or services may be related to the subject matter of the article.References
[1] N. Hiraoka, Y. Ino, S. Sekine, H. Tsuda, K. Shimada, T. Kosuge, J. Zavada, M. Yoshida, K. Yamada, T. Koyama, Y. Kanai, Tumour necrosis is a postoperative prognostic marker for pancreatic cancer patients with a high interobserver reproducibility in histological evaluation, Br J Cancer 103(7) (2010) 1057-65.
[2] R.J. Gillies, P.E. Kinahan, H. Hricak, Radiomics: Images Are More than Pictures, They Are Data, Radiology 278(2) (2016) 563-77.
Figures