0367
Hyperpolarized 13C-Pyruvate MRSI in Prediction of Response to Tyrosine Kinase Inhibition Therapy in Gastric Cancer1Athinoula A. Martinos Center for Biomedical Imaging, Department of Radiology, Massachusetts General Hospital, Boston, MA, United States, 2Department of Radiology, Beth Israel Deaconess Medical Center, Boston, MA, United States
Synopsis
Personalized treatment of gastric cancer remains a major challenge mainly due to lack of an optimal imaging method for detection of early response to treatment. We evaluated the role of Hyperpolarized [1-13C] Pyruvate Magnetic Resonance Spectroscopic Imaging (HP-13C MRSI) for quantitative measurement of early changes in glycolytic metabolism of gastric cancer models upon initiation of afatinib, a pan-receptor tyrosine kinase inhibitor. We showed that HP-13C MRSI is more sensitive for detection of early metabolic changes in gastric cancer after starting treatment with afatinib compared to 18F-FDG PET/MRI, and therefore can be used for early prediction of response to targeted therapies.
Introduction
Gastric cancer (GCa) is the fifth most common cancer and the third leading cause of cancer-related death world.1 The treatment of GCa has recently been revolutionized with the introduction of inhibitors of receptor tyrosine kinases (RTKs) and their downstream signaling pathways including PI3K/AKT/mTOR and MAPK, which promote tumor growth.2 As such, HER2 inhibitors are considered as the first line standard-of-care treatment in advanced GCa. However, response rate to the HER2 inhibitors is low and prognosis remains poor due to the release of a negative feedback loop by HER3. 3-5 Therefore, combined RTK inhibition therapy using the new generation of pan-RTK inhibitors could be a strategy to overcome resistance to current standard anti-HER2 treatment in GCa.6 To identify the patients that most likely benefit from combined RTK inhibitors, it is crucial to develop an image-guided approach that can evaluate early changes in the tumors upon therapy initiation and predict response. Hyperpolarized Magnetic Resonance Spectroscopic Imaging (HP MRSI) is an emerging molecular imaging technique that allows noninvasive, real-time and dynamic measurement of multiple metabolic processes in vivo.7 In GCa, there is a metabolic shift toward anaerobic glycolysis and converting pyruvate to lactate, aka Warburg effect, which can be reversed by inhibition of downstream RTK pathways similar to multiple other type of tumors.8,9 In this study, we propose to evaluate the use of Hyperpolarized [1-13C]Pyruvate Magnetic Resonance Spectroscopic Imaging (HP-13C MRSI) for quantitative measurement of early changes in glycolytic metabolism in gastric cancer (GCa) upon initiation of afatinib, an irreversible pan-RTK inhibitor.Methods
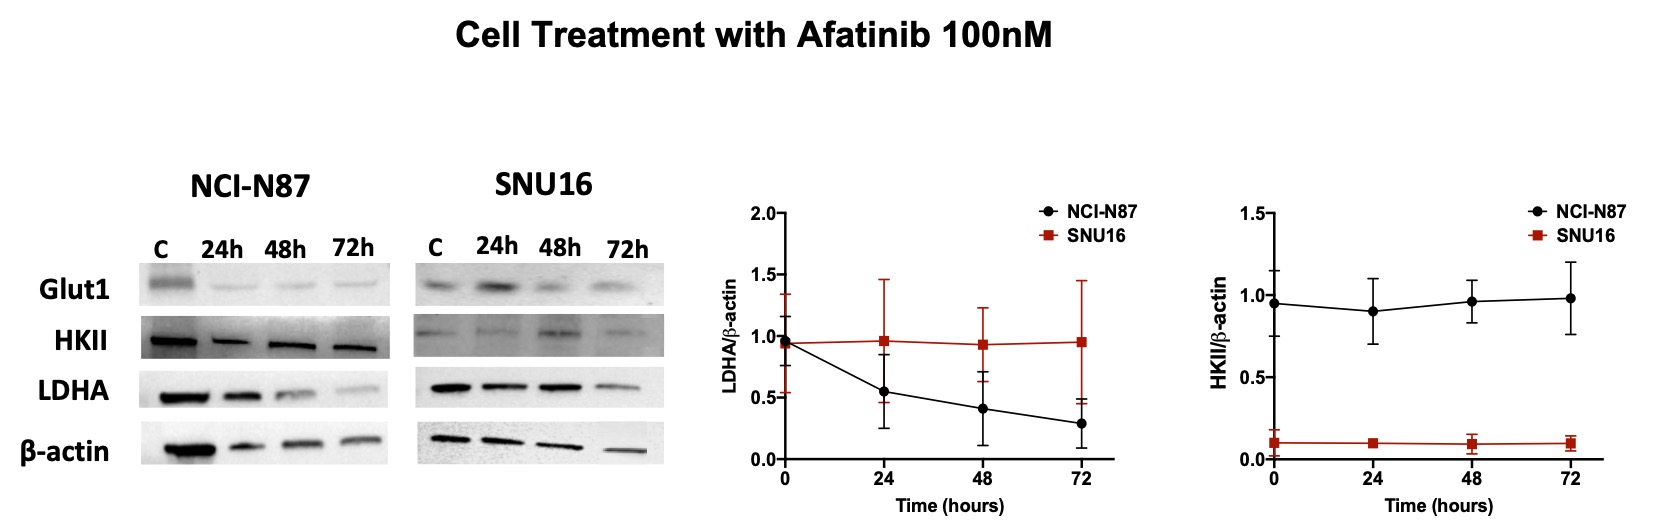
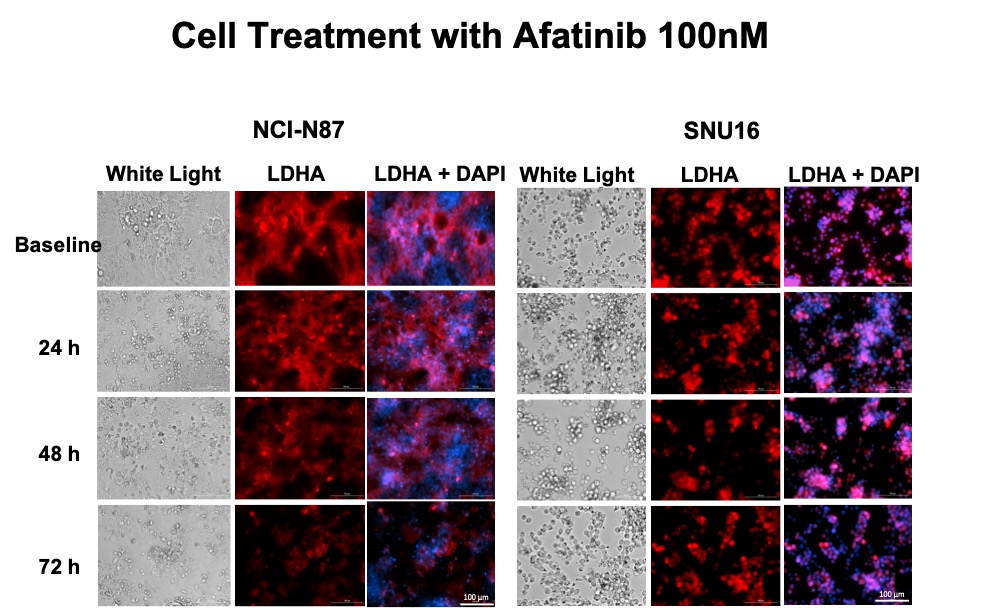
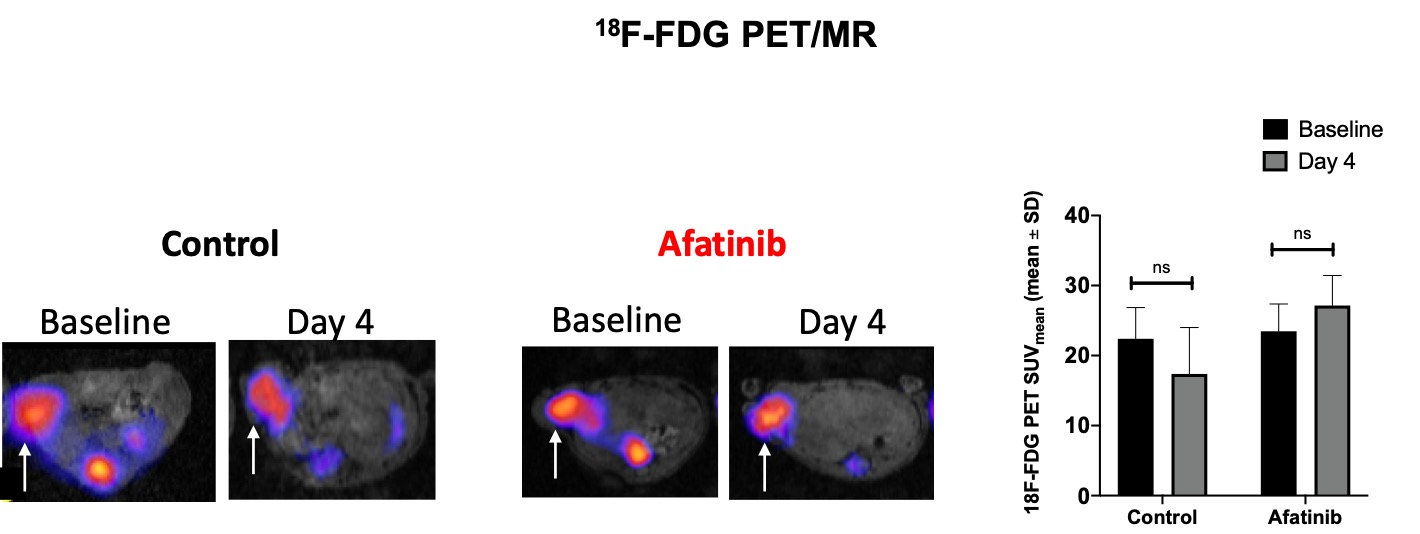
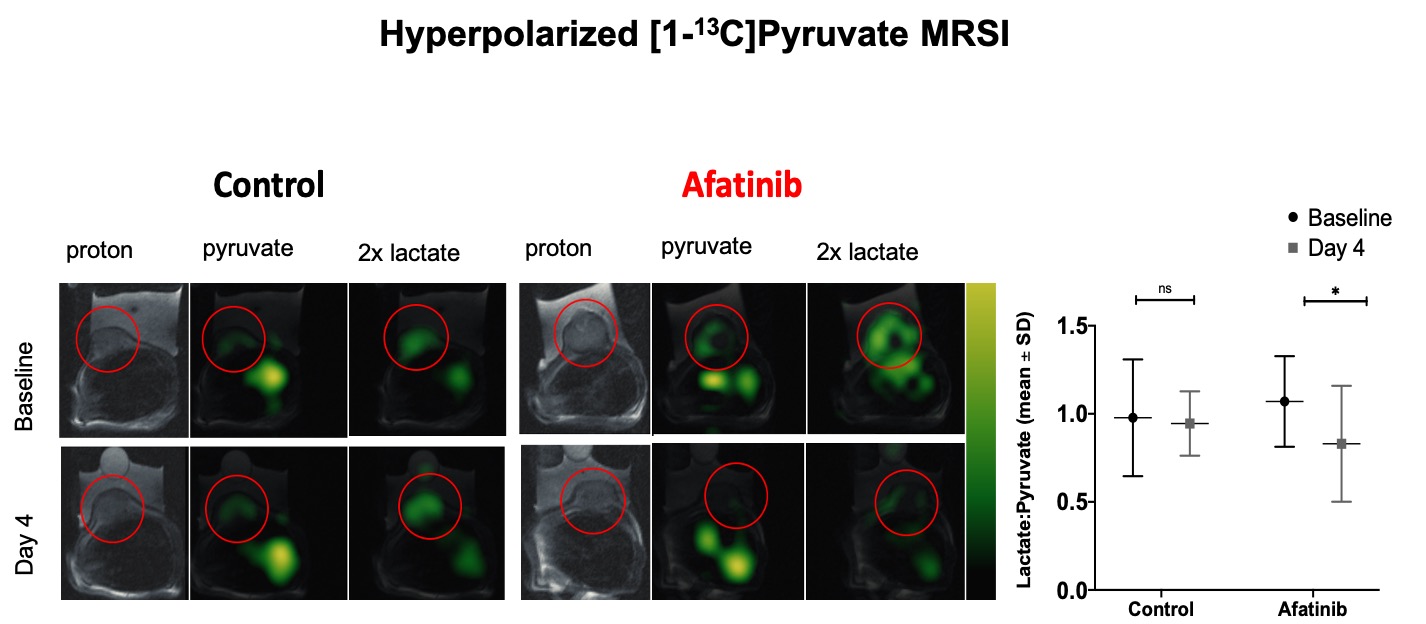
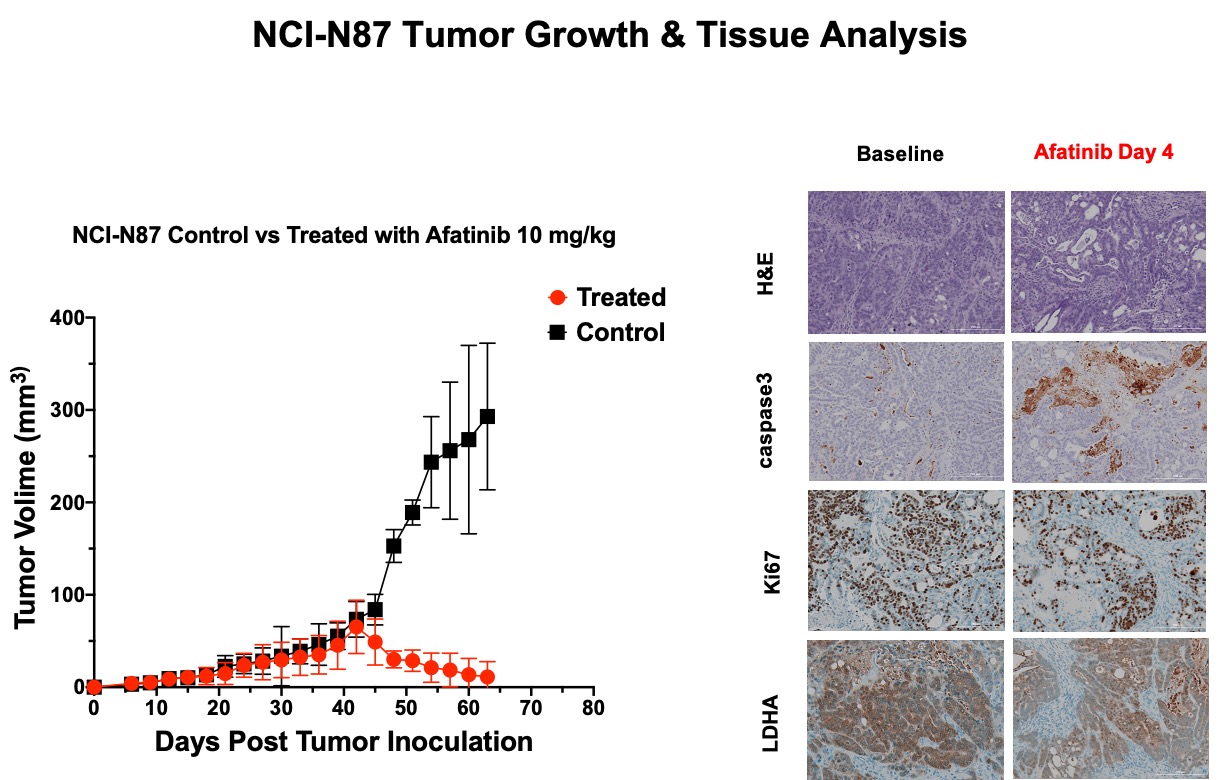
The RTKI afatinib-sensitive NCI-N87 and resistant SNU16 human GCa cells were assessed for baseline and change in levels of Glut1, aerobic glycolysis enzyme Hexokinase II (HKII), and anerobic glycolysis enzyme Lactate Dehydrogenase (LDHA) over 72 hours of treatment with afatinib 100nM by western blot analysis and immunofluorescence. Mouse model of human GCa was generated by subcutaneous inoculation of NCI-N87 cells in nude mice (n=16) and were divided in 2 groups (n=8 each) of treated with afatinib 10mg/kg PO daily, and control treated with vehicle, PO daily. Mice were imaged with 18F-FDG PET/MRI and HP-13C MRSI at baseline and 4 days after treatment and metabolic changes (including SUVmean, SUVmax, Lactate/Pyruvate) were compared between the 2 groups. Tumors growth were monitored biweekly for 3 weeks. Extracted tumors were assessed by H&E, and immunohistochemistry for comparing the expression of LDHA, Caspase3 and Ki-67. Paired and unpaired t-test were used to compare the mean values and p<0.05 was considered significant.Results
Results: In vitro analysis showed continuous decrease in the level of LDHA expression in afatinib sensitive NCI-N87 cells compared to resistant SNU16 cells over 72 hours of treatment with afatinib (Day3/Day1: 0.3 ± 0.06 in NCI-N87 vs. 0.95 ± 0.05 in SNU16, p < 0.05), but no significant change was observed in the level of Glut1 and HKII in either cell types [Fig 1&2]. 18F-FDG PET of control and treated NCI-N87 tumor-bearing mice showed no significant change in the SUVmean and SUVmax at baseline and day 4 of treatment in either group (Day4/Day1 SUVmean: 27.14 ± 4.2 / 23.46 ± 3.8, p = 0.57 in treated group, 17.3±6.6 / 22.4±4.3 p=0.84 in control) [Fig 3]. While the tumors size did not significantly change within 4 days of treatment, HP-13C MRSI demonstrated significant change in anaerobic glycolytic metabolism between the 2 groups with decreased pyruvate to lactate conversion in treated tumors at day 4 compared to baseline (L/P of Day4/Day0: 0.83 ± 0.3 / 1.1 ± 0.2, p = 0.012 in treated group vs. 0.94 ± 0.2 / 0.98 ± 0.3, p > 0.05 in control) [Fig 4]. Response to afatinib was confirmed with decreased tumor volume over 3 weeks of treatment with afatinib compared to vehicle (11.1 ±16.5 in treated vs. 293 ±79.3 mm3 in control, p < 0.001) [Fig 5]. Histopathologic evaluation confirmed the in-vivo HP-13C MRS imaging results [Fig 5].Discussion
Our study showed that HP-13C MRSI is more sensitive for detection of early metabolic changes in GCa after initiation of pan-RTKI treatment compared to 18F-FDG PET/MRI. We showed a significant decrease in pyruvate to lactate conversion in the tumors only 4 days after initiation of treatment, while the anatomic MR imaging demonstrated no significant change in the size of the tumors and PET demonstrated no significant difference in the 18F-FDG uptake between the treated and control groups. These promising results suggest that HP-13C MRSI can be used for early prediction of response to targeted therapies.Conclusion
HP-13C MRSI shows glycolytic metabolic changes in GCa within few days after initiation of standard RTK inhibition therapy. Translation of this imaging method provides a non-invasive tool that enables personalized clinical care of the patients through early prediction and optimization of response to treatment.Acknowledgements
This study has been funded by Research Resident Grant from RSNA R&E Foundation, Ralph Schlaeger Fellowship Grant from Massachusetts General Hospital and R21GM137227-01.References
1. Bray F, Ferlay J, Soerjomataram I, et al. Global cancer statistics 2018: GLOBOCAN estimates of incidence and mortality worldwide for 36 cancers in 185 countries. CA Cancer J Clin. 2018; 68: 394-424.
2. Matsuoka T, Yashiro M. Recent advances in the HER2 targeted therapy of gastric cancer. World J Clin Cases. 2015; 3: 42-51.
3. Abrahao-Machado LF, Scapulatempo-Neto C. HER2 testing in gastric cancer: An update. World J Gastroenterol. 2016; 22: 4619-4625.
4. Cao GD, Chen K, Xiong MM, et al. HER3, but Not HER4, Plays an Essential Role in the Clinicopathology and Prognosis of Gastric Cancer: A Meta-Analysis. PLoS One. 2016; 11: e0161219.
5. Wu X, Chen Y, Li G, et al. Her3 is associated with poor survival of gastric adenocarcinoma: Her3 promotes proliferation, survival and migration of human gastric cancer mediated by PI3K/AKT signaling pathway. Med Oncol. 2014; 31: 903.
6. Zhang Z, Wang J, Ji D, et al. Functional genetic approach identifies MET, HER3, IGF1R, INSR pathways as determinants of lapatinib unresponsiveness in HER2-positive gastric cancer. Clin Cancer Res. 2014; 20: 4559-4573.
7. Wang ZJ, Ohliger MA, Larson PEZ, et al. Hyperpolarized (13)C MRI: State of the Art and Future Directions. Radiology. 2019; 291: 273-284.
8. Di Gialleonardo V, Aldeborgh HN, Miloushev V, et al. Multinuclear NMR and MRI Reveal an Early Metabolic Response to mTOR Inhibition in Sarcoma. Cancer Res. 2017; 77: 3113-3120.
9. Ravoori MK, Singh SP, Lee J, et al. In Vivo Assessment of Ovarian Tumor Response to Tyrosine Kinase Inhibitor Pazopanib by Using Hyperpolarized (13)C-Pyruvate MR Spectroscopy and (18)F-FDG PET/CT Imaging in a Mouse Model. Radiology. 2017; 285: 830-838.
Figures