0365
MRI Implant Safety: Method for RF Heating In-Vivo-Transfer Required from ASTM Standard F21821Murbach EMConsulting, Zurich, Switzerland, 2MR:comp GmbH, Gelsenkirchen, Germany, 3MRI-STaR - Magnetic Resonance Institute for Safety, Technology and Research GmbH, Gelsenkirchen, Germany
Synopsis
This study aims at exploring an alternative method (Tier 2.5) to estimate realistic in vivo E-fields at implant locations by including the directivity and length of the implants, which neglects non-relevant E-field components and too localized averaging schemes. The latest revision of the ASTM standard F2182-19e2 requires establishing a relation of the temperature increase near a metallic implant between A) the experimental measurement and B) the in vivo estimation in a representative patient population. The usage of currently standardized methods results in presumably overly conservative estimations, causing implant labels to be up to a factor 10 more restrictive.
Introduction
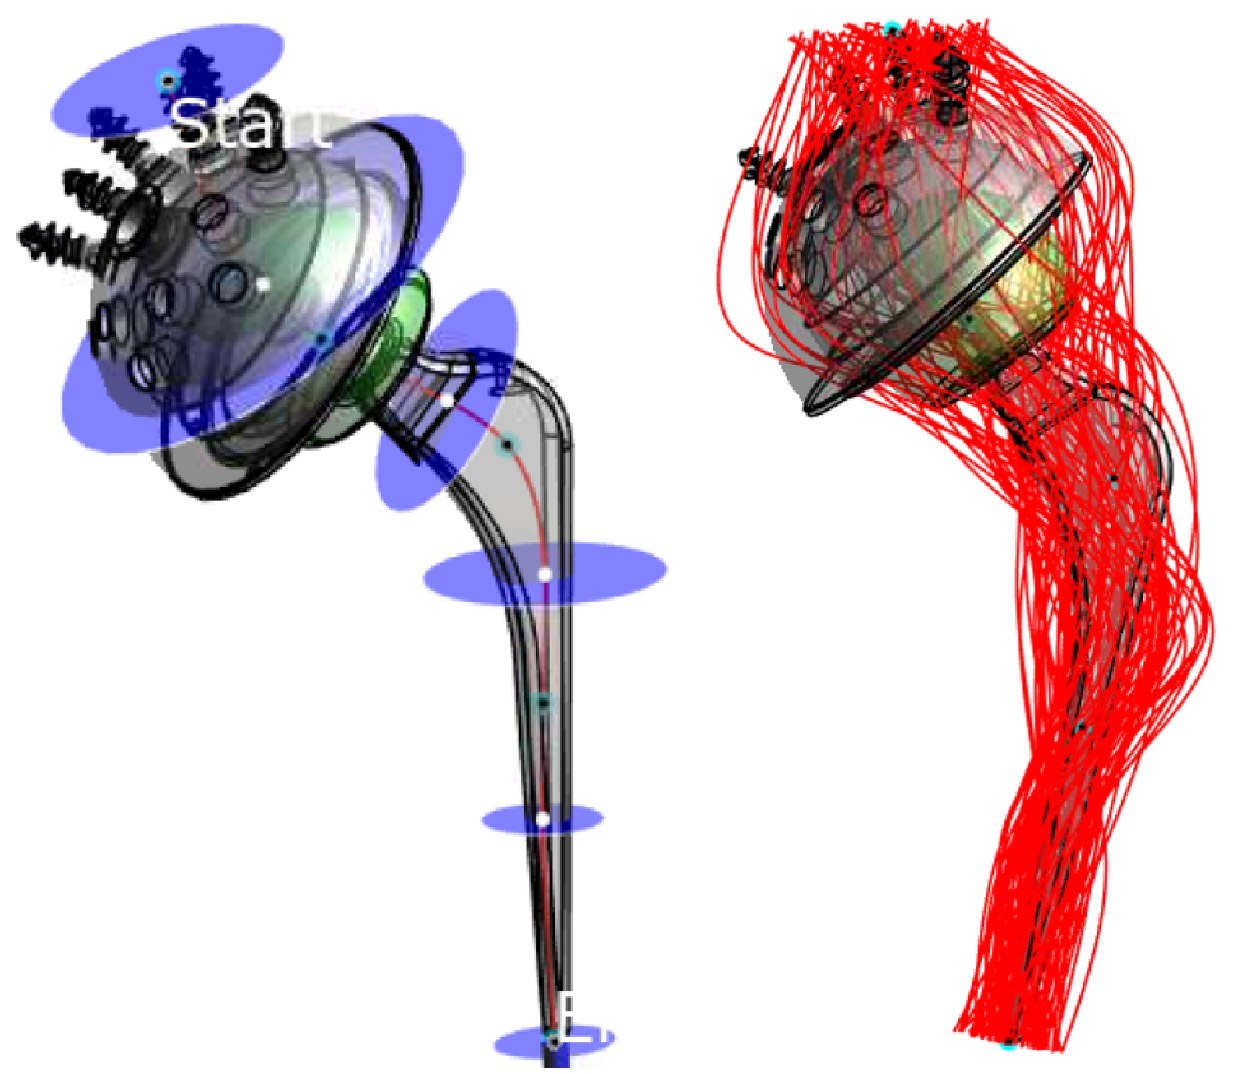
Metallic passive implants pose a significant health risk to the patient, when undergoing MRI examination. The induced electric fields may be “collected” along the implant and deposited at its endings, leading to very localized heating. Therefore, several test methods describe how to assess the potential risk. The latest ASTM standard revision F2182-19e21 now states: “The implant manufacturer is responsible for establishing the relationship between ΔT for the implant tested in the gelled-saline filled phantom and the ΔT that is expected in the patient population under the specified exposure conditions specified in the MR labeling” (Section §9.1). This includes at least a comparison of 1) the implant exposure level (homogenous E-field in the test phantom; very heterogeneous E-field in the patient), and 2) of the induced temperature increase (tissue simulating non-perfused gel in the test phantom; biological tissues in the patient with blood perfusion). This study aims at covering 1).Standardized estimation methods in vivo (ISO/TS 10974; Tier 2)2 result in very high E-fields, which are presumably overly conservative and manyfold higher (up to factor >3; factor >10 in power/temperature) than a typical ASTM test E-field. One aim of this study is to evaluate representative E-Field values from this Tier 2 evaluation, and to compare it to the ASTM field levels. Realistic and not overly conservative estimations are very challenging. The presented method is including the directivity of the implant and its length. Both of which is not considered in the standardized Tier 2 approach, where the total E-field is averaged over 10g, and the cube-length result in a spatial averaging of approximately 22 mm. To cover the three dimensions of the implant, a set of one-dimensional trajectories are introduced (Figure 1), estimating all possible tangential E-field components the implant may be subjected to.
Methods
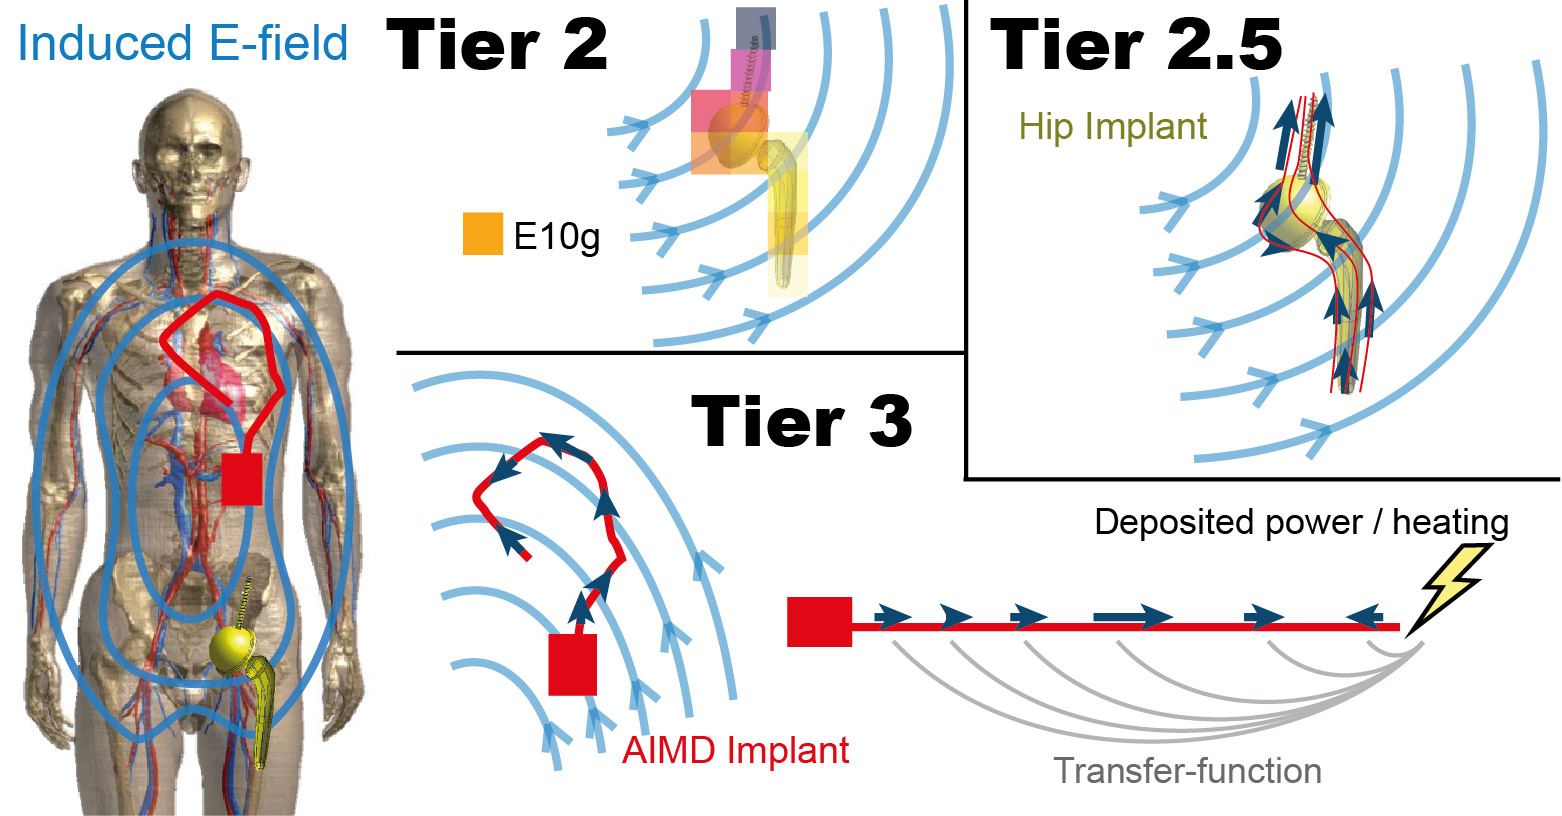
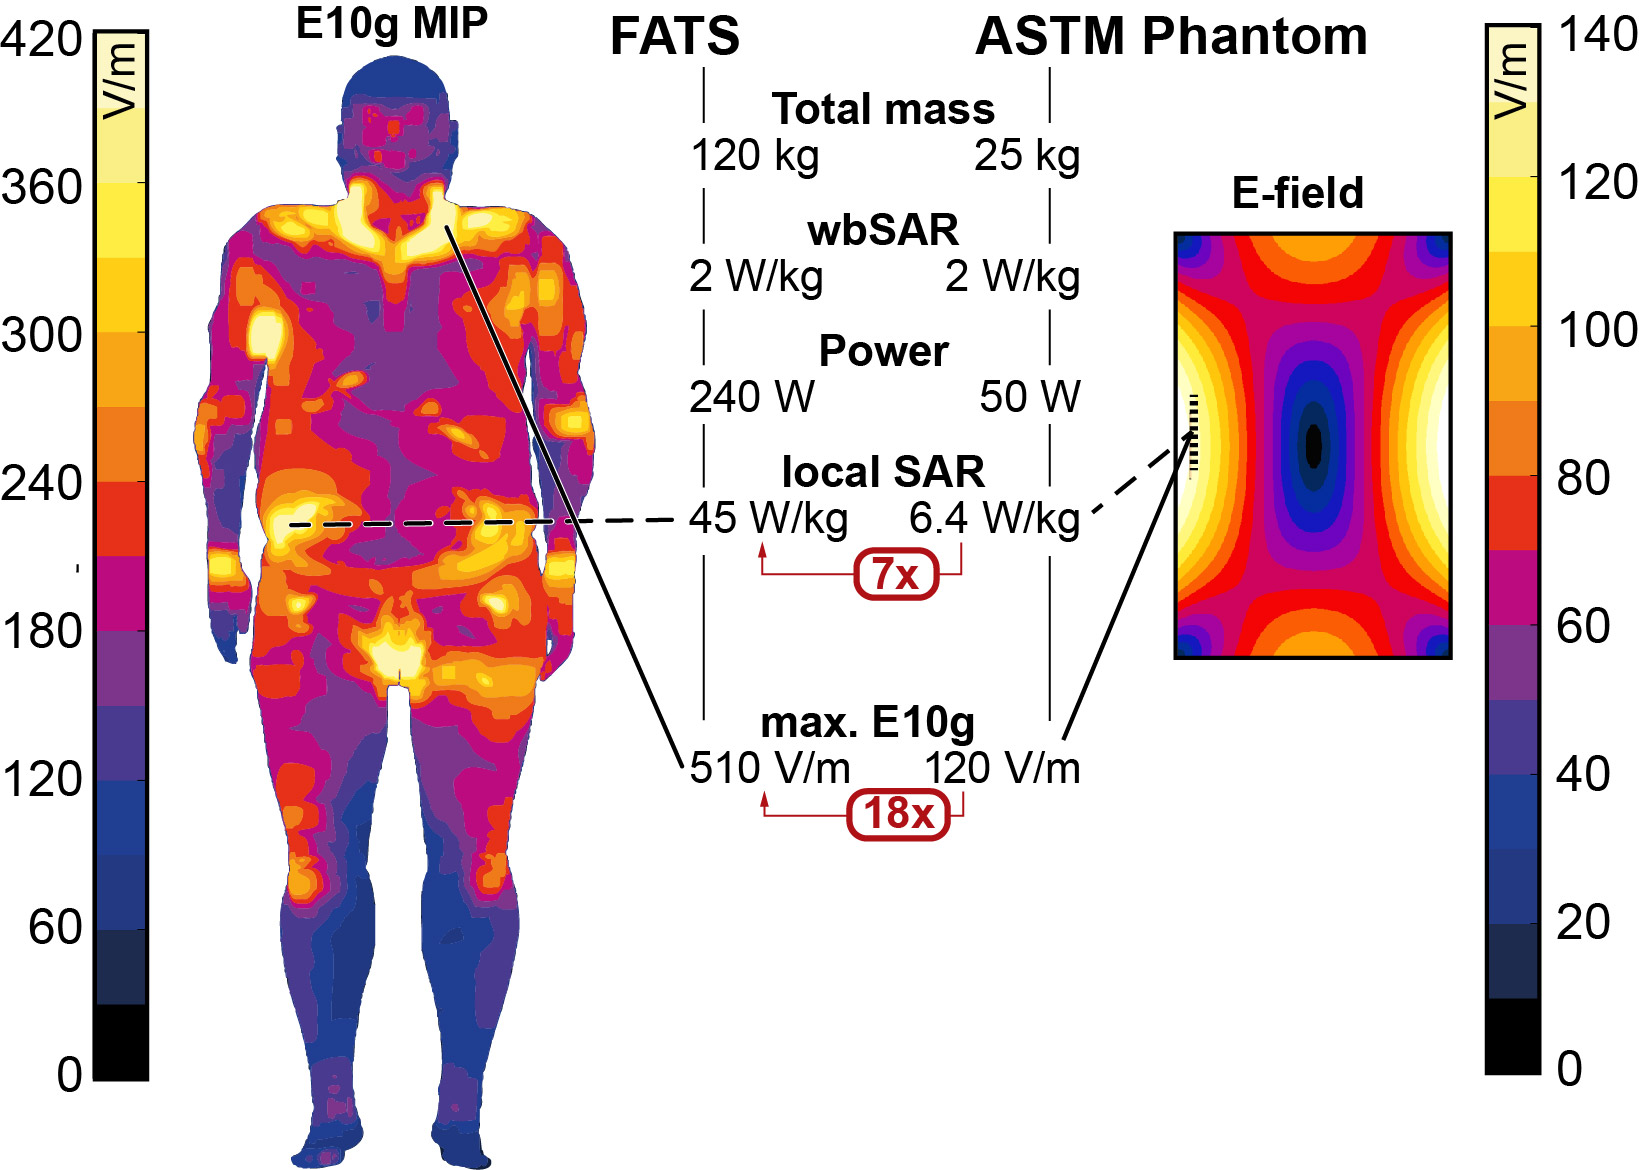
The ASTM test E-field (approx. 120 V/m) is compared to the in vivo E-field, where the peak E10g can exceed 500 V/m (Figure 3). In the here proposed Tier 2.5 method, multiple trajectories (Figure 1) are drawn to cover the incident E-fields of the implant of interest. The tangential E-field is evaluated with the standardized Tier 3 Method and averaged without phase information and without using the transfer-function. 100 trajectories have been evaluated per implant, including one implant with 1000 trajectories for sensitivity comparison. Estimations are based on the MRIxViP library (IT’IS Foundation, Zurich, Switzerland), and evaluated with the IMAnalytics framework (Zurich MedTech, Zurich, Switzerland). All fields are normalized to the normal operating mode and a maximum of 7 μT B1+rms at 1.5T, and 3.5 μT B1+rms at 3T, averaged on the axial central slab according to the IEC standard3. The maximum B1+rms is a hardware limit derived from ISO/TS2. A comparison of the Tier 2, Tier 2.5, and Tier 3 method is shown in Figure 2.Results and Discussion
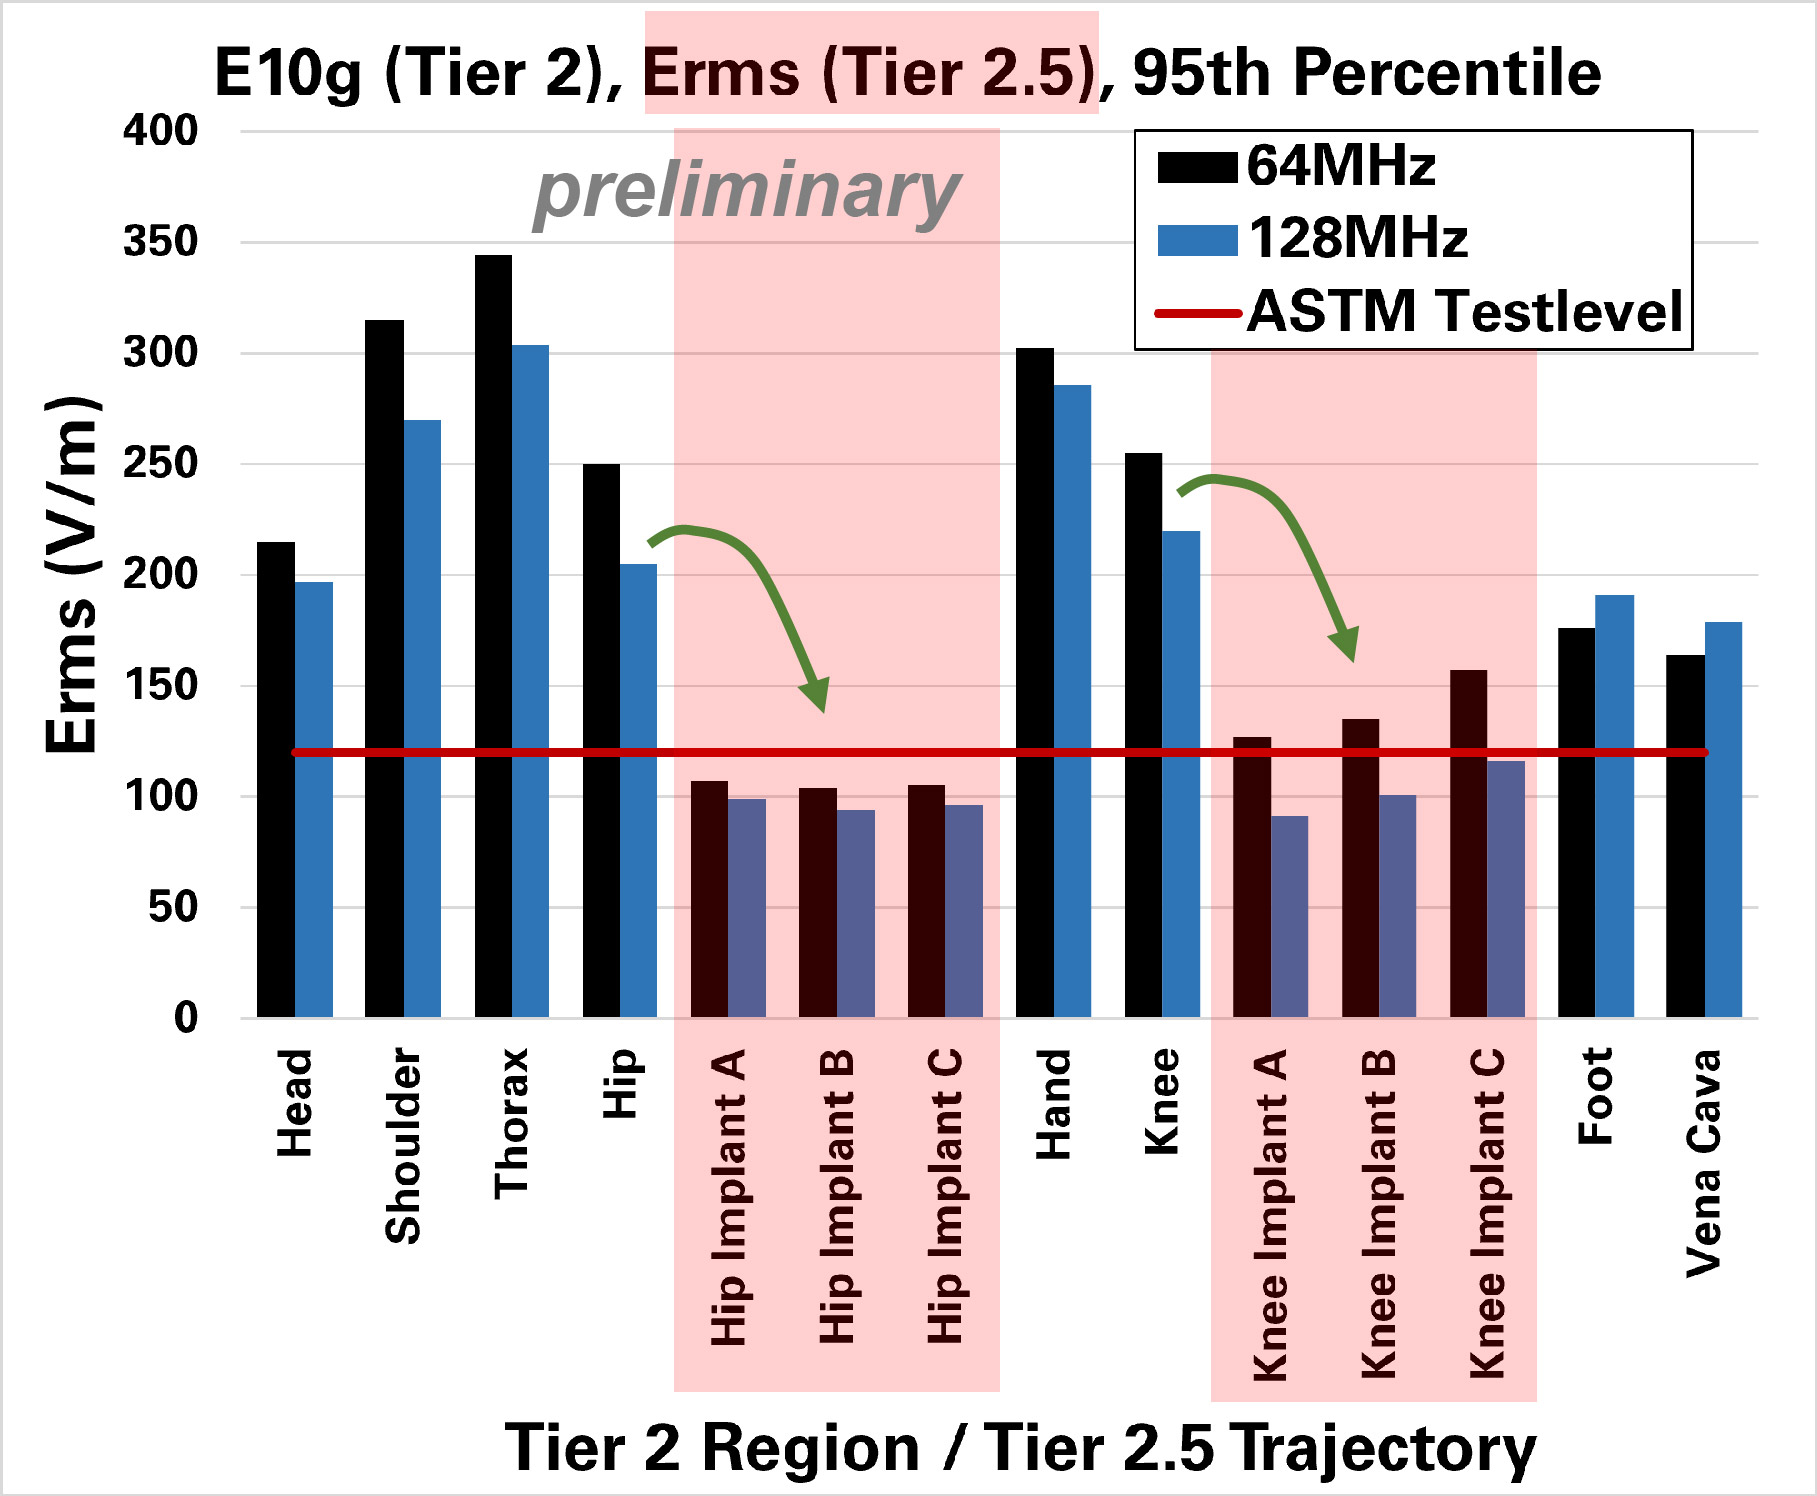
With the standardized Tier 2 method (which includes a 95th percentile), preliminarily evaluated regions show up to > 300 V/m (Figure 4). In our here proposed method Tier 2.5, the two evaluated implants (hip and knee) show an averaged E-field of around 100 – 150 V/m (Figure 4). For the corresponding knee and hip regions, Tier 2 evaluations showed >200 V/m, which is a factor >1.6 higher than the ASTM test E-field, and a factor >2.8 higher in power/temperature. This means, that a given implant that has shown a temperature increase of 6°C in ASTM testing would now have to be rated for a >17°C increase, following §9.1 of ASTM. The estimation with Tier 2.5 shows E-field levels comparable to the ASTM test E-field.Conclusions
The proposed Tier 2.5 evaluation scheme for short passive implants may provide a relevant estimate for the in vivo E-field, without being overly conservative. This could serve as a practical approach to fulfill the in vivo comparison requirement in the latest revision of the ASTM standard. A broad validation series with direct implant simulations will need to be performed to confirm that the Tier 2.5 approach is conservatively covering the estimation of the relevant E-field components for implant heating. The assessment will include validating the assumption that phase effects are negligible for relatively short implants in the MR exposure scenario, which has small phase-shifts.Acknowledgements
No acknowledgement found.References
1. ASTM. F2182-19e2. Standard Test Method for Measurement of Radio Frequency Induced Heating On or Near Passive Implants During Magnetic Resonance. 2020.
2. ISO/TS. 10974:2018, Assessment of the safety of magnetic resonance imaging for patients with an active implantable medical device. ISO/TS 10974 2018.
3. IEC. Medical electrical equipment - Part 2-33: Particular requirements for the basic safety and essential performance of magnetic resonance equipment for medical diagnosis, Edition 3.2. IEC 60601-2-332010+AMD12013+AMD22015 CSV 2015.
Figures