0359
An Investigation of SAR Values Induced Near an Orthopedic Implant at 7T Relative to Lower Fields: A Simulation Study1Radiology, Mayo Clinic, Rochester, MN, United States
Synopsis
Electromagnetic simulations were performed to investigate the maximum local 1g-averaged SAR induced in tissue adjacent to orthopedic screws of varying lengths across field strengths ranging from 3T to 7T. Simulated input power values were initially normalized to a constant transmitted power of 1W and further normalized to ensure a constant background B1+ value. SARmax was approximately 36% lower than the peak near 4T. The results demonstrate that RF-induced tissue heating near implants can, in certain circumstances, be lower at higher fields.
Introduction
The imaging at 7T of patients with implanted metallic devices remains an area of concern, with no consensus on safety and a lack of testing and certification by manufacturers. Consequently, with the exception of some very small middle ear implants, no orthopedic implants have been certified as MR Conditional at 7T. As such, the imaging of patients with orthopedic implants, particularly those within the RF transmit field, must currently be done off-label, with appropriate risk/benefit analyses performed in each case1. This presents a significant barrier to the clinical adoption of 7T MRI technology, and in particular for the recruitment of subjects onto research studies, considering the prevalence of orthopedic implants in the general population. However, the implicit assumption that RF-induced heating adjacent to metallic implants is greater at higher field strengths has not been studied in detail, and competing physical processes govern the magnitude of the electric fields generated in tissue close to an elongated, sharp implant tip2. Thus, although the background E-field increases with RF frequency, the E-field created in the tip by the background E-field decreases with frequency (provided that half the RF wavelength in tissue remains less than the implant and Tx coil lengths). The aim of this work was to investigate the maximum local 1g-averaged SAR induced in a simulated orthopedic screw as a function of magnetic field strength from 3T to 7T, in a model system which ensured homogeneity of the B1+ field, and hence flip angle, along the entire length of the screw at all field strengths. The screw length was varied to ensure maximum SAR at the resonant length at each respective field strength was compared.Methods
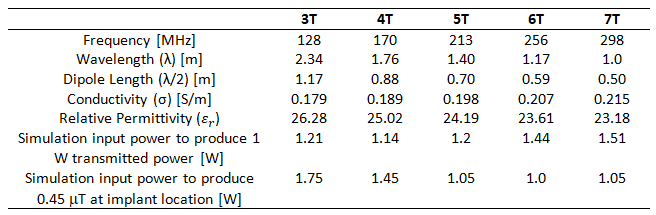
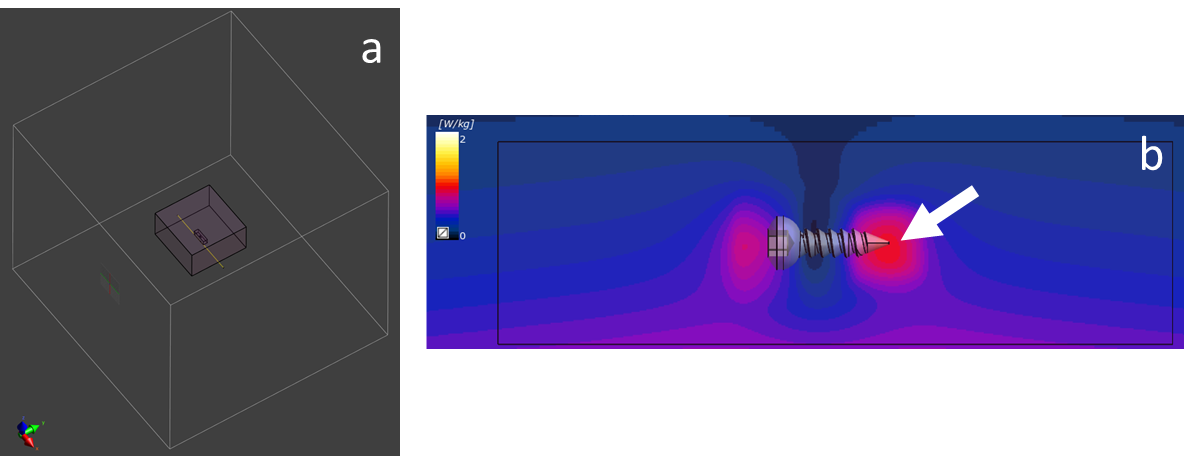
EM simulations were performed within a finite-difference time-domain solver package (Sim4Life, ZMT, Switzerland). A tissue volume of 40x40x20cm3, large enough to avoid boundary effects, was assigned dielectric properties of bone at each field strength (Figures 1&2a), and separately also assigned properties of muscle tissue at 7T (σ=0.744S/m, εr=54.57). Bone screw models with lengths ranging from 18-183mm were placed within the tissue volume, at a distance of 40mm from a dipole antenna. A higher simulation mesh density was used in a small volume around the screw (Figure 2a). The dipole antenna, rather than a birdcage-type RF coil model, was used to generate a uniform background electric field at the implant location. This ensured that the E-field was parallel to, and did not vary along the length of, the screws for all screw lengths investigated and at each field strength, with the background E-field subtracted before calculating the SAR in each case, thereby removing the E-field as a confounding factor from the SAR determination. Simulations were performed using a dedicated GPU (Tesla V100, NVIDIA, USA), each taking approximately 4 hours to run. Two separate normalization methods for the simulation input power were implemented: initially, to ensure an identical power (1 W) was transmitted into the tissue volume, accounting for coil reflection losses; secondly, to ensure a uniform B1+ magnitude (0.45µT), and hence flip angle, was achieved at the implant location. The resultant normalized input power levels are presented in Figure 1. The maximum SAR value (SARmax) for each crew length and field strength was determined from each simulation, always located at the tip (Figure 2c).Results
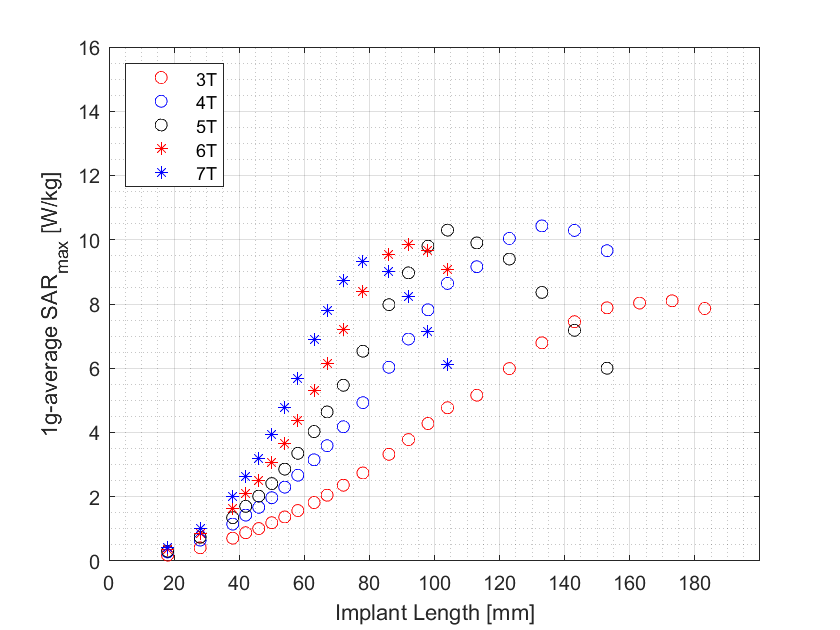
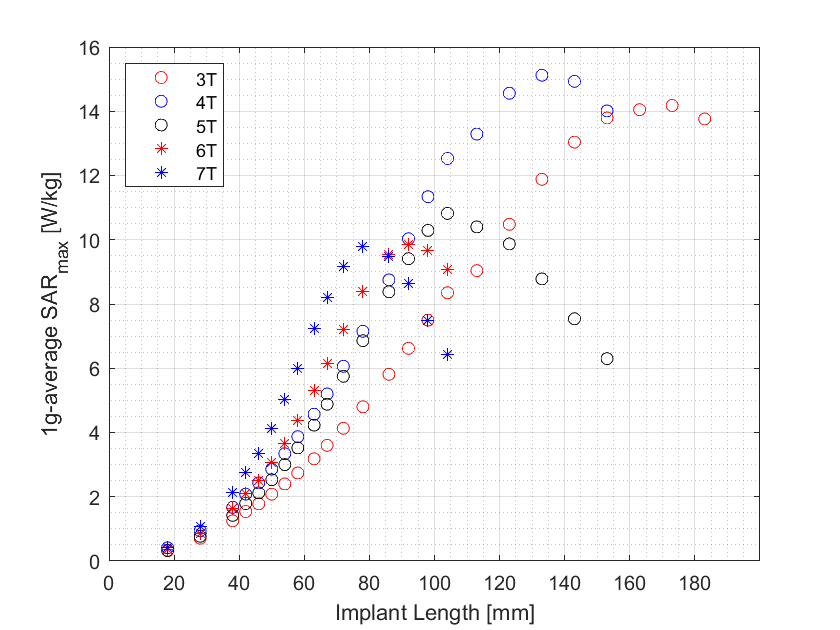
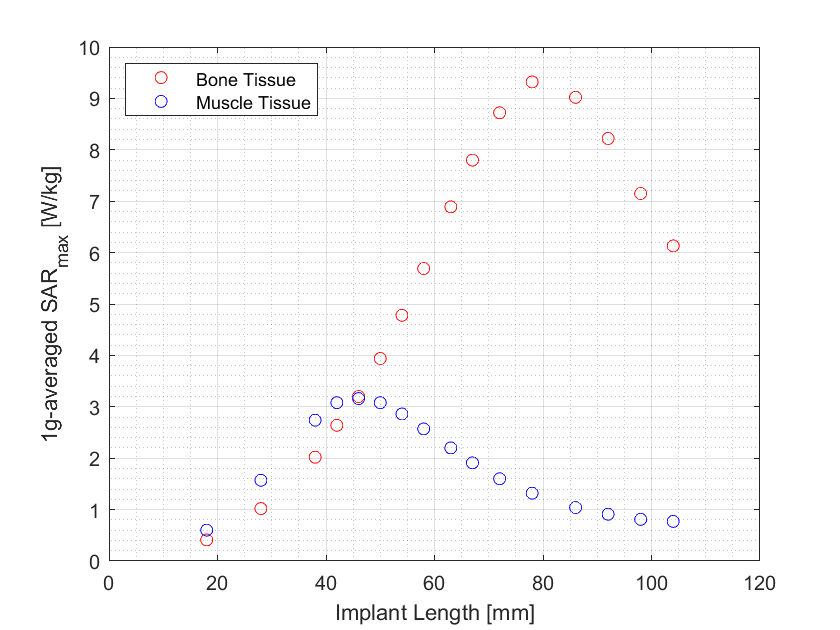
SARmax as a function of screw length and field strength is presented in Figure 3 for a constant transmitted power of 1W into the tissue volume. The corresponding graph following normalization to a constant B1+ (flip angle) at the implant is presented in Figure 4, showing a SARmax peak around 4T and a 36% reduction at 7T. The implant length at which the SARmax was measured for all field strengths occurred at approximately one-third of the wavelength, as expected. SARmax values were shifted to longer implant lengths in bone compared to muscle (Figure 5).Discussion
SARmax was similar from 4-7T when the RF power transmitted by the dipole antenna was normalized to 1W. However, in practice, MRI systems establish a reference transmitted RF power level necessary to produce a 90° flip angle in the volume of interest, and hence this must be considered when comparing SARmax values across field strengths. For the specific experimental set-up investigated herein, this reduced the simulated SARmax at 7T relative to lower fields. A previous study reported a SAR peak occurring between 3T and 7T, with factors such as the number of transmit channels and sample size found to strongly influence the field strength where the peak occurred3. Further studies investigated SAR at different field strengths, but did not correct for variable background E-fields generated by the RF coil at the implant location, which invariably influenced the results presented4, 5, 6, 7.Conclusion
The effect of field strength on the maximum simulated 1g-averaged SAR at the tip of an orthopedic screw implant was investigated, with lower SARmax values determined at 7T that at lower field strengths. The results, although pertaining only to the specific experimental set-up investigated herein, highlight that RF-induced tissue heating may not necessarily be significantly higher at 7T compared to lower fields, as conventionally assumed.Acknowledgements
One author (PSJ) is in receipt of support from NIH NIGMS 5 R25 GM075148References
1. Fagan, A.J., et al., 7T MR Safety. Journal of Magnetic Resonance Imaging, 2020. DOI: 10.1002/jmri.27319
2. Winter, L., et al., MRI-Related Heating of Implants and Devices: A Review. Journal of Magnetic Resonance Imaging, 2020: p. 1-20.
3. Deniz, C.M., et al., Radiofrequency energy deposition and radiofrequency power requirements in parallel transmission with increasing distance from the coil to the sample. Magnetic Resonance in Medicine, 2016. 75(1): p. 423-432.
4. Nyenhuis, J.A., et al., MRI and Implanted Medical Devices : Basic Interactions With an Emphasis on Heating. 2005. 5(3): p. 467-480.
5. Guo, R., et al., Computational and experimental investigation of RF-induced heating for multiple orthopedic implants. Magnetic Resonance in Medicine, 2019. 82(5): p. 1848-1858.
6. Song, T., et al., Retrospective analysis of RF heating measurements of passive medical implants. Magnetic Resonance in Medicine, 2018. 80(6): p. 2726-2730.
7. Nguyen, B.T., J. Pilitsis, and L. Golestanirad, The effect of simulation strategies on prediction of power deposition in the tissue around electronic implants during magnetic resonance imaging. Phys Med Biol, 2020. 65(18): p. 185007.
Figures