0357
Effect of transmit frequency on RF heating of metallic implants1Center for Image Sciences - Computational Imaging Group, University Medical Center Utrecht, Utrecht, Netherlands, 2TNO, Utrecht, Netherlands, 3Medtronic, Minneapolis, MN, United States, 4Biomedical Engineering - Medical Imaging Analysis, Eindhoven University of Technology, Eindhoven, Netherlands
Synopsis
The effect of transmit frequency on the risk of RF heating for elongated metallic implants was investigated through simulations in a phantom and a human model for 21, 64, 128 and 300 MHz. We demonstrate that for uniform E-field exposure, worst-case E-field enhancement at the tip reduces with increasing transmit frequency. However, for realistic E-field exposures, E-field enhancement increases with transmit frequency for similar B1+ levels. For similar head SAR levels, E-field enhancement for worst-case implant length is roughly equal for all transmit frequencies. In all cases implant length is the main determinant of RF heating.
Introduction
Ultrahigh field MRI is rapidly progressing towards clinical application1. Implant safety at these field strengths is mostly unexplored territory. Most implants that are considered safe or conditional at 1.5T and 3T are considered unsafe at 7T2. Vice versa, scanners operating at low field (e.g. 0.5T) are considered less susceptible to implant heating3. In all cases, elongated metallic structures such as the leads of active implantable medical devices (AIMDs) are at risk of RF heating. These structures can cause local tissue heating as a result of RF induced currents, which cause E-field enhancement around the tip of the implant resulting in heating4–6. Incident electric fields from the coil, the implant length compared to the wavelength and tissue loading all depend on the transmit frequency and can have a strong impact on the magnitude of RF heating7,8. However, there is a general lack of knowledge on how these parameters affect RF heating. Therefore, we performed a simulation study on the effect of transmit frequency on RF heating of metallic implants.Methods
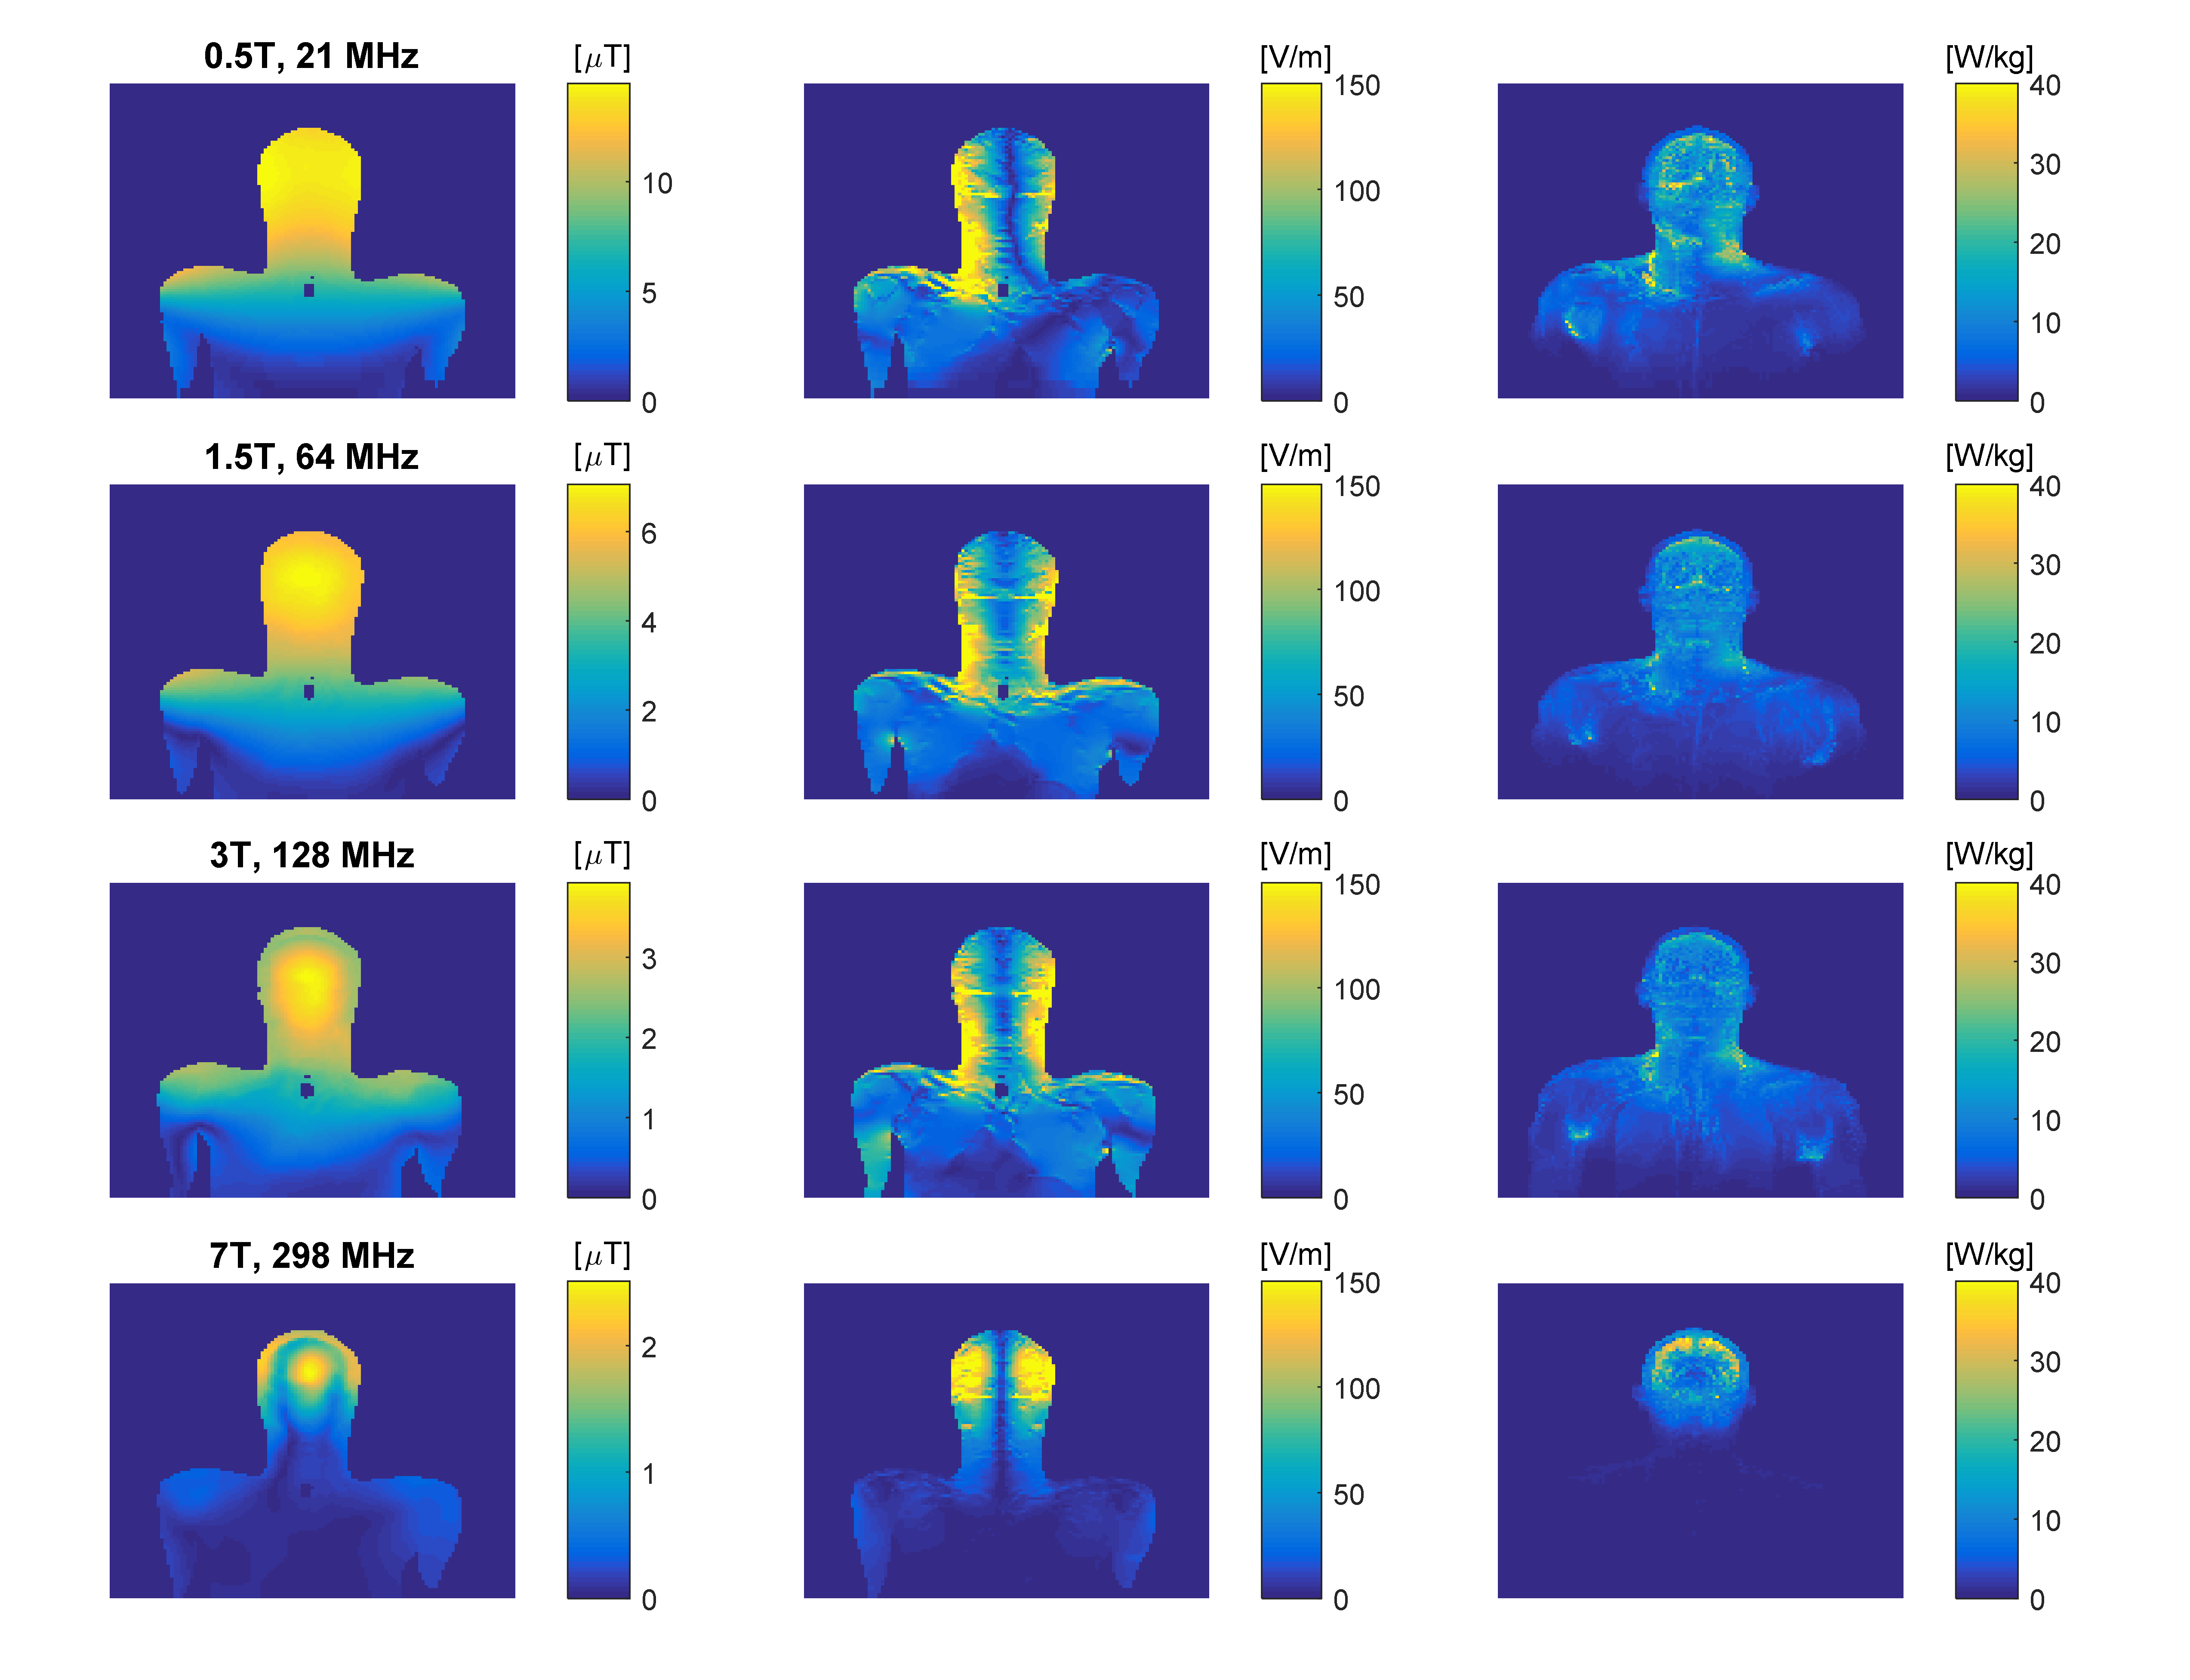
Electromagnetic simulations were done in Sim4Life (Zurich Med Tech, Zurich, Switzerland). Simulations were performed at transmit frequencies of 21, 64, 128 and 298 MHz. First, 31 straight copper wires of various lengths (Ø = 2.0 mm, L = 3.0-44.0 cm) were simulated with and without a 4 mm thick insulation layer (εr = 2.2, σ = 0.0 S/m). The wires were placed inside a medium with electrical properties resembling human tissue at 64 MHz (εr = 78, σ = 0.47 S/m). Electric fields were generated in the phantom with uniform plane wave excitation, with a linearly increasing phase along the wire.To generate realistic E-field exposures, human model Duke (virtual family9) was positioned with the head in the isocenter of the RF coil. At 21-128MHz, a body-coil (Philips Ingenia, Philips Healthcare, Best, The Netherlands) was used while at 7T a head-coil was used (Nova Medical, Wilmington, USA). For 4 different wire lengths (5, 15, 30 and 60cm, insulated and non-insulated), transfer functions were determined based on simulations with and without the wire present10,11. Using simulated electric fields in the human model without the implant, the induced current at the implant tip can be predicted as12:
$$I_{tip}=TF*E_{tan}$$
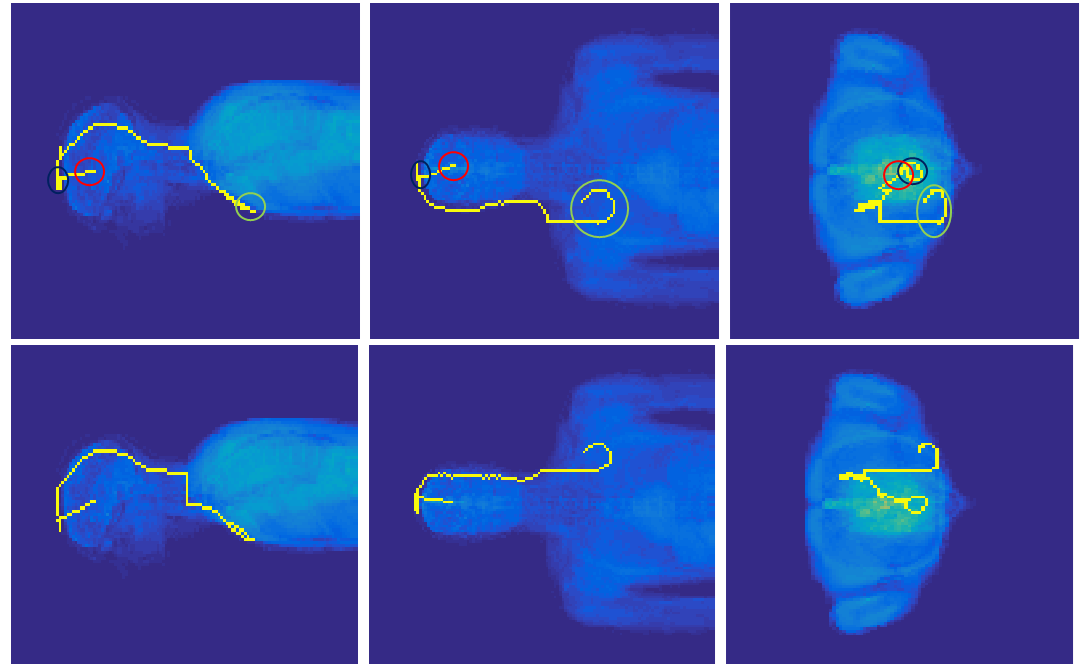
With Etan the incident electric field tangential to the wire direction and TF the transfer function. Tip currents were calculated for all wire lengths and possible positions inside Duke and oriented along the z-direction. Tip currents were used as a proxy for RF heating, since electric fields are caused by charge accumulation which scales with the current magnitude shortly before the tip. Additionally, 10.000 clinically relevant deep brain stimulator (DBS) trajectories (length 30cm and 60cm) were defined inside the brain and again induced current at the tip was calculated. The method13 for defining the DBS trajectories, and two exemplary trajectories, are shown in figure 2. The DBS trajectories resulting in the highest tip current were imported into Sim4Life to simulate SAR as a final verification.
Results
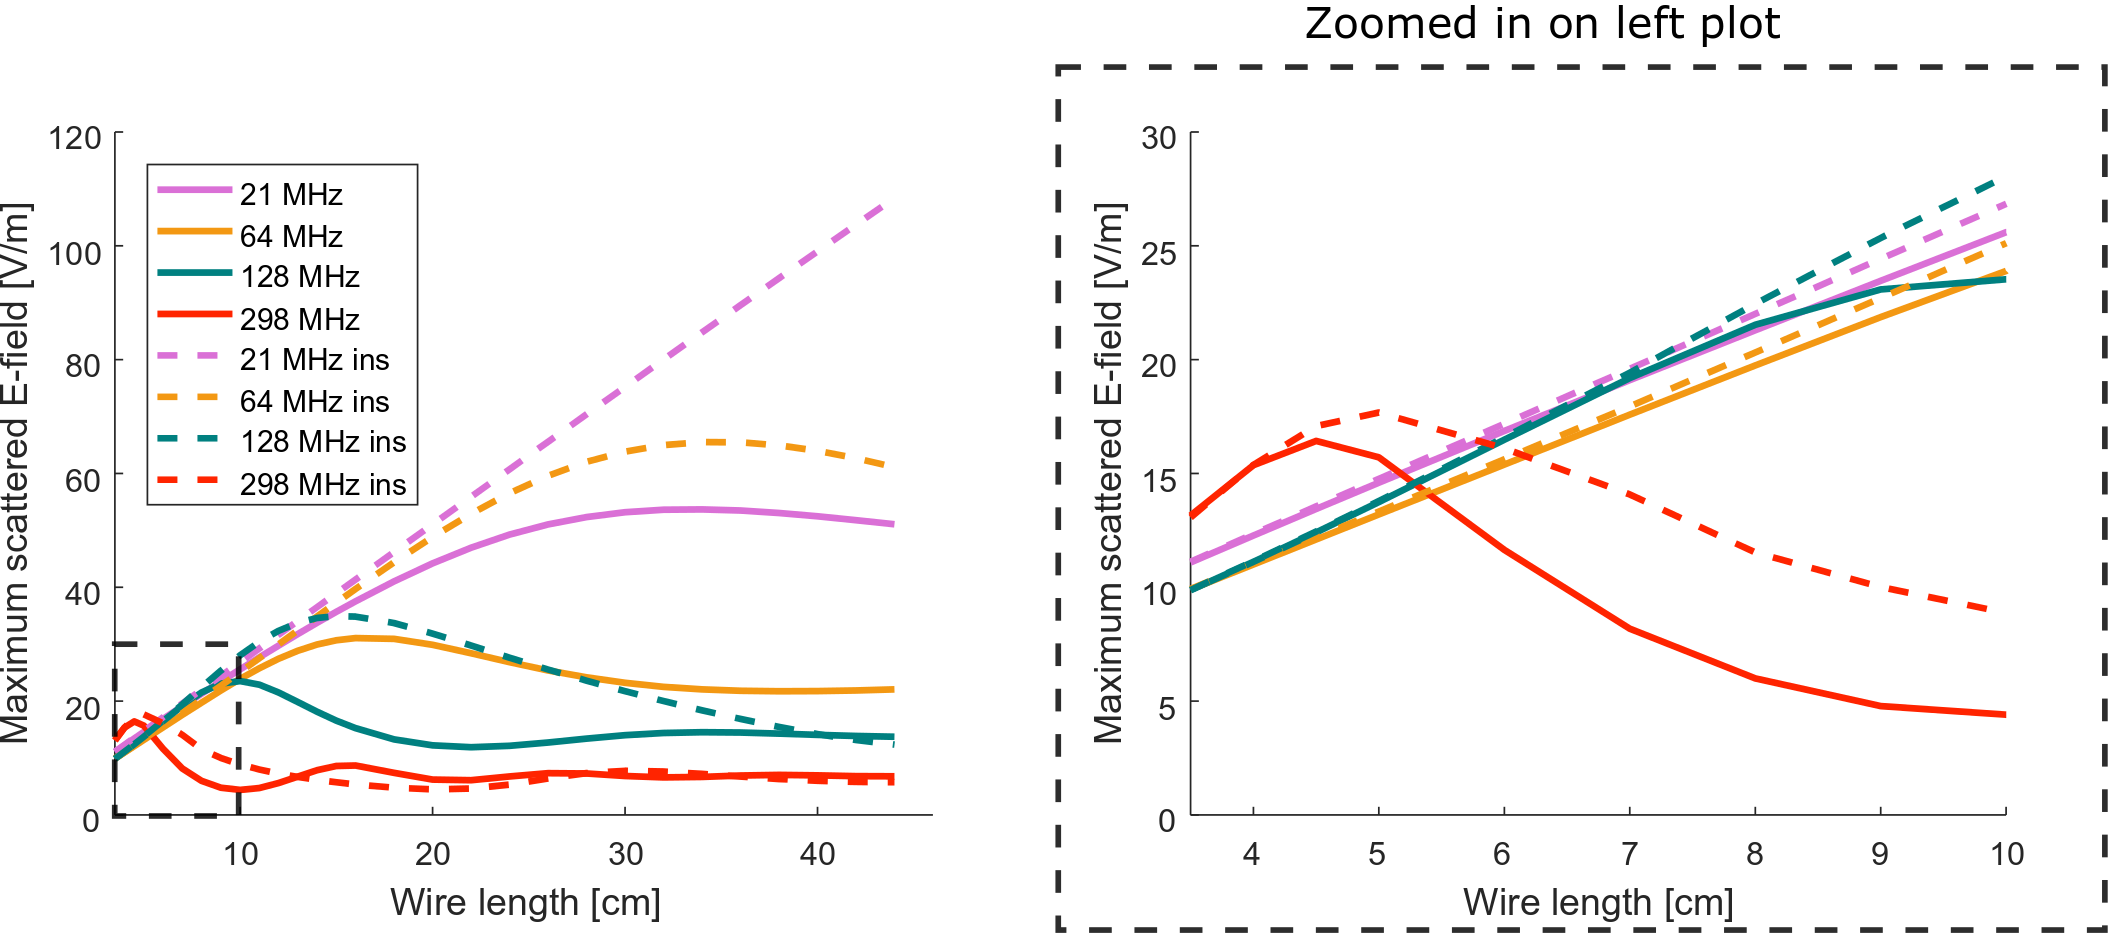
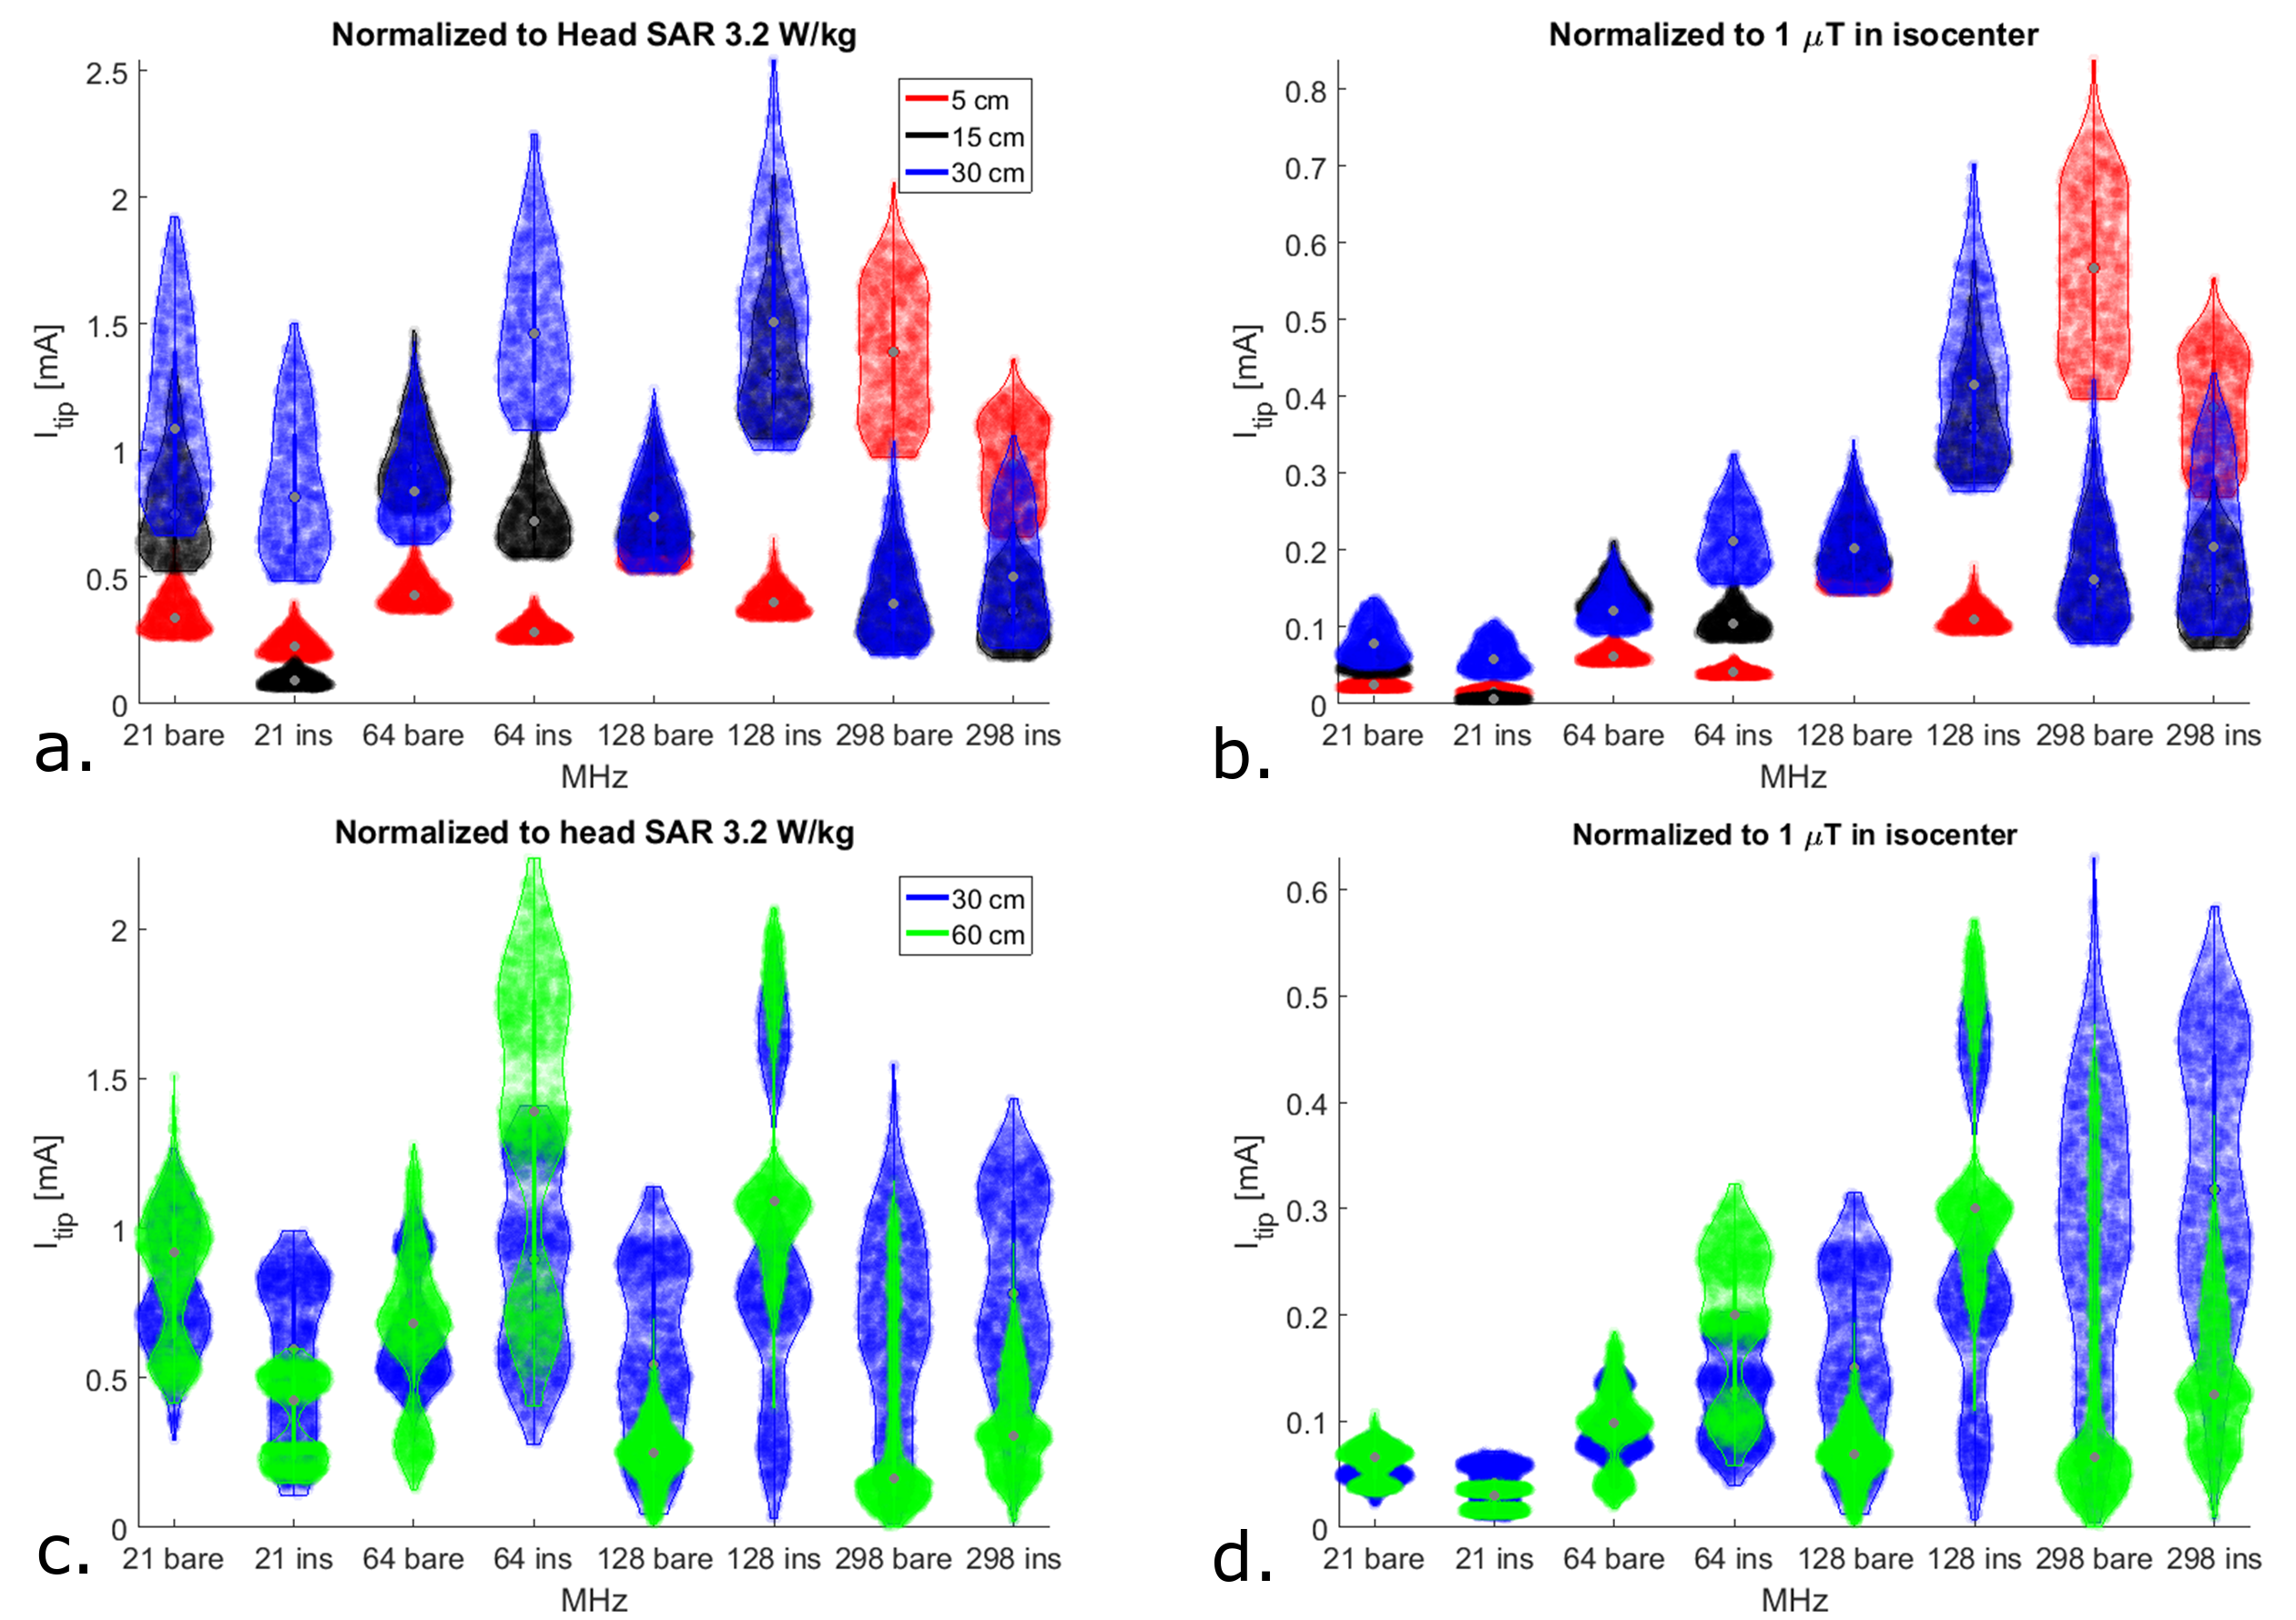
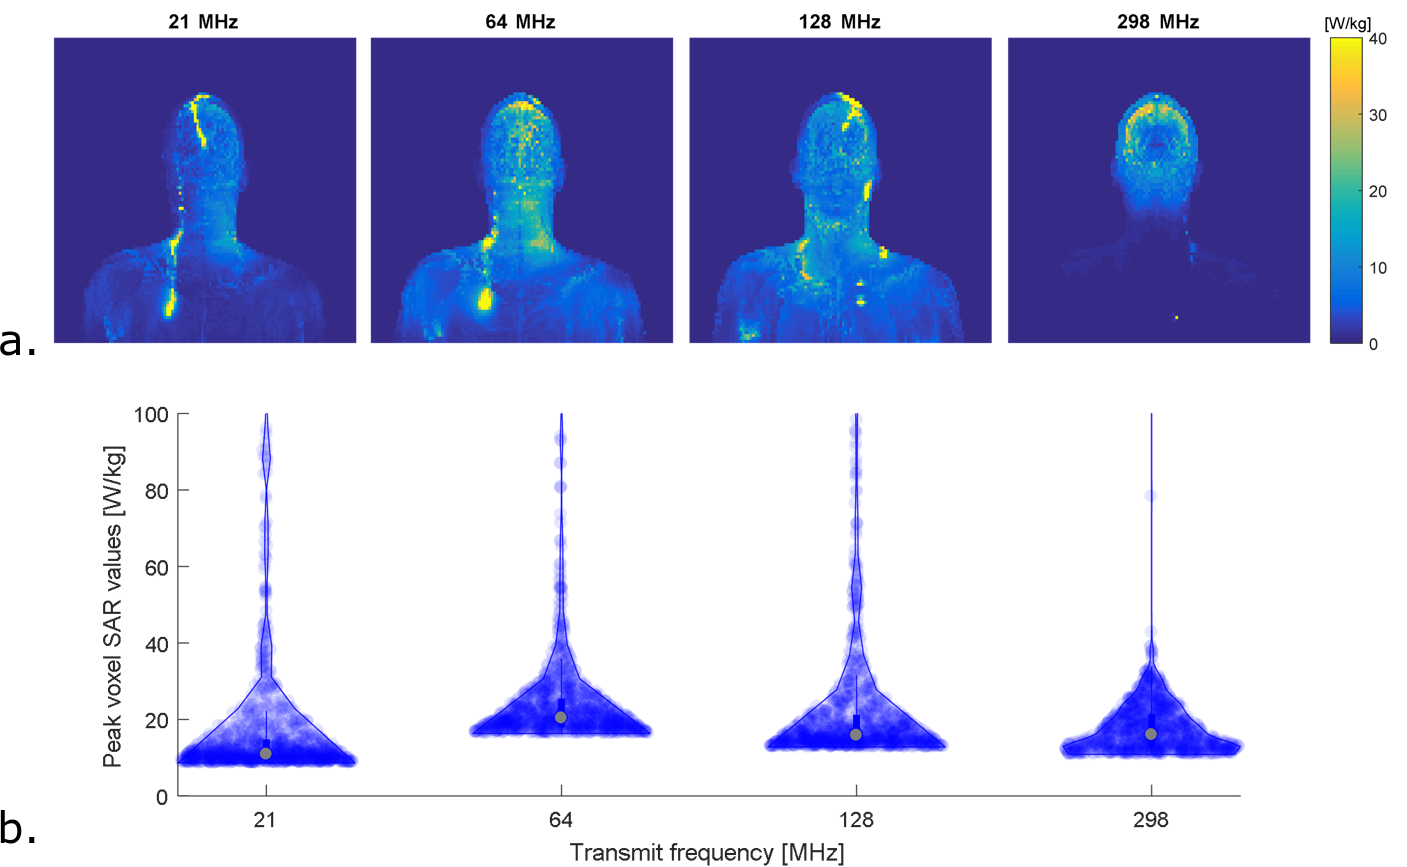
Results of uniform electric field exposure inside a phantom are shown in figure 3. These results indicate that maximum heating occurs for wire lengths where resonance takes place, which is shorter for larger frequencies. Under these circumstances, the field enhancement at resonance actually increases with decreasing transmit frequency. However, results for human model simulations show a different picture (figure 4). Here the distribution of tip currents over the investigated wire positions is illustrated by violin plots. When normalizing to B1+, induced current generally goes up with transmit frequency, especially for shorter straight wires (5-15 cm). When normalizing to head SAR, no obvious trend is visible in the results. The tip current for the worst case wire length of that frequency is roughly equal between field strengths, albeit that this worst case length is shorter for larger field strengths. To verify these results based on transfer functions and tip currents, figure 5 shows the actual SAR distributions and peak SAR values for the 60cm implants that were expected to cause the highest induced tip current. These results confirm that the highest SAR occurs at 64 MHz when normalizing to head SAR, as expected from the transfer function calculations.Discussion
Phantom results indicate that the magnitude of the scattered E-fields around an implant at resonance length is larger for low transmit frequencies. We hypothesize this is because lower frequencues provide less loading and resonance at a larger length provides more length to collect energy, results in higher voltage over the wire. However, incident E-field distributions are strongly dependent on the transmit frequency and the RF coil. For brain imaging in commonly used RF coils with implants, when normalizing to B1+, RF heating may in general increase with transmit frequency. However, when operating at the head SAR limit, RF heating is similar if the implant approaches its resonance length.Conclusion
For uniform incident E-field exposure, expected RF heating for implants at worst-case length decreases with increasing transmit frequency. For realistic E-field exposures, the risk of RF heating increases with transmit frequency for similar B1+ in the brain. For similar head SAR, RF heating at worst-case implant length is roughly equal at each field strength.Acknowledgements
No acknowledgement found.References
1. Hoff MN, McKinney A, Shellock FG, et al. Safety considerations of 7-T MRI in clinical practice. Radiology. 2019. doi:10.1148/radiol.2019182742
2. Shellock FG. MRI Safety - The LIST. http://www.mrisafety.com/List.html. Published 2019.
3. Campbell-Washburn AE, Ramasawmy R, Restivo MC, et al. Opportunities in interventional and diagnostic imaging by using high-performance low-field-strength MRI. Radiology. 2019. doi:10.1148/radiol.2019190452
4. Luechinger R, Zeijlemaker VA, Pedersen EM, et al. In vivo heating of pacemaker leads during magnetic resonance imaging. Eur Heart J. 2005. doi:10.1093/eurheartj/ehi009
5. Nordbeck P, Fidler F, Weiss I, et al. Spatial distribution of RF-induced E-fields and implant heating in MRI. Magn Reson Med. 2008. doi:10.1002/mrm.21475
6. Henderson JM, Thach J, Phillips M, Baker K, Shellock FG, Rezai AR. Permanent neurological deficit related to magnetic resonance imaging in a patient with implanted deep brain stimulation electrodes for Parkinson’s disease: Case report. Neurosurgery. 2005. doi:10.1227/01.NEU.0000180810.16964.3E
7. Tokaya J. MRI safety of implants: transfer function determination from MR images. 2020.
8. Winter L, Seifert F, Zilberti L, Murbach M, Ittermann B. MRI-Related Heating of Implants and Devices: A Review. J Magn Reson Imaging. 2020. doi:10.1002/jmri.27194
9. Christ A, Kainz W, Hahn EG, et al. The Virtual Family - Development of surface-based anatomical models of two adults and two children for dosimetric simulations. Phys Med Biol. 2010. doi:10.1088/0031-9155/55/2/N01
10. Tokaya JP, Raaijmakers AJE, Luijten PR, Bakker JF, van den Berg CAT. MRI-based transfer function determination for the assessment of implant safety. Magn Reson Med. 2017. doi:10.1002/mrm.26613
11. Tokaya JP, Raaijmakers AJE, Luijten PR, Sbrizzi A, van den Berg CAT. MRI-based transfer function determination through the transfer matrix by jointly fitting the incident and scattered B1+ field. Magn Reson Med. 2020. doi:10.1002/mrm.27974
12. Park J. Transfer function methods to measure dynamic mechanical properties of complex structures. J Sound Vib. 2005. doi:10.1016/j.jsv.2004.12.019
13. Erturk MA, Panken E, Conroy MJ, et al. Predicting in vivo MRI Gradient-Field Induced Voltage Levels on Implanted Deep Brain Stimulation Systems Using Neural Networks. Front Hum Neurosci. 2020. doi:10.3389/fnhum.2020.00034
Figures