0354
Using Free-Breathing MRI to Characterize Heterogeneity of Pancreatic Fat in Children with Nonalcoholic Fatty Liver Disease1David Geffen School of Medicine at UCLA, Los Angeles, CA, United States, 2Department of Bioengineering, University of California Los Angeles, Los Angeles, CA, United States, 3Department of Radiological Sciences, University of California Los Angeles, Los Angeles, CA, United States, 4Department of Pediatrics, University of California Los Angeles, Los Angeles, CA, United States
Synopsis
Metabolic dysfunction in children is a major health issue. Pancreatic fat is a potential biomarker of metabolic dysfunction, but methodological difficulties have limited research on its role in at-risk children. This work used free-breathing abdominal MRI to quantify pancreatic fat and to characterize its heterogeneity in children with and without nonalcoholic fatty liver disease (NAFLD). Children with NAFLD had increased pancreatic fat that was heterogeneously distributed and predominantly located in the superior region. A simple region-of-interest-based measurement method failed to account for this heterogeneity, and thus underestimated pancreatic fat. Full segmentation pancreatic fat measurements correlated with markers of metabolic dysfunction.
Introduction
Pediatric obesity and metabolic dysfunction are urgent global health issues1. Pancreatic fat is a potential biomarker for identifying and understanding metabolic dysfunction in children2-5. MRI is the reference standard for non-invasive quantification of pancreatic fat content based on the proton-density fat fraction (PDFF)6. While pancreatic PDFF (pPDFF) has been correlated to markers of metabolic dysfunction in both adults and children, its role in the etiology of dysmetabolism remains unclear2-5,7-11. Investigations of pediatric pPDFF are limited by difficulties with both data acquisition and analysis.The measurement of MRI PDFF in the abdomen typically requires breath-holding, but this is challenging for children. A new free-breathing radial MRI method12 has been developed and demonstrated accurate quantification of liver PDFF in children with respect to standard breath-holding MRI13, though further work is required to investigate this method for quantifying pPDFF. Regarding data analysis, research on adults has shown that full segmentation (FS) of the pancreas is the most reliable method for pPDFF quantification7, but this is time-consuming and difficult. Most studies have thus used a simplified method based on 3 regions of interest (ROI)4-11, but this method fails to account for the spatial heterogeneity of pancreatic fat, which has been poorly studied.
In this work, we use a free-breathing radial abdominal MRI technique for FS and 3-ROI pPDFF mapping in children to investigate the heterogeneity of pPDFF and its relationship with markers of metabolic dysfunction.
Methods
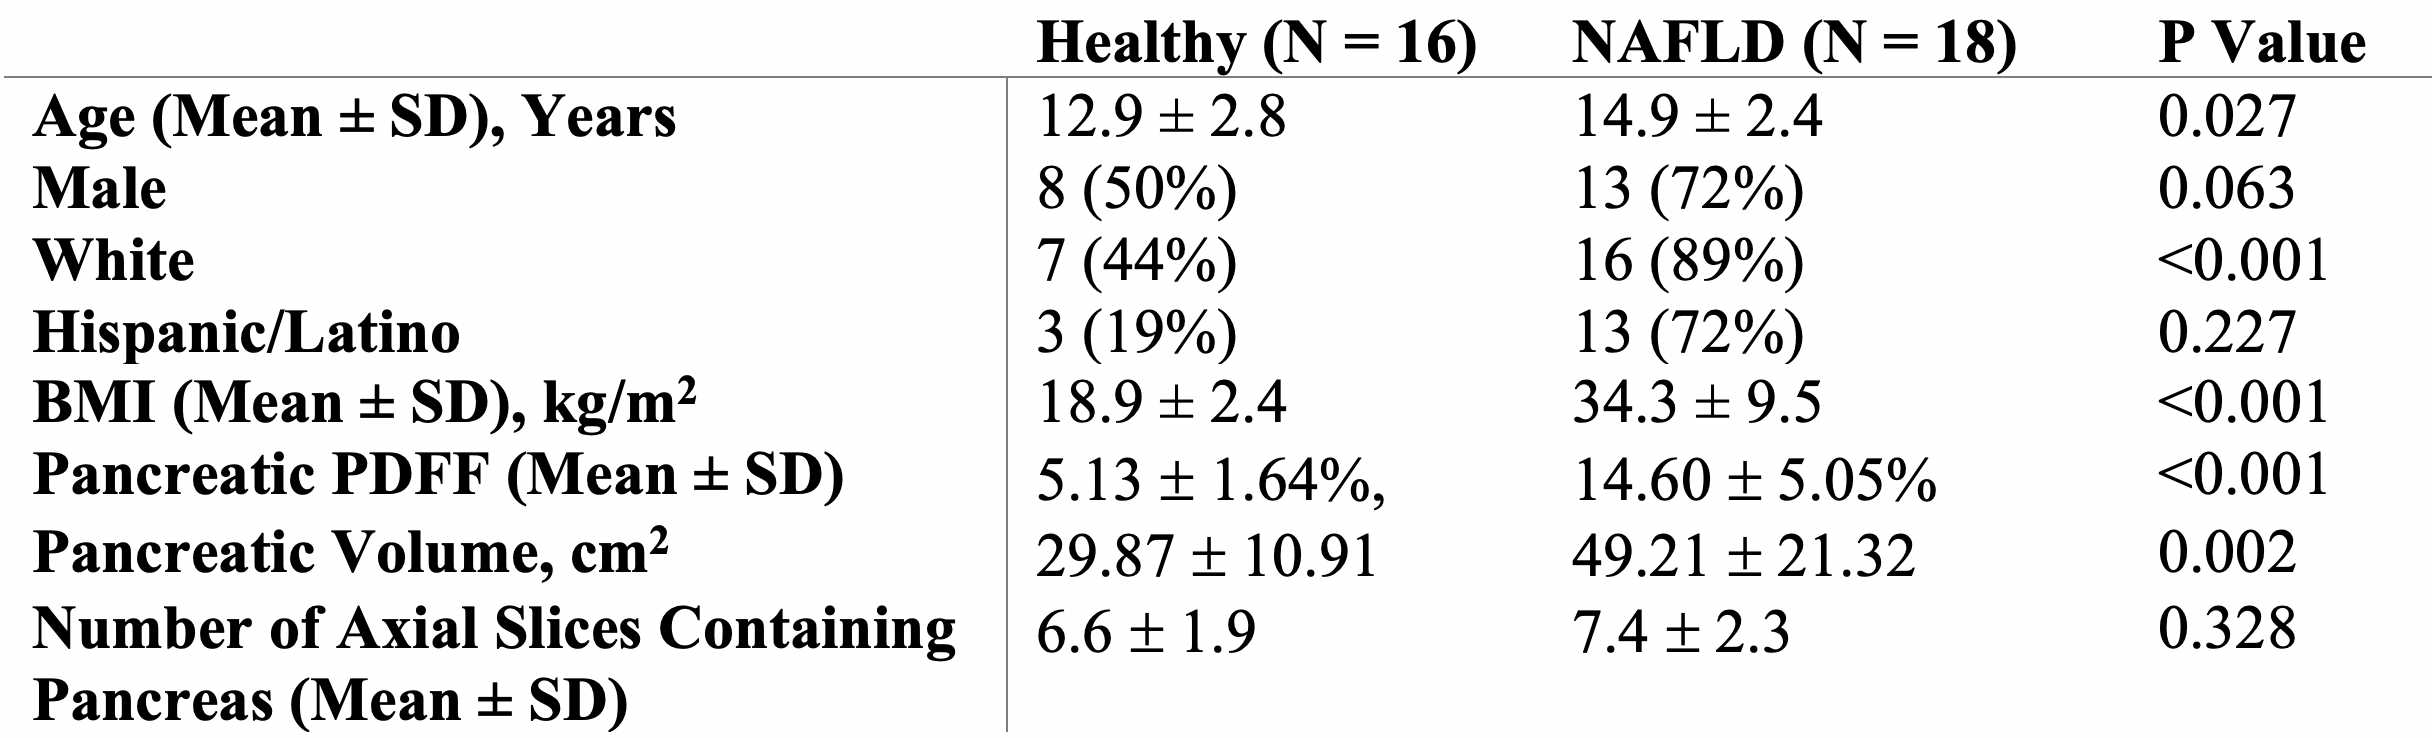
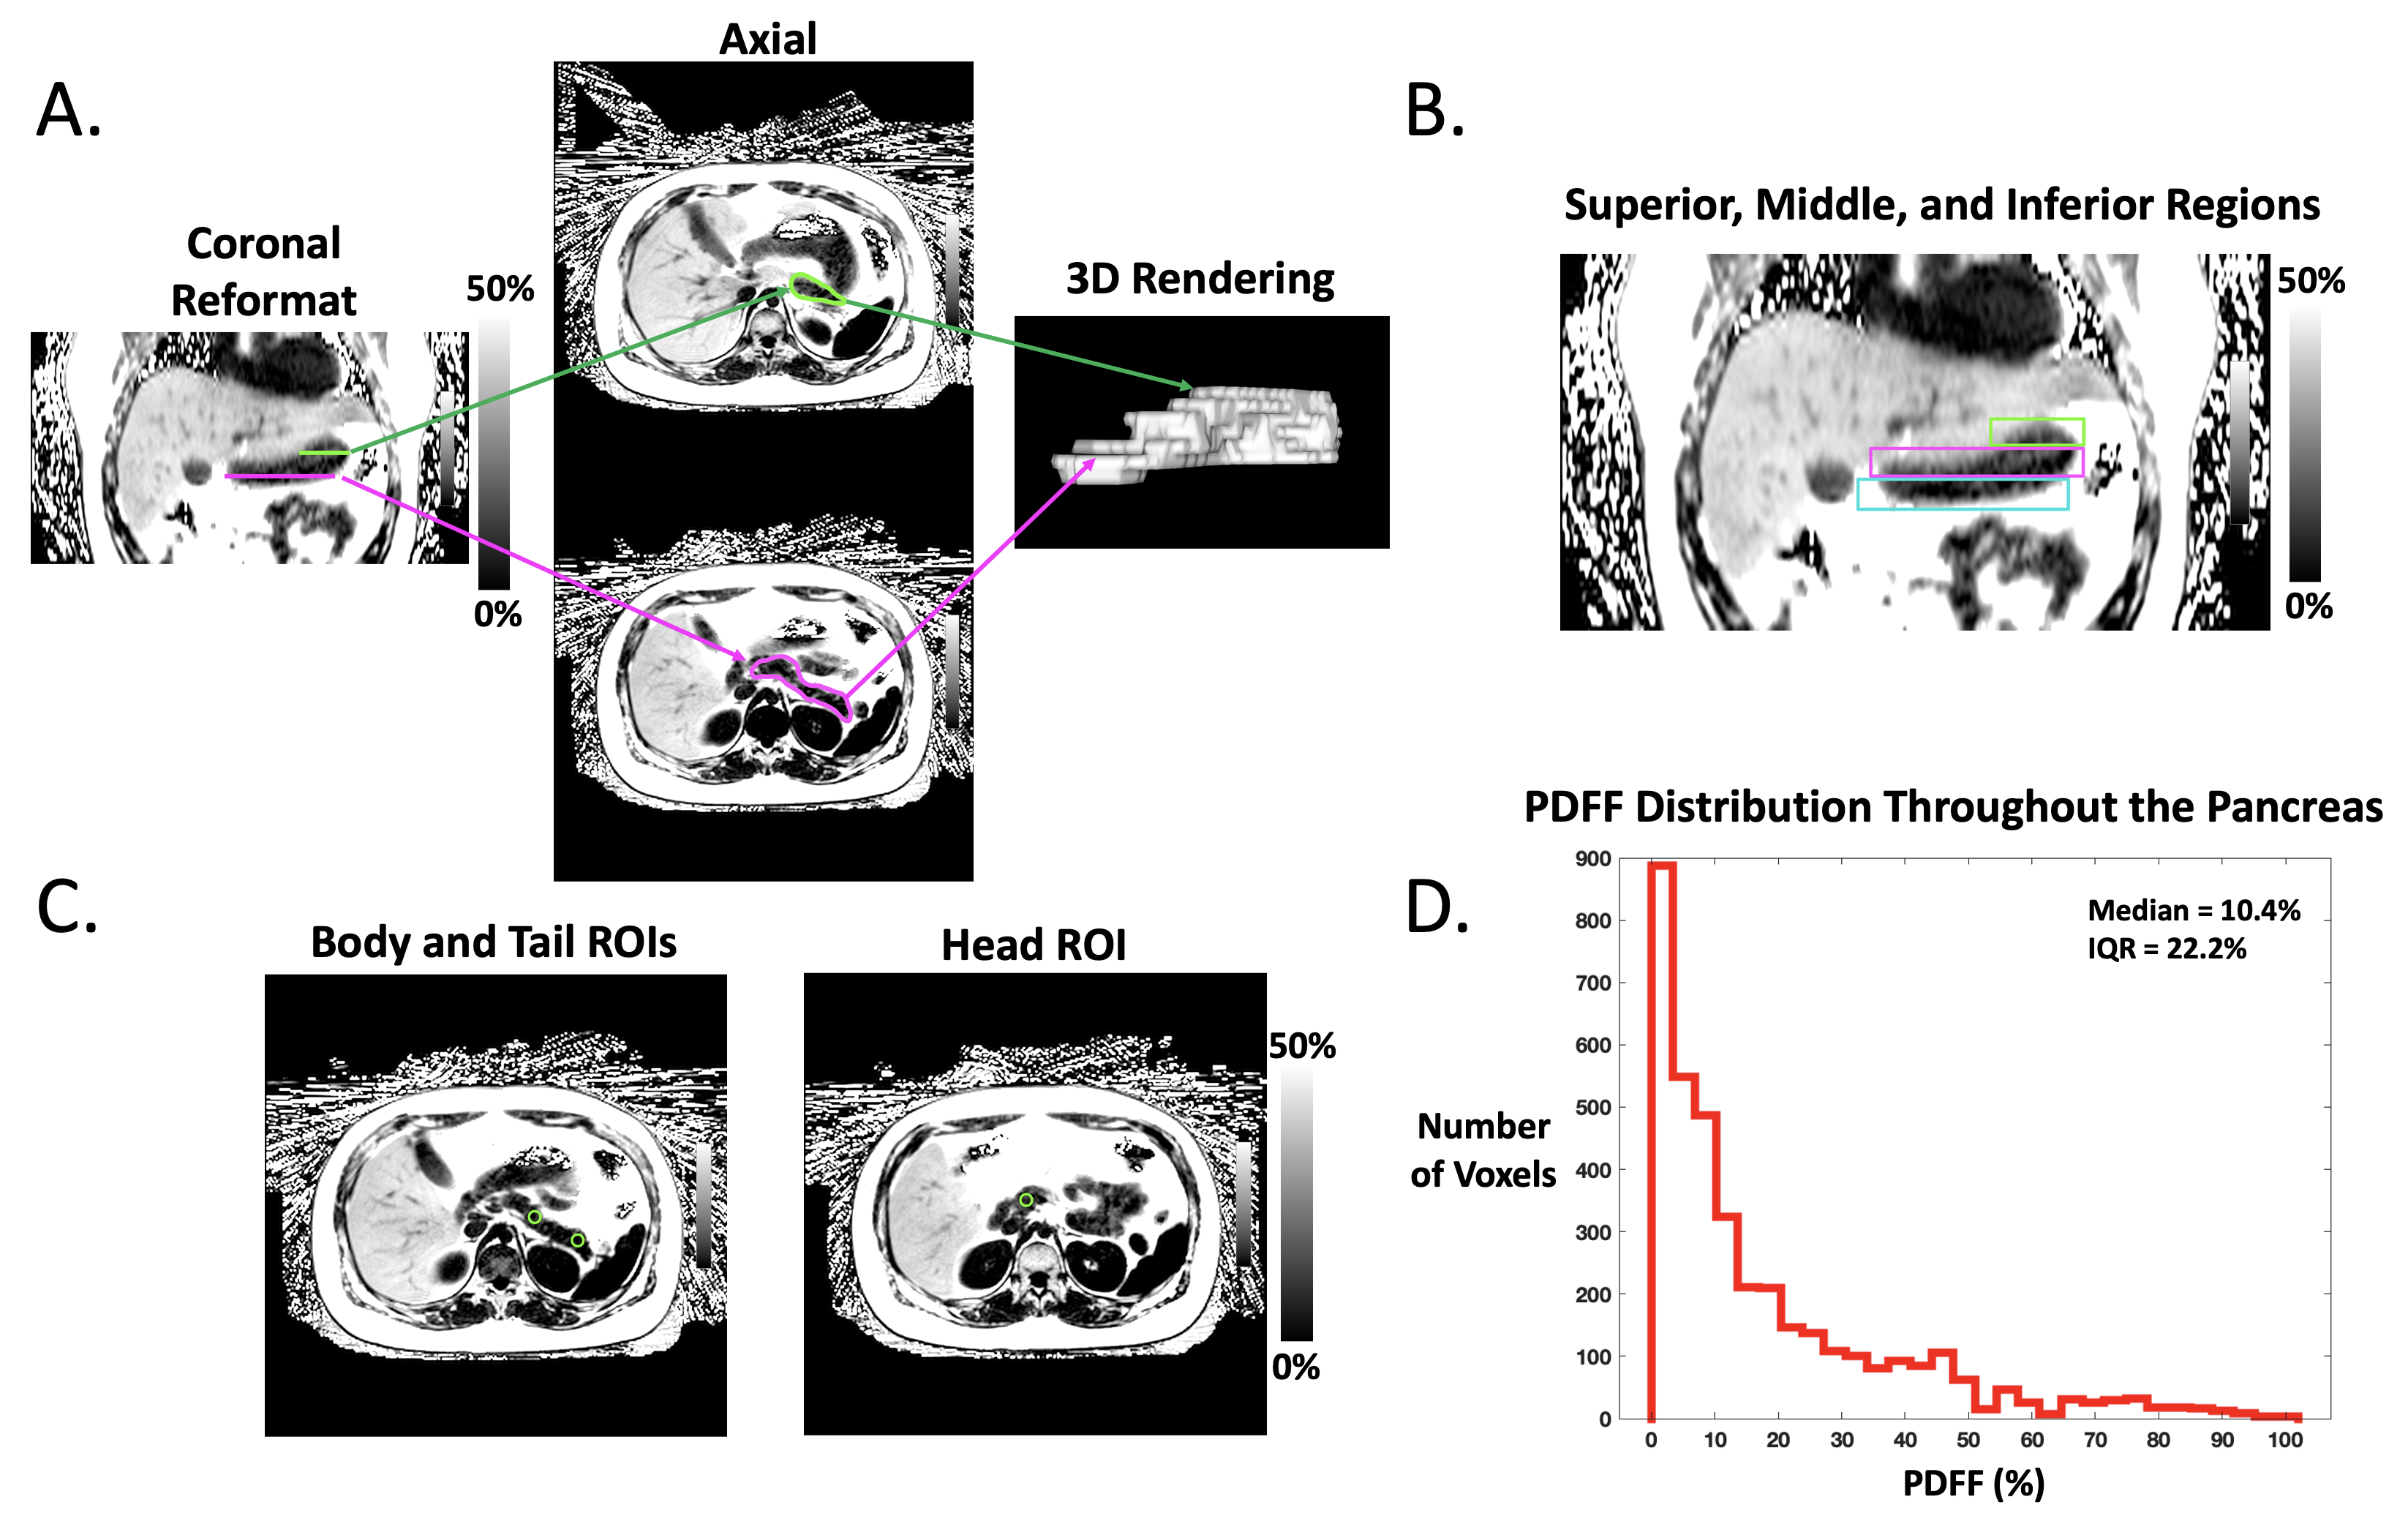
In this IRB-approved prospective study, we enrolled 18 children with nonalcoholic fatty liver disease (NAFLD) and 16 healthy children. All subjects underwent axial free-breathing 3D stack-of-radial abdominal MRI at 3 T (MAGNETOM Skyra or Prisma, Siemens)12, with: TEs (ms)=1.23, 2.46, 3.69, 4.92, 6.15, 7.38; TR=8.85ms; Matrix size [Nx, Ny]= 160-288x160-288; Field-of-View [mmx, mmy]= 280-500, 280-500; Resolution [mmx, mmy]= 1.7-1.9x1.7-1.9; Number of slices= 36-52; Slice thickness= 5mm; Scan time [mins:secs]= 2:09-4:43.A pediatric radiologist with >10 years of experience performed FS of the pancreas by using a free-hand ROI tool (Horos software) on PDFF maps with randomized and blinded presentation of cases. In a separate session, this reader placed 1-cm2 oval ROIs in the pancreatic head, body, and tail of each subject according to the 3-ROI method. The superior, middle, and inferior slices (i.e., divided into thirds) from FS were retrospectively analyzed to quantify variations in pPDFF along the superior/inferior (S/I) axis (Figure 1, Figure 2).
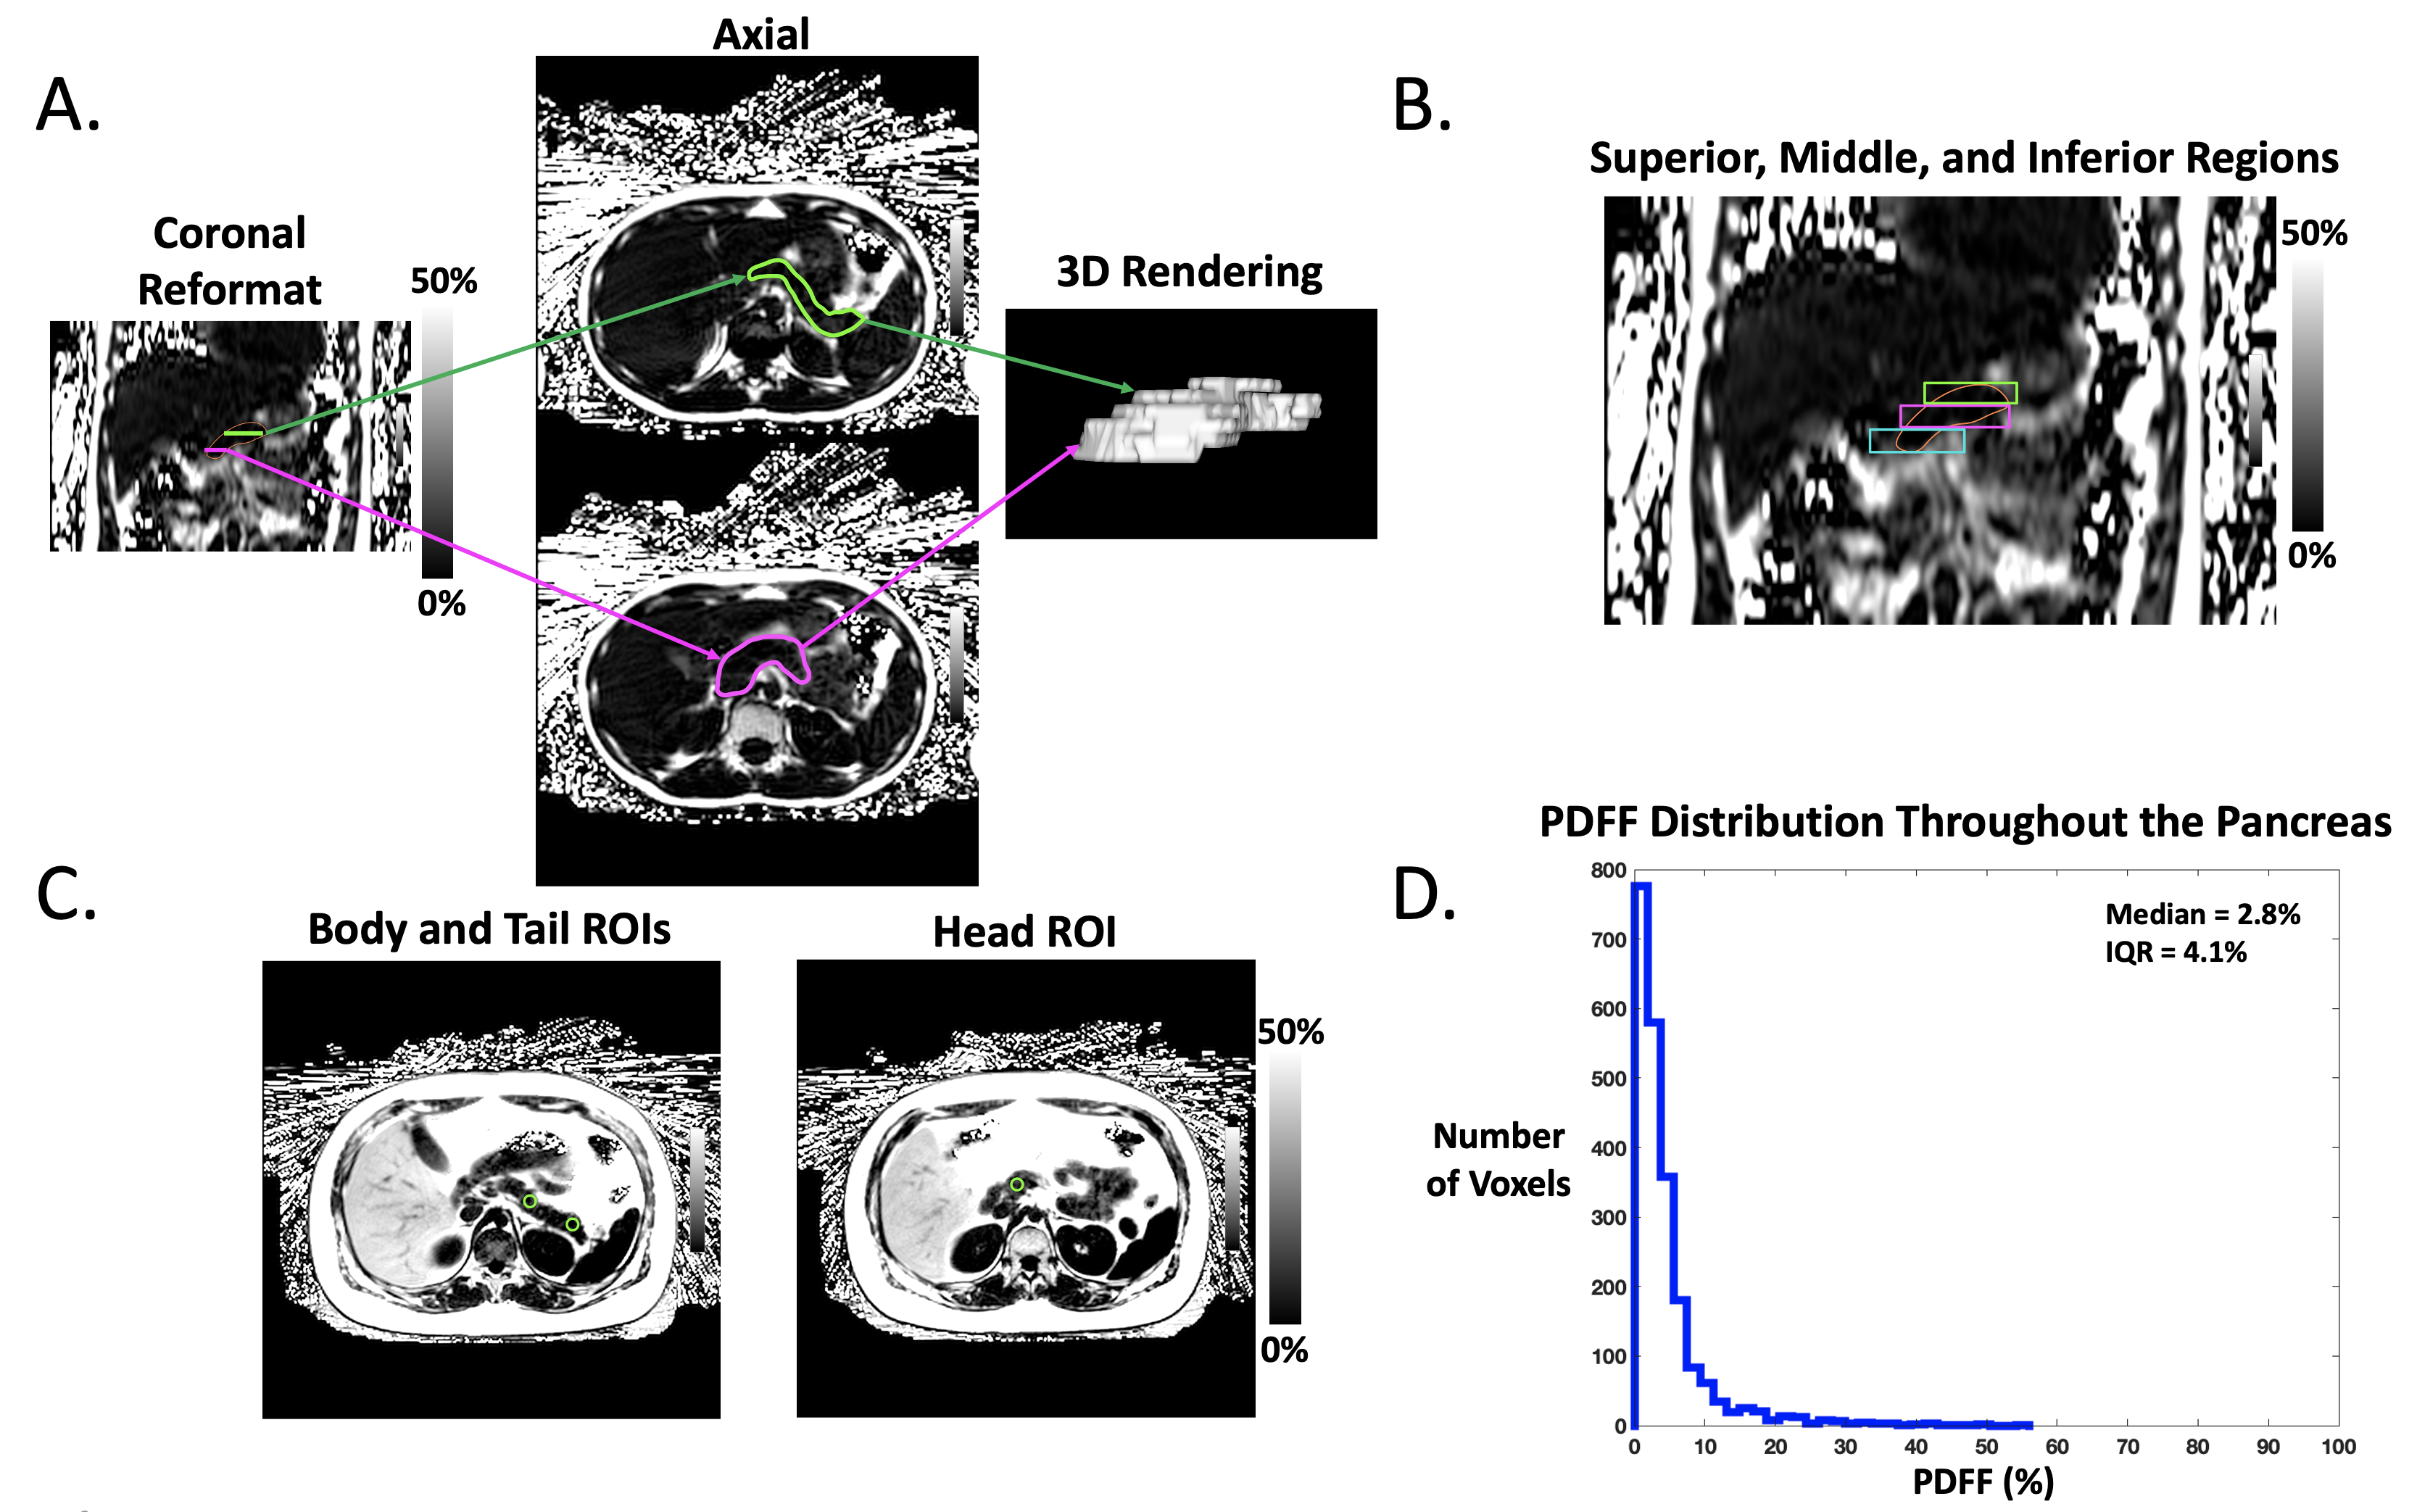
To assess heterogeneity of pancreatic fat, histograms of the pPDFF value from all voxels within FS tracings were calculated using MATLAB (MathWorks Inc.), and differences in the interquartile ranges (IQR) between healthy and NAFLD subjects were visualized with box-and-whisker plots and compared with the Mann-Whitney U test. Pancreatic PDFF from FS, 3-ROI, and each S/I level (superior, middle, inferior) were compared within healthy and NAFLD subjects using box plots and 1-way repeated measures ANOVA with post-hoc analysis. Differences in FS pPDFF based on NAFLD status or the presence of acanthosis nigricans were assessed with the independent-samples t-test or the Mann-Whitney U test. Relationships between FS pPDFF and both BMI and liver PDFF were evaluated with Spearman’s rank order sum. P<0.05 was considered significant.
Results
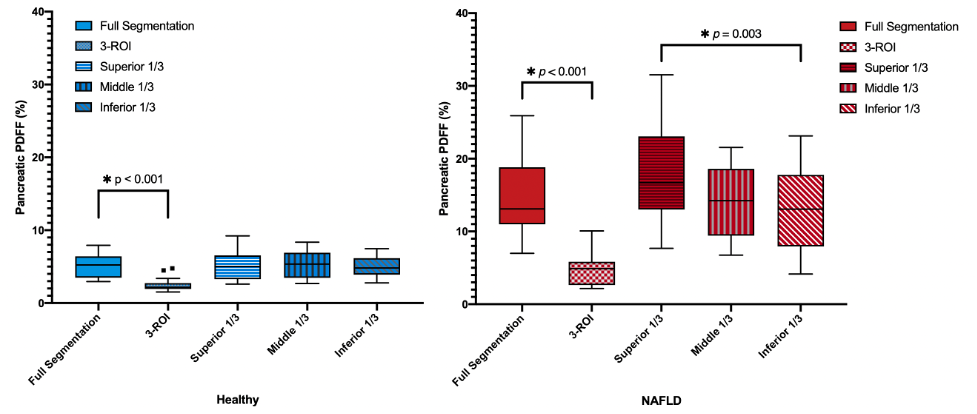
Demographics and pPDFF based on NAFLD status are summarized in Table 1. Mean IQR of FS pPDFF was higher in children with NAFLD than healthy subjects (p < 0.001) (Figure 3). FS pPDFF was higher than 3-ROI pPDFF in both NAFLD (14.60 ± 5.05% vs 4.52 ± 2.13%, p < 0.001) and healthy subjects (5.12 ± 1.64% vs 2.50 ± 0.95%, p < 0.001) (Figure 4). Differences in pPDFF along the S/I axis were not significant in healthy children. In NAFLD subjects, superior pPDFF (17.96 ± 6.58%) was greater than inferior pPDFF (13.23 ± 5.44%, p = 0.003).Mean FS pPDFF was higher in NAFLD (14.60 ± 5.05%) than healthy subjects (5.13 ± 1.64%, p < 0.001). Children with acanthosis nigricans, regardless of NAFLD status, had a higher pPDFF than healthy children (15.93 ± 5.05% vs 8.06 ± 5.26%, p = 0.001). FS pPDFF had strong positive correlations with BMI (r = 0.757, p < 0.001) and liver PDFF (r = 0.736, p < 0.001).
Discussion
Free-breathing MRI was successfully used to map pPDFF in all children. The increased range of pPDFF values seen in children with NAFLD versus healthy children suggests that local regions of high fat content influence overall pPDFF. These regions were predominantly in the superior levels of the pancreas, which might be due to variations in vascular supply within the organ. If these high-fat regions drive the relationship between pPDFF and metabolic markers, the fat distribution heterogeneity itself may be a useful biomarker. The 3-ROI method fails to adequately capture this spatial heterogeneity, which may reduce its reliability when investigating associations with clinical outcomes. FS pPDFF was related to BMI, liver PDFF, and acanthosis nigricans, though further research is needed to investigate direction of causality.Conclusion
Using free-breathing MRI, this study found that children with NAFLD have a heterogenous distribution of pancreatic fat that is predominantly localized to the superior region. Overall pancreatic fat was associated with markers of metabolic dysfunction. These findings lay the foundation for investigating the role of pancreatic PDFF in pediatric metabolic dysfunction.Acknowledgements
This project was supported by the UCLA Radiological Sciences Exploratory Research Program and the National Institute of Diabetes and Digestive and Kidney Diseases (R01DK124417).References
1. Kumar S, Kelly AS. Review of Childhood Obesity: From Epidemiology, Etiology, and Comorbidities to Clinical Assessment and Treatment. Mayo Clin Proc. 2017 Feb;92(2):251-265. doi: 10.1016/j.mayocp.2016.09.017. Epub 2017 Jan 5. PMID: 28065514.
2. Claudia M. Toledo-Corral, Tanya L. Alderete, Houchun H. Hu, Krishna Nayak, Sherryl Esplana, Ting Liu, Michael I. Goran, Marc J. Weigensberg, Ectopic Fat Deposition in Prediabetic Overweight and Obese Minority Adolescents, The Journal of Clinical Endocrinology & Metabolism, Volume 98, Issue 3, 1 March 2013, Pages 1115–1121, https://doi.org/10.1210/jc.2012-3806.
3. Trout, A.T., Hunte, D.E., Mouzaki, M. et al. Relationship between abdominal fat stores and liver fat, pancreatic fat, and metabolic comorbidities in a pediatric population with non-alcoholic fatty liver disease. Abdom Radiol 44, 3107–3114 (2019). https://doi.org/10.1007/s00261-019-02123-y.
4. Idilman, I.S., Tuzun, A., Savas, B. et al. Quantification of liver, pancreas, kidney, and vertebral body MRI-PDFF in non-alcoholic fatty liver disease. Abdom Imaging 40, 1512–1519 (2015). https://doi.org/10.1007/s00261-015-0385-0.
5. Pacifico L, Di Martino M, Anania C, Andreoli GM, Bezzi M, Catalano C, Chiesa C. Pancreatic fat and β-cell function in overweight/obese children with nonalcoholic fatty liver disease. World J Gastroenterol. 2015 Apr 21;21(15):4688-95. doi: 10.3748/wjg.v21.i15.4688. PMID: 25914480; PMCID: PMC4402318.
6. Chen Y, Long L, Jiang Z, Zhang L, Zhong D, Huang X. Quantification of pancreatic proton density fat fraction in diabetic pigs using MR imaging and IDEAL-IQ sequence. BMC Med Imaging. 2019;19(1):38. Published 2019 May 14. doi:10.1186/s12880-019-0336-2.
7. Kato S, Iwasaki A, Kurita Y, et al. Three-dimensional analysis of pancreatic fat by fat-water magnetic resonance imaging provides detailed characterization of pancreatic steatosis with improved reproducibility. PLoS One. 2019;14(12):e0224921. doi:10.1371/journal.pone.0224921.
8. Heber SD, Hetterich H, Lorbeer R, et al. Pancreatic fat content by magnetic resonance imaging in subjects with prediabetes, diabetes, and controls from a general population without cardiovascular disease. PLoS One. 2017;12(5):e0177154. Published 2017 May 17. doi:10.1371/journal.pone.0177154.
9. Kühn JP, Berthold F, Mayerle J, et al. Pancreatic Steatosis Demonstrated at MR Imaging in the General Population: Clinical Relevance. Radiology. 2015;276(1):129-136. doi:10.1148/radiol.15140446.
10. Patel NS, Peterson MR, Lin GY, et al. Insulin Resistance Increases MRI-Estimated Pancreatic Fat in Nonalcoholic Fatty Liver Disease and Normal Controls. Gastroenterol Res Pract. 2013;2013:498296. doi:10.1155/2013/498296.
11. Patel NS, Peterson MR, Brenner DA, Heba E, Sirlin C, Loomba R. Association between novel MRI-estimated pancreatic fat and liver histology-determined steatosis and fibrosis in non-alcoholic fatty liver disease. Aliment Pharmacol Ther. 2013;37(6):630-639. doi:10.1111/apt.12237.
12. Armstrong T, Ly KV, Murthy S, Ghahremani S, Kim GHJ, Calkins KL, Wu HH. Free breathing quantification of hepatic fat in healthy children and children with nonalcoholic fatty liver disease using a multi-echo 3-D stack-of-radial MRI technique. Pediatr Radiol. 2018;48:941-953. doi:10.1007/s00247-018-4127-7.
13. Zhong X, Nickel MD, Kannengiesser SA, Dale BM, Kiefer B, Bashir MR. Liver fat quantification using a multi-step adaptive fitting approach with multi-echo GRE imaging. Magn Reson Med. 2014 Nov;72(5):1353-65. doi: 10.1002/mrm.25054. Epub 2013 Dec 9. PMID: 24323332.
Figures