0352
Liver Stiffness in a Single Breath-hold Using Wave Polarity-Inversion Motion Encoding and Compressed SENSE: Coverage Equivalent to 5 Slices
Amol Pednekar1, Deep B. Gandhi2, Hui Wang3, Jean A. Tkach1, Andrew T. Trout1, and Jonathan R. Dillman1
1Department of Radiology, Cincinnati Children's Hospital Medical Center, Cincinnati, OH, United States, 2Imaging Research Center, Department of Radiology, Cincinnati Children's Hospital Medical Center, Cincinnati, OH, United States, 3MR Clinical Science, Philips, Cincinnati, OH, United States
1Department of Radiology, Cincinnati Children's Hospital Medical Center, Cincinnati, OH, United States, 2Imaging Research Center, Department of Radiology, Cincinnati Children's Hospital Medical Center, Cincinnati, OH, United States, 3MR Clinical Science, Philips, Cincinnati, OH, United States
Synopsis
2D GRE MRE liver images acquired at 4 transverse levels in breath-hold times >13s per slice is currently standard of care (SC_2D_4BH). The combination of wave polarity-inversion motion encoding and compressed-SENSE enables volumetric three-dimensional (3D) MRE data acquisition in a single breath-hold of <16 s, with identical spatial resolution and 5 slice equivalent coverage (3D_5Sl_SBH). In 19 participants, mean liver shear stiffness values estimated with SC_2D_4BH and 3D_5sl_SBH correlated very strongly (ICC=0.96) with a mean bias of 0.13 kPa (<5 %). 3D_5sl_SBH MRE provides similar stiffness estimates as SC_2D_4BH with increased coverage in a single breath-hold compared to 4 breath-holds.
Indtroduction
Magnetic resonance elastography of the liver (MREL) aids in the non-invasive diagnosis and staging of liver fibrosis [1]. Two-dimensional (2D) gradient-recalled-echo (GRE) MRE employing: 1) a mechanical driver frequency of 60 Hz, 2) motion encoding gradients (MEG) applied along a single direction, and 3) inflow saturation, acquired during a breath-hold (BH) per slice, is currently the standard of care (SC) sequence [2]. Four transverse MREL images through mid-liver are typically acquired in 4 consecutive breath-holds of ~14 – 18sec (SC_2D_4BH) [3]. The combination of wave polarity-inversion motion encoding (by setting the repetition time to 1.5 times the period of applied mechanical wave to encode motion) and data undersampling by compressed-SENSE enables volumetric three-dimensional (3D) MREL data acquisition in a single breath-hold of <16 s, with identical spatial resolution and coverage equivalent to 5 2D slices (3D_5Sl_SBH) [4]. The purpose of this study is to compare liver stiffness measurements obtained using SC_2D_4BH technique to those obtained by the 3D_5Sl_SBH.Methods
In this prospective HIPAA compliant IRB approved study, 19 participants (age 36.9±12.6 years, range 20-62 years, 8 males) underwent MREL with written informed consent. All imaging was performed on a Philips Ingenia 1.5T scanner (Best, The Netherlands), using a 28-channel torso coil. MREL images were obtained using both the commercially available SC_2D_4BH MRE sequence (Fig. 1 A) and 3D_5Sl_SBH (Fig. 1 B) MREL sequence. The cephalad 4 slices of the 3D_5sl_SBH acquisition were prescribed at the same location as the SC_2D_4BH. Commercially available SENSE (based on regular undersampling and coil sensitivity information, and spatial solution space constraint based on prior knowledge of the image extent) and C-SENSE (combines spatial domain variable-density pseudorandom undersampling of k-space with the SENSE reconstruction algorithm using iterative reconstruction and sparsity constraints) were employed [5]. All image reconstructions and stiffness map (with 95% confidence interval mask overlays) computations were performed inline in using a multimodal direct inversion algorithm [6] available on the scanner. All the MREL data, including magnitude, phase, and wave images as well as shear stiffness maps, were exported to a post-processing workstation (with IntelliSpace Portal v10.1; ISP, Philips). Manual liver shear stiffness measurements were made by a single trained image analyst (>1-year experience), under the supervision of a board-certified Pediatric Radiologist (>10-years post-fellowship experience). On four matching slices from each acquisition, a single freehand region of interest (ROI) was drawn to encompass as much of the right hepatic lobe as possible while remaining within the boundaries of the 95% confidence mask and avoiding the liver capsule, large blood vessels, dilated bile ducts, and areas of artifact, including hot-spots immediately under the passive driver and respiratory motion in cases of failed breath holds (Fig. 2). Additionally, to compare the shear stiffness values in the same tissue across the techniques, identically sized and positioned ROIs were drawn on both sets of shear stiffness maps. Overall participant-specific liver shear stiffness was calculated as the ROI area weighted mean liver shear stiffness of the estimates extracted from each slice. Two-sided paired t test, intra-class correlation coefficient (ICC), and Bland-Altman analysis were used to compare and assess agreement in the ROI sizes and shear stiffness estimates between the sequences.Results
MREL image acquisition and reconstruction was performed successfully in all participants. Breath-hold times were 13.3 ± 0.2 s per slice with SC_2D_4BH MRE and 15.6 ± 0.2 s with 3D_5sl_SBH. Descriptive and comparative statistics for the liver stiffness values and area within 95% confidence mask are presented in Tables (1-2) and Fig. 3. Stiffness estimates based on matched ROIs for the SC_2D_4BH (2.17 ± 0.68 kPa, range 1.60 – 4.53 kPa) and 3D_5sl_SBH (2.08 ± 0.60 kPa, range 1.48 – 4.20 kPa), MREL sequences correlated very strongly (ICC=0.96). There was slight underestimation of stiffness using 3D_5sl_SBH with bias of 0.09kPa (3.21%, p=0.041). Mean liver stiffness values based in the largest possible ROIs for the SC_2D_4BH (2.18 ± 0.73 kPa, range 1.51 – 4.80 kPa) and 3D_5sl_SBH (2.05 ± 0.61 kPa, range 1.46 – 4.40 kPa) MREL sequences correlated very strongly (ICC=0.96). There was slight underestimation of stiffness using 3D_5sl_SBH with mean bias of 0.13kPa (4.91%, p=0.006). ROIs obtained by 3D_5sl_SBH were significantly larger (p<0.001) with bias of 15.03 cm2 (14.46%) compared to 2D_SC_4BH.Discussion
Liver shear stiffness values obtained by 3D_5sl_SBH correlate very strongly (ICC = 0.96) with stiffness values obtained by SC_2D_4BH, underestimating stiffness significantly (p=0.006) with a mean bias of 0.13 kPa (<5%). This small difference in shear stiffness, while statistically significant, is unlikely to be clinically relevant in most situations. While both the techniques had identical acquired spatial resolution, the difference in total ROI area across 4 slices was less than 15 cm2. 3D_5sl_HBH MREL has the potential to markedly decrease the scan time to estimate liver stiffness, in patients who can perform a 16 second breath-hold or alternatively increase the coverage over multiple breath-holds.Conclusion
Liver stiffness values measured in single breath-hold (<16 s) for 5 slices achieved by the combined use of wave polarity-inversion motion encoding and C-SENSE (3D_5sl_SBH) were comparable to liver stiffness values estimated by the standard of care MREL sequence. 3D_5sl_SBH MREL has potential clinical benefit of increased coverage.Acknowledgements
No acknowledgement found.References
[1] Singh S et al. Diagnostic performance of magnetic resonance elastography in staging liver fibrosis: a systematic review and meta-analysis of individual participant data. Clinical gastroenterology and hepatology, 2015: 13(3), 440–451. [2] Venkatesh SK. et al. Hepatic MR elastography: Clinical performance in a series of 1377 consecutive examinations. Radiology, Magnetic resonance elastography of liver: technique, analysis, and clinical applications. J Magn Reson Imaging. 2013: 37, 544–555. [3] Yin, M. et al. Hepatic MR elastography: Clinical performance in a series of 1377 consecutive examinations. Radiology, 2016: 278, 114–124. [4] Wang H. et al. Fusing acceleration and saturation techniques with wave amplitude labeling of time-shifted zeniths MR elastography. Magn Reson in Med. 2021: 85(3), 1552-1560, doi: 10.1002/mrm.28488. [5] Geerts-Ossevoort L. et al. A. Compressed SENSE. Speed done right. Every time. Philips Field Strength Magazine, 2018: 278, 6619. [6] Silva AM. et al. A. Magnetic resonance elastography: Evaluation of new inversion algorithm and quantitative analysis method. Abdom Imaging, 2015: 40, 810-817.Figures

Table 1. Area weighted liver shear
stiffness values and total region of interest per participant for SC_2D_4BH and
3D_5sl_SBH techniques. Data are reported as the mean ± standard deviation (minimum – maximum). Values are
based on manual analysis informed by a 95% confidence mask with matching ROIs
on images from both techniques and maximal possible ROI in each. SC_2D_4BH: 2D standard
of care 4 slices through mid-liver with 13 second breath-hold per slice; 3D_5sl_SBH:
3D wave polarity-inversion motion encoding plus compressed SENSE acquisition in
single breath-hold of <16s.

Table 2. Comparison of area weighted
liver shear stiffness values and total region of interest per participant for SC_2D_4BH
and 3D_5sl_SBH techniques. Data are reported as the mean ± standard deviation. Values are based on manual
analysis informed by a 95% confidence mask with matching ROIs on images from
both techniques and maximal possible ROI in each. SC_2D_4BH: 2D standard of
care 4 slices through mid-liver with 13 second breath-hold per slice; 3D_5sl_SBH:
3D wave polarity-inversion motion encoding plus compressed SENSE acquisition in
single breath-hold of <16s.
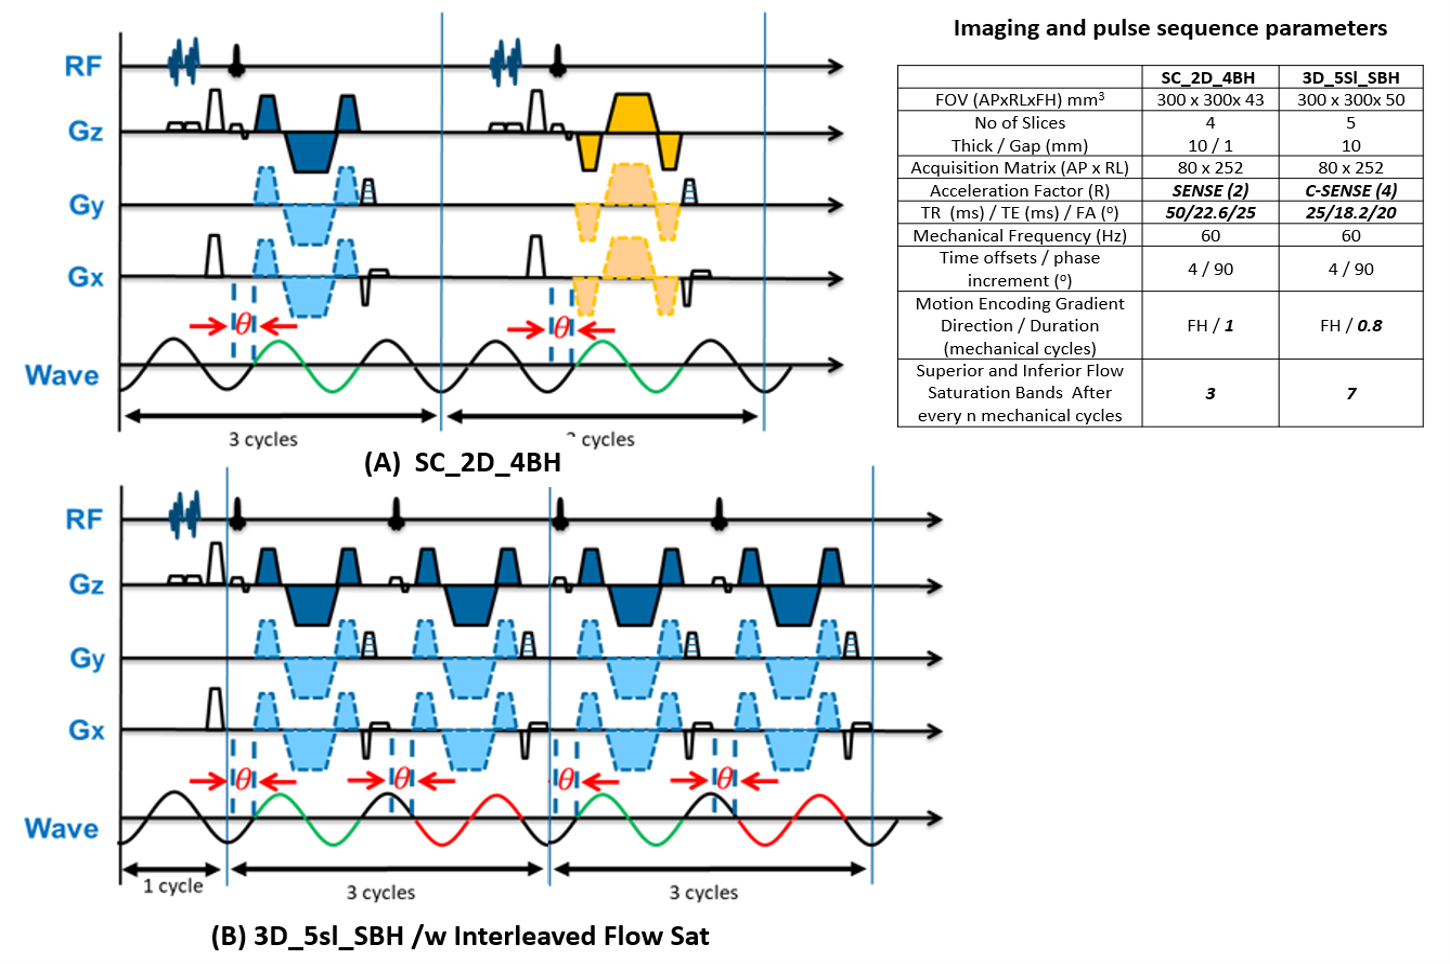
Figure 1: Schematic pulse sequence diagrams. (A) SC_2D_4BH: The polarity of MEGs is
reversed (blue and yellow) every RF excitation. The mechanical wave polarity
(green) stays the same across RF excitations. Each RF excitation triggers 3 motion
cycles. (B) 3D_5sl_SBH : The polarity of MEGs remains the same (blue) across RF
excitations. The mechanical wave polarity inverts (green and red) every RF
excitation. Every 4th RF excitation triggers 7 motion cycles. Each
sequence starts with dummy excitation of 1 s that ensures both acoustic and magnetization
steady-state.
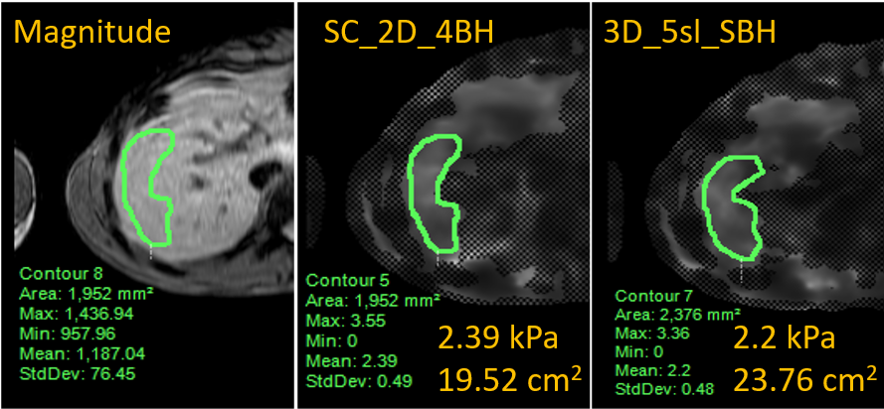
Figure 2: Representative magnetic resonance
elastography based shear stiffness maps with overlaid ROIs from manual
processing for SC_2D_4BH and 3D_5sl_SBH
techniques. The associated
mean shear stiffness values for the
contoured ROI are presented on the individual images. SC_2D_4BH: standard of care
two-dimensional 4 slices through mid-liver with 13 second breath-hold per slice;
3D_5sl_SBH: 3D wave polarity-inversion motion encoding plus compressed SENSE acquisition
in single breath-hold of <16s.
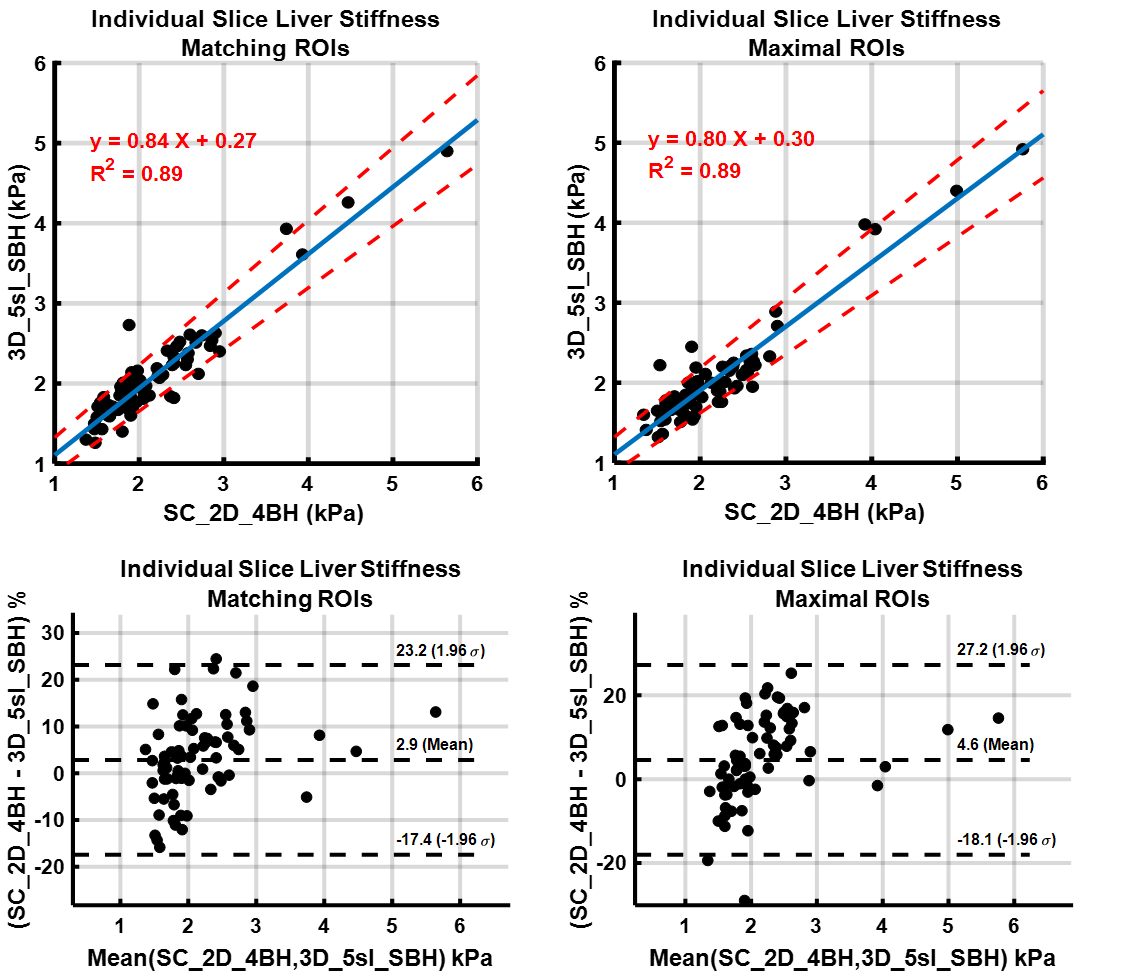
Figure 3: Comparison of liver shear stiffness values
in individual slices for SC_2D_4BH and 3D_5sl_SBH techniques by Linear Regression and Bland-Altman Analysis. Values
are based on manual analysis informed by a 95% confidence mask with matching
ROIs on images from both techniques and maximal possible ROI in each. SC_2D_4BH:
standard of care two-dimensional 4 slices through mid-liver with 13 second
breath-hold per slice; 3D_5sl_SBH: 3D wave polarity-inversion motion encoding plus
compressed SENSE acquisition in single breath-hold of <16s.