0351
Evaluating the Risk of Pediatric Neuroblastoma in the Abdomen with Amide Proton Transfer Imaging1Key Laboratory for Biomedical Engineering of Ministry of Education, Department of Biomedical Engineering, College of Biomedical Engineering & Instrument Science, Zhejiang University, Hangzhou, Zhejiang, China, 2Department of Radiology, Children’s Hospital, Zhejiang University School of Medicine, Hangzhou, Zhejiang, China, 3Philips Healthcare, Shanghai, China
Synopsis
Neuroblastoma (NB) most often occurs in young children, and accurate diagnosis of NB with anatomical MRI remains challenging. Here, we explored the potential of amide proton transfer (APT) imaging in evaluating the risk of pediatric abdominal NB. A total of 25 patients were enrolled, including 12 with low-risk NB and 13 with high-risk NB. An automatic shrinkage algorithm was applied to the initial region of interest delineated by an experienced radiologist to focus on the most aggressive part of tumors. We obtained an AUC of 0.917 for stratifying the risk of NB with APT, demonstrating the potential of clinical application.
INTRODUCTION
Neuroblastoma (NB) is the most frequently-seen extracranial solid tumor in children 1, accounting for over 7% of malignancies in patients less than 15 years old. The abdomen is the most common primary site for NB 2 . Accurate assessment of the risk of NB is critical for assessing prognosis and determining treatment strategies. However, it is challenging to use conventional MRI to assess the risk of NB preoperatively. Amide proton transfer (APT) 3, a subtype of chemical exchange saturation transfer (CEST) 4, imaging is a new MRI contrast approach that detects amide protons of endogenous mobile proteins and peptides in vivo. APT MRI has been successfully applied for predicting the grade of brain tumors 5, thoracic lesions 6 and rectal cancers 7. Here, we aimed to investigate the feasibility of APT imaging in the risk prediction of pediatric NB in the abdomen.METHODS
This study was approved by the local institutional review board. All MR images were obtained on a 3T Philips Achieva scanner. Sixty-seven patients underwent MR examinations, while 30 of them were excluded because of chemotherapy prior to APT imaging. Additionally, 11 patients were excluded due to motion artifacts in the abdomen, and one subject was discarded because the tumor size was smaller than 2 cm3. APT-weighted (APTw) images were acquired with a single-slice frequency-stabilized CEST sequence 8, using the following parameters: RF saturation power = 2 µT and duration = 0.8 sec, TR/TE = 3000/6.7 ms, SENSE factor = 2, slice thickness = 5 mm, FOV = 212 × 186 mm2, acquisition resolution = 2.2 × 2.2 mm2, and 63 frequency offsets from -6 to 80 ppm. A vendor-preset MIX sequence 9 was executed for the quantitative mapping of T1 and T2 values.For image processing, first, all APTw images of each subject were registered to the averaged +3.5 ppm image to mitigate the effects of motion 10. Second, we corrected B0-field inhomogeneity using the WASSR algorithm 11. Subsequently, the APTw value for each voxel was calculated using MTR asymmetry analysis 3. Third, the initial region of interest (ROI) of each patient was selected by an experienced pediatric radiologist to encircle the whole tumor (Fig. 1). Then, we excluded artifact voxels whose z-spectra were not smooth. Furthermore, we applied an automatic ROI-shrinking algorithm to the artifact-free joint ROI in order to focus on the most aggressive part of the tumor. The shrinkage algorithm calculated the histogram of the APTw signals in the joint ROI and selected the sub-area where the APT signal was greater than a user-selected cutoff (Fig. 1). The area under the receiver operating characteristic curve (AUC) and independent-sample t-test were used to assess the performance of APT MRI in differentiating high-risk and low-risk NBs.
RESULTS
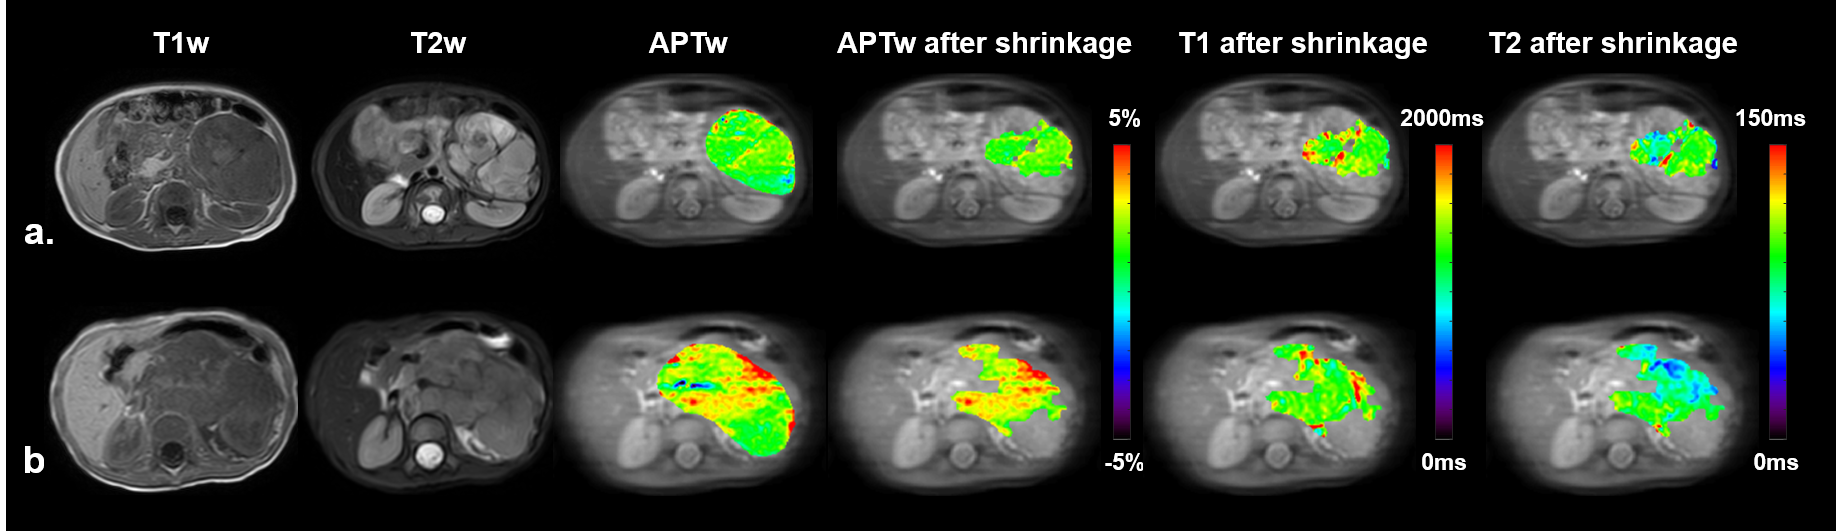
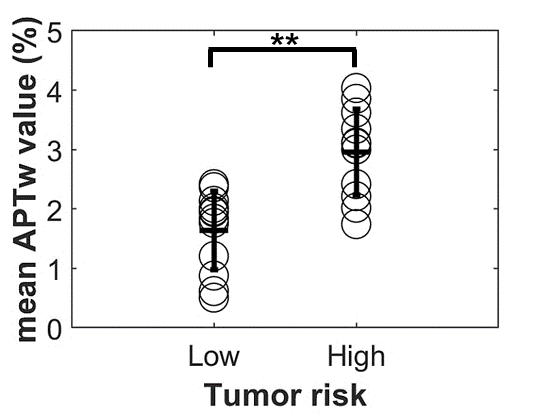
A total of 25 patients were enrolled in the final analysis, including 13 subjects with high-risk NB and the rest with low-risk NB, which were rated according to the International Neuroblastoma Risk Group Staging System (INRGSS) 12. The mean age of all participants was 3.92 2.74 years (range: 0.25 ~ 13.75 years). The characteristics of selected patients are summarized in Table 1.Representative cases of low- and high-risk NBs are shown in Figure 2, in which conventional MR images were not able to distinguish between the low- and high-risk NBs. However, the APTw images demonstrated substantially higher values in high-risk NBs than those in low-risk NBs. After excluding artifact voxels and automatically shrinking the ROI, a sub-area with higher APTw signals, which revealed the tumor's more aggressive area, was selected. The AUC of mean APTw values from ROIs without and with shrinkage were 0.776 and 0.917, respectively, reflecting the benefits of the automatic ROI shrinkage algorithm. Differently, the AUC of quantitative T1 and T2 values were 0.532 and 0.564, respectively, using the shrunken ROI (Table 2). As shown in Figure 3, the mean APTw value of low-risk NBs was 1.64 ± 0.64%, and that of high-risk NBs was 2.96 ± 0.67%, with a significant difference between these two groups (P<0.01).
DISCUSSION and CONCLUSION
The AUC of quantitative T1 and T2 values were both slightly higher than 0.5, indicating the limitation of them in evaluating the risk of NB. However, APTw MRI yielded a substantially higher AUC in stratifying the risk of newly-diagnosed NB. This might reflect the expression of molecular protein levels was more accurate in assessing the stage of NB than structural information provided by relaxation time mapping. Thus, APT MRI could provide extra valuable information for the diagnosis and treatment of abdominal NB in children. In conclusion, APT imaging has the potential as a biomarker for assessing the aggressiveness of pediatric neuroblastoma in the abdomen.Acknowledgements
NSFC grant number: 81971605, 61801421.References
1. Maris JM, Hogarty MD, Bagatell R, et al. Neuroblastoma. The Lancet 2007;369(9579):2106-2120.
2. Hiorns M, Owens C. Radiology of neuroblastoma in children. European Radiology 2001;11(10):2071-2081.
3. Zhou J, Payen J-F, Wilson DA, et al. Using the amide proton signals of intracellular proteins and peptides to detect pH effects in MRI. Nature medicine 2003;9(8):1085-1090.
4. Ward KM, Aletras AH, Balaban RS. A New Class of Contrast Agents for MRI Based on Proton Chemical Exchange Dependent Saturation Transfer (CEST). Journal of Magnetic Resonance 2000;143(1):79-87.
5. Togao O, Yoshiura T, Keupp J, et al. Amide proton transfer imaging of adult diffuse gliomas: correlation with histopathological grades. Neuro Oncol 2014;16(3):441-448.
6. Ohno Y, Yui M, Koyama H, et al. Chemical Exchange Saturation Transfer MR Imaging: Preliminary Results for Differentiation of Malignant and Benign Thoracic Lesions. Radiology 2016;279(2):578-589.
7. Nishie A, Takayama Y, Asayama Y, et al. Amide proton transfer imaging can predict tumor grade in rectal cancer. Magn Reson Imaging 2018;51:96-103.
8. Liu R, Zhang H, Niu W, et al. Improved chemical exchange saturation transfer imaging with real-time frequency drift correction. Magn Reson Med 2019;81(5):2915-2923.
9. In Den Kleef JJE, Cuppen JJM. RLSQ:T1,T2, and ρ calculations, combining ratios and least squares. Magnetic Resonance in Medicine 1987;5(6):513-524.
10. Zhang Y, Heo HY, Lee DH, et al. Selecting the reference image for registration of CEST series. Journal of Magnetic Resonance Imaging 2016;43(3):756-761.
11. Kim M, Gillen J, Landman BA, et al. Water saturation shift referencing (WASSR) for chemical exchange saturation transfer (CEST) experiments. Magnetic Resonance in Medicine 2009;61(6):1441-1450.
12. Cohn SL, Pearson ADJ, London WB, et al. The International Neuroblastoma Risk Group (INRG) Classification System: An INRG Task Force Report. Journal of Clinical Oncology 2009;27(2):289-297.
Figures
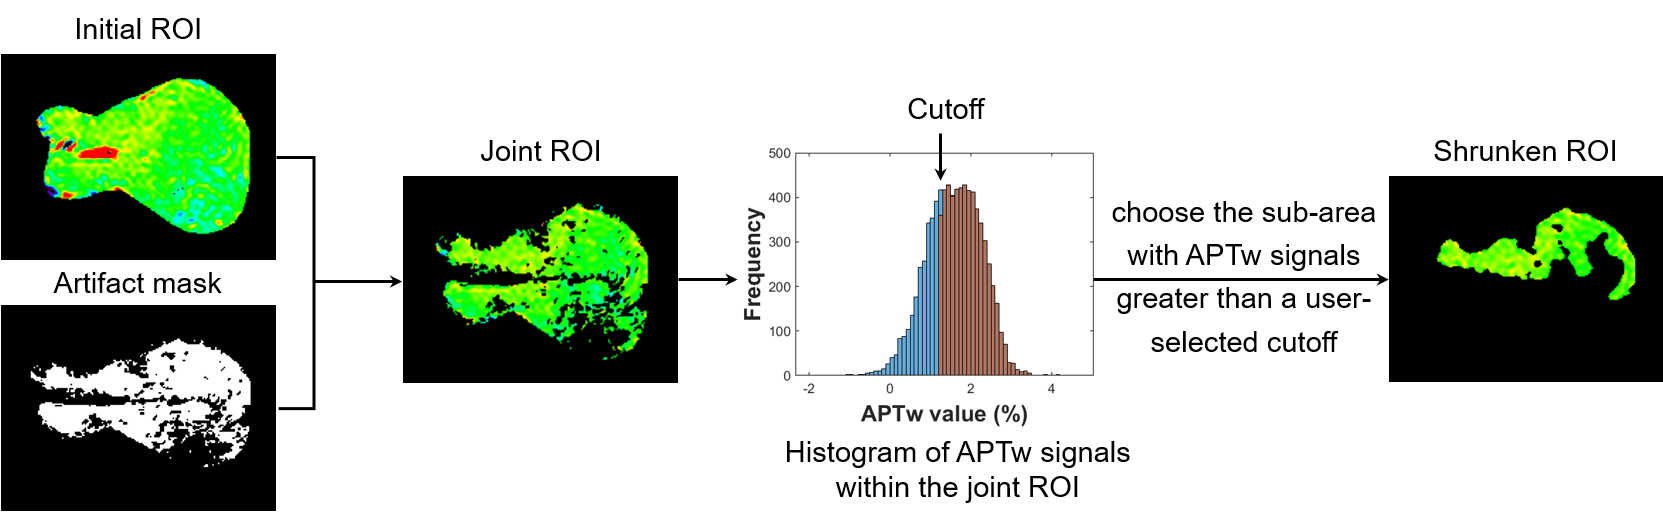

Table 1. Characteristics of enrolled patients.
Ages are expressed in mean ± standard deviation (range). Risk rating was according to the International Neuroblastoma Risk Group Staging System (INRGSS). Specifically, extremely-low- and low-risk were classified as low risk, and intermedia- and high-risk were classified as high risk.