0346
Ultra high-field, high-resolution, multi-voxel MRS in pre-manifest and early-manifest Huntington's Disease1Department of Radiology and Biomedical Imaging, University of California San Francisco, San Francisco, CA, United States, 2GE Healthcare, Munich, Germany, 3Department of Neurology, University of California San Francisco, San Francisco, CA, United States
Synopsis
In this study of Huntington's Disease (HD), we evaluated brain metabolites from pre-manifest HD (PM) and early-manifest HD (EM), as well as their relationship to disease burden and motor disturbances. We used multi-voxel MRS at ultra-high field strength (7T), in order to improve the reliability and sensitivity of detecting focal metabolic changes that are related to HD. We found metabolic alterations in the thalamus and insula and changes in choline, mI, glutathione and glutamate that were correlated with clinical measures of disease severity.
INTRODUCTION
Huntington's Disease (HD) is a autosomal neurodegenerative disorder with devastating cognitive, motor, psychiatric and behavior impairments. The prediction of disease onset and severity based on patient age and the number of CAG repeats from genetic tests for the individual patient is limited. Measuring biochemical changes could provide the insight into the state of underling pathologic changes. Changes in brain metabolites, such as NAA, glutamate and mI, have been reported in animal models and patients with HD. While these data suggest promise for MR spectroscopy (MRS) as a subject-specific biomarker, existing studies are based on single voxel spectroscopy and have to date been incapable of providing structure-specific description of brain metabolism. In this study, we evaluated structure-specific brain metabolic signatures in a group of patients with pre-manifest HD (PM) and early-manifest HD (EM), and assessed their relationships to disease burden and motor disturbance, using multi-voxel MRS at ultra-high field strength (7T).METHODS
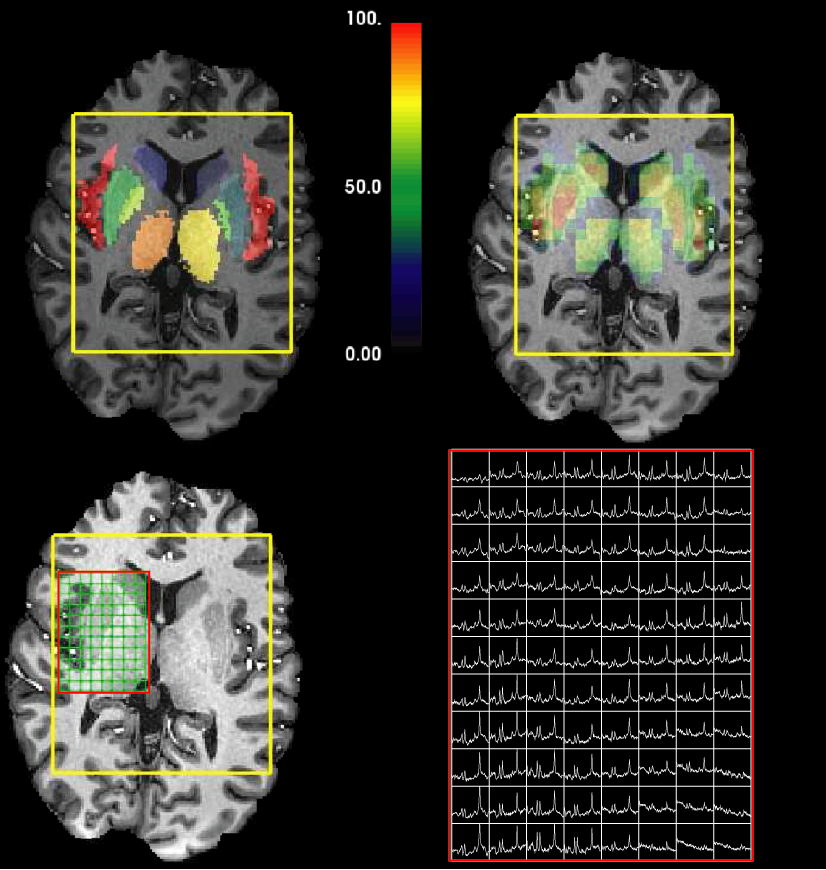
In our IRB-approved study of HD, we evaluated 9 PM (7F/2M, 36.2±8.5) and 6 EM (4F/2M, 51.5±9.8) patients, along with age- and gender-matched healthy controls (HCPM: 5F/1M, 38.6±8.3; HCEM: 4F/2M, 52.8±9.8). Clinical evaluation consisted of CAG2-repeat length, CAG-Age-Product-Scaled index (CAPS)1 and total motor score (TMS), which were 62.3±25.8 vs. 98.7±15.5 (PM vs. EM), and 2.6±2.6 vs. 12.0±9.3, respectively. All MR studies were performed using a 32-channel receive-only array with a volume transmit head coil on a whole-body 7T GE MR950 scanner. 3D T1-weighted SPGR images were acquired for anatomic correlation. Before the spectral acquisition, the manufacturer’s higher-order shimming procedure was performed. Multi-voxel MRS data were obtained using VAPOR water suppression and semi-LASER localization with TR/TE=2500/30ms, matrix=44x44, FOV=220x220mm, slice thickness 20mm, voxel size=5x5x20mm, and an interleaved flyback applied in the anterior/posterior (A/P) direction2. Spectral data were combined and processed as described previously3, and then quantified by LCModel4 using a simulated basis-set. N4 bias correction, brain extraction, and then segmentation using the AAL atlas were performed on the T1-weighted images. Regions of interest used in the analysis consisted of the insula, caudate, putamen, globus pallidus, and thalamus (Figure 1). The metabolic parameters were first evaluated in healthy controls to test differences between right and left hemispheres (RH, LH; Wilcoxon signed-rank tests) and to determine their relationship to age (Spearman rank correlation). Differences in metabolites between patients and age/gender-matched healthy controls were assessed using Wilcoxon rank-sum tests. Give the small size of the study population, Spearman rank tests were used to test the association between metabolic parameters and clinical measures.RESULTS
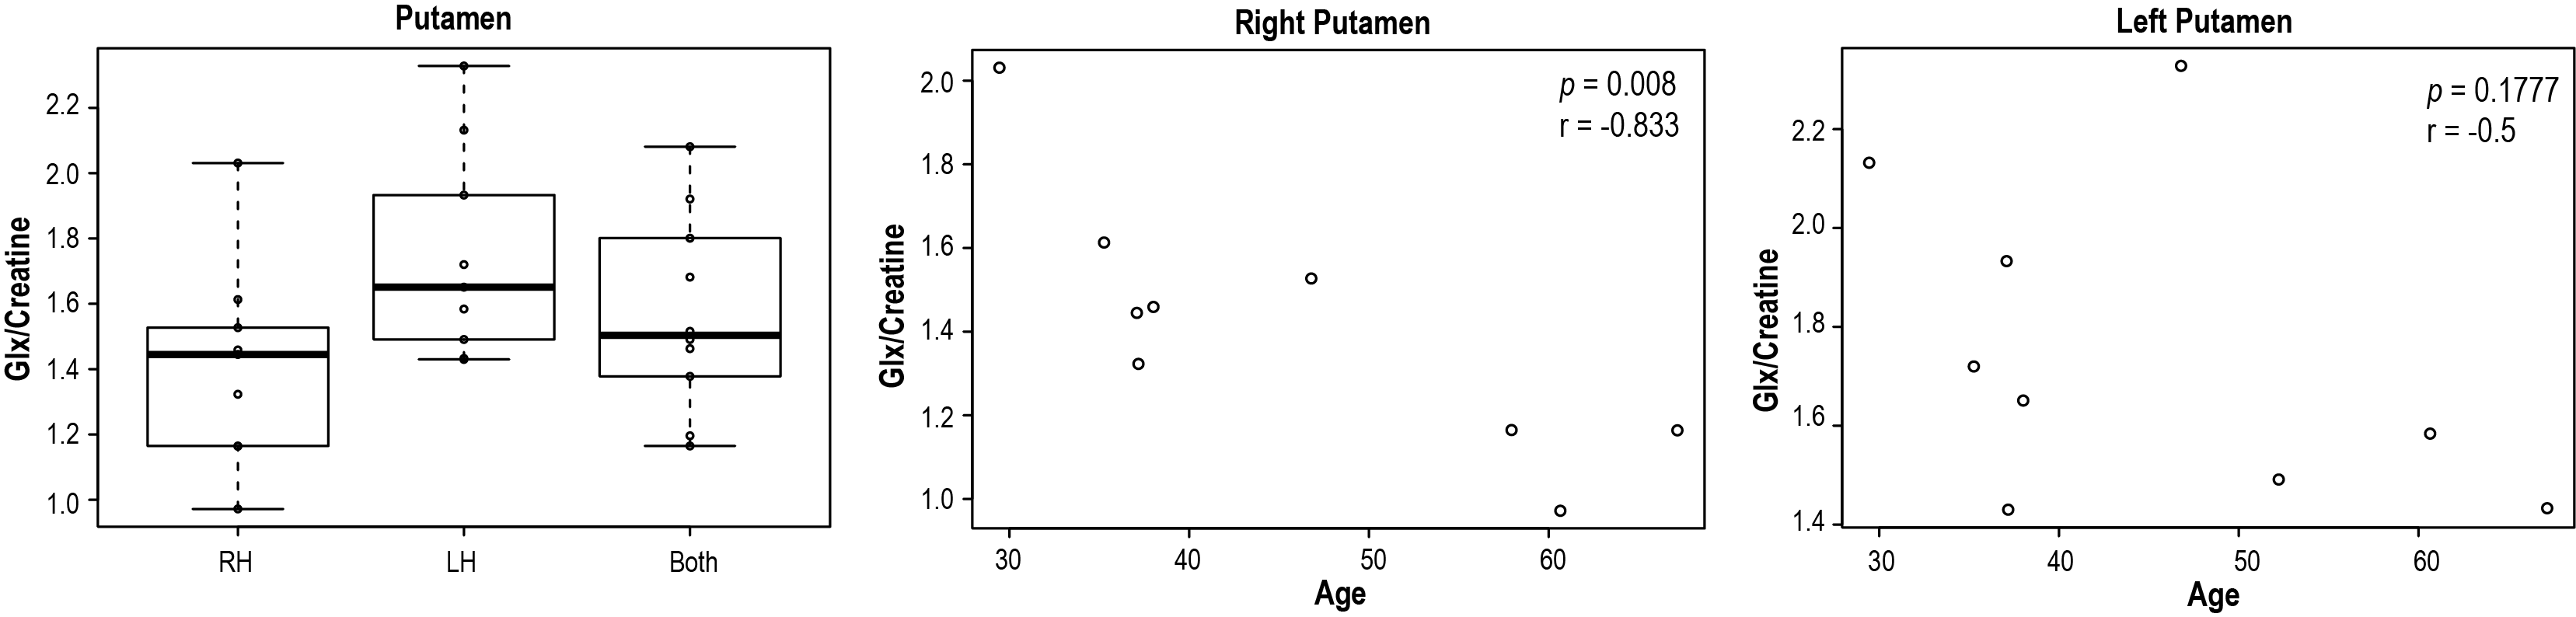
CAG2-repeat length were 40.4±4.5 for PM patients and 42±2.8 for EM patients, and CAPS scores were 62.3±25.8 for PM patients and 98.7±15.5 for EM patients.Figure 1 illustrates an example of regional and multi-voxel MRS data from a single patient. Among healthy controls, the glutamate+glutamine/creatine (glx/creatine) ratio was different in the putamen (right putamen: 1.78±0.33; left putamen: 1.44±0.32; p=0.014), and related to age in the right putamen (Figure 2). Other metabolites negatively associated with age included glutamate/creatine in the right (r=-0.80, p<0.05) and both sides of putamen (r= -0.77, p<0.05), NAA/creatine in the right thalamus (r=-0.88, p<0.01), glutamate/creatine (r=-0.745, p<0.05) and glx/creatine (r=-0.78, p<0.05) in the thalamus.
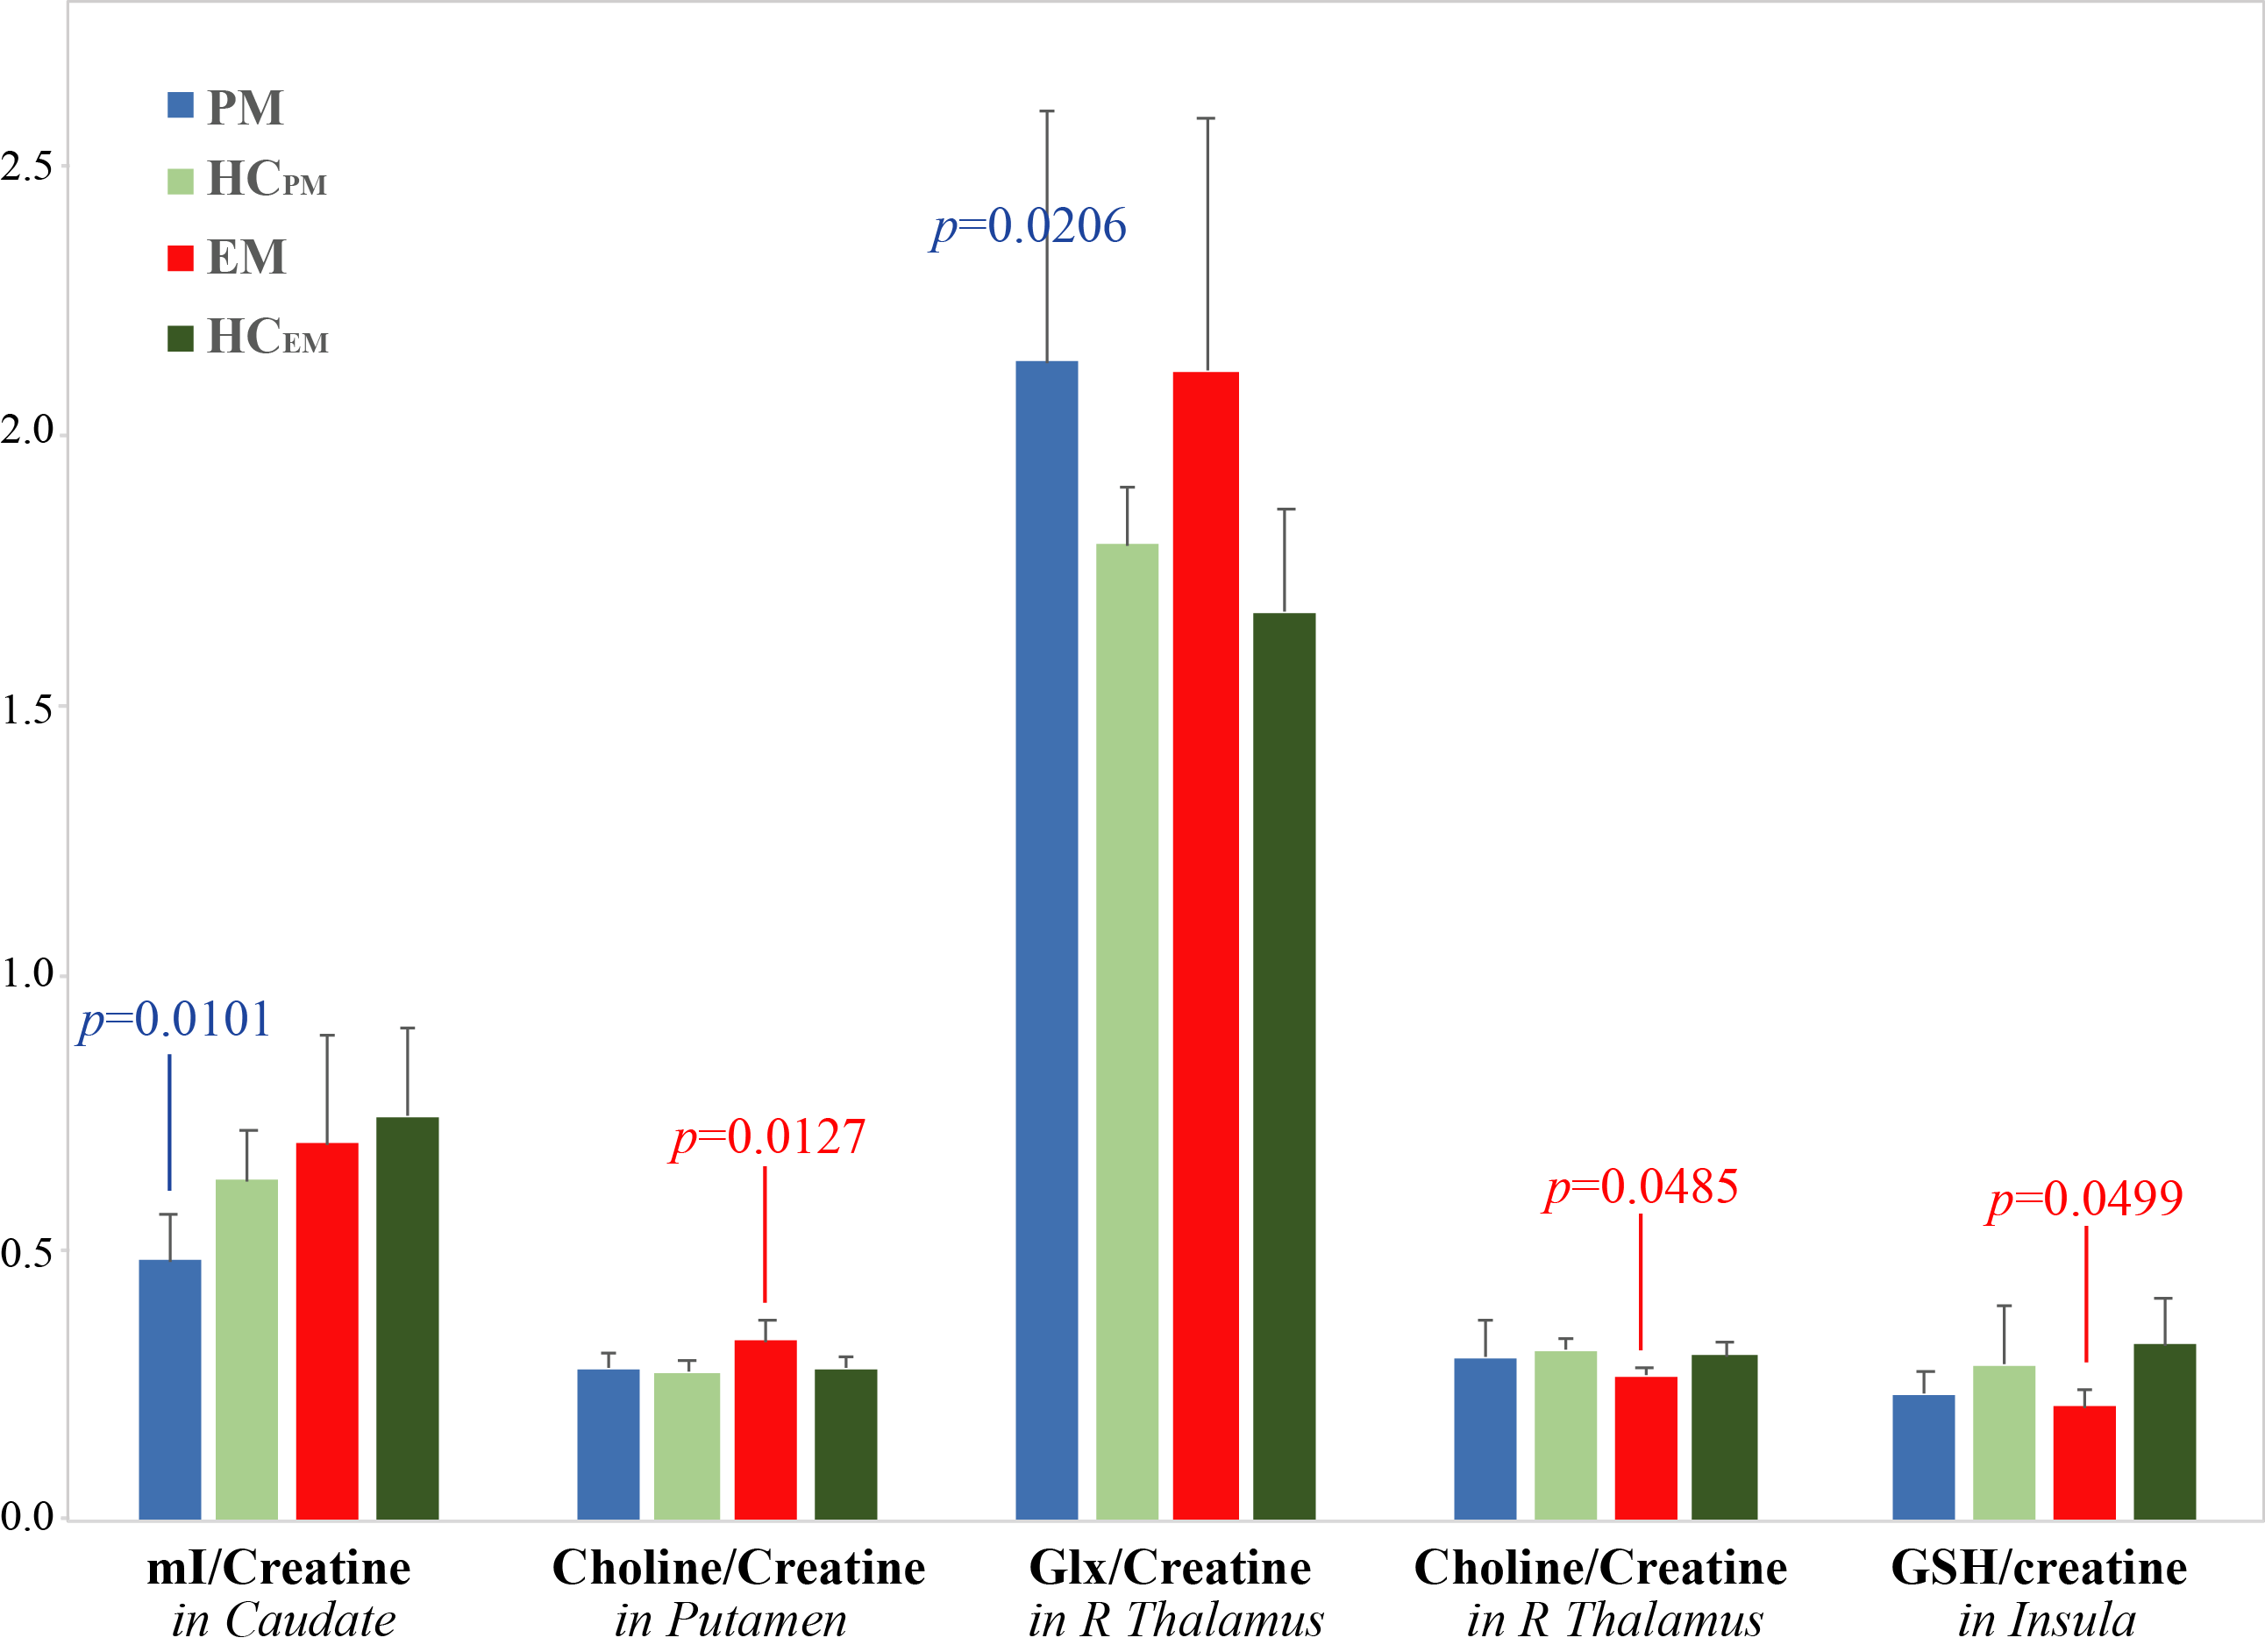
Figure 3 shows the metabolites that were significantly different between PM or EM groups and all of controls combined (HCEM+HCPM). When compared to age-/gender-matched healthy controls, only glutathione/creatine within the insula (EM vs. HCEM, p<0.01) remained significant.
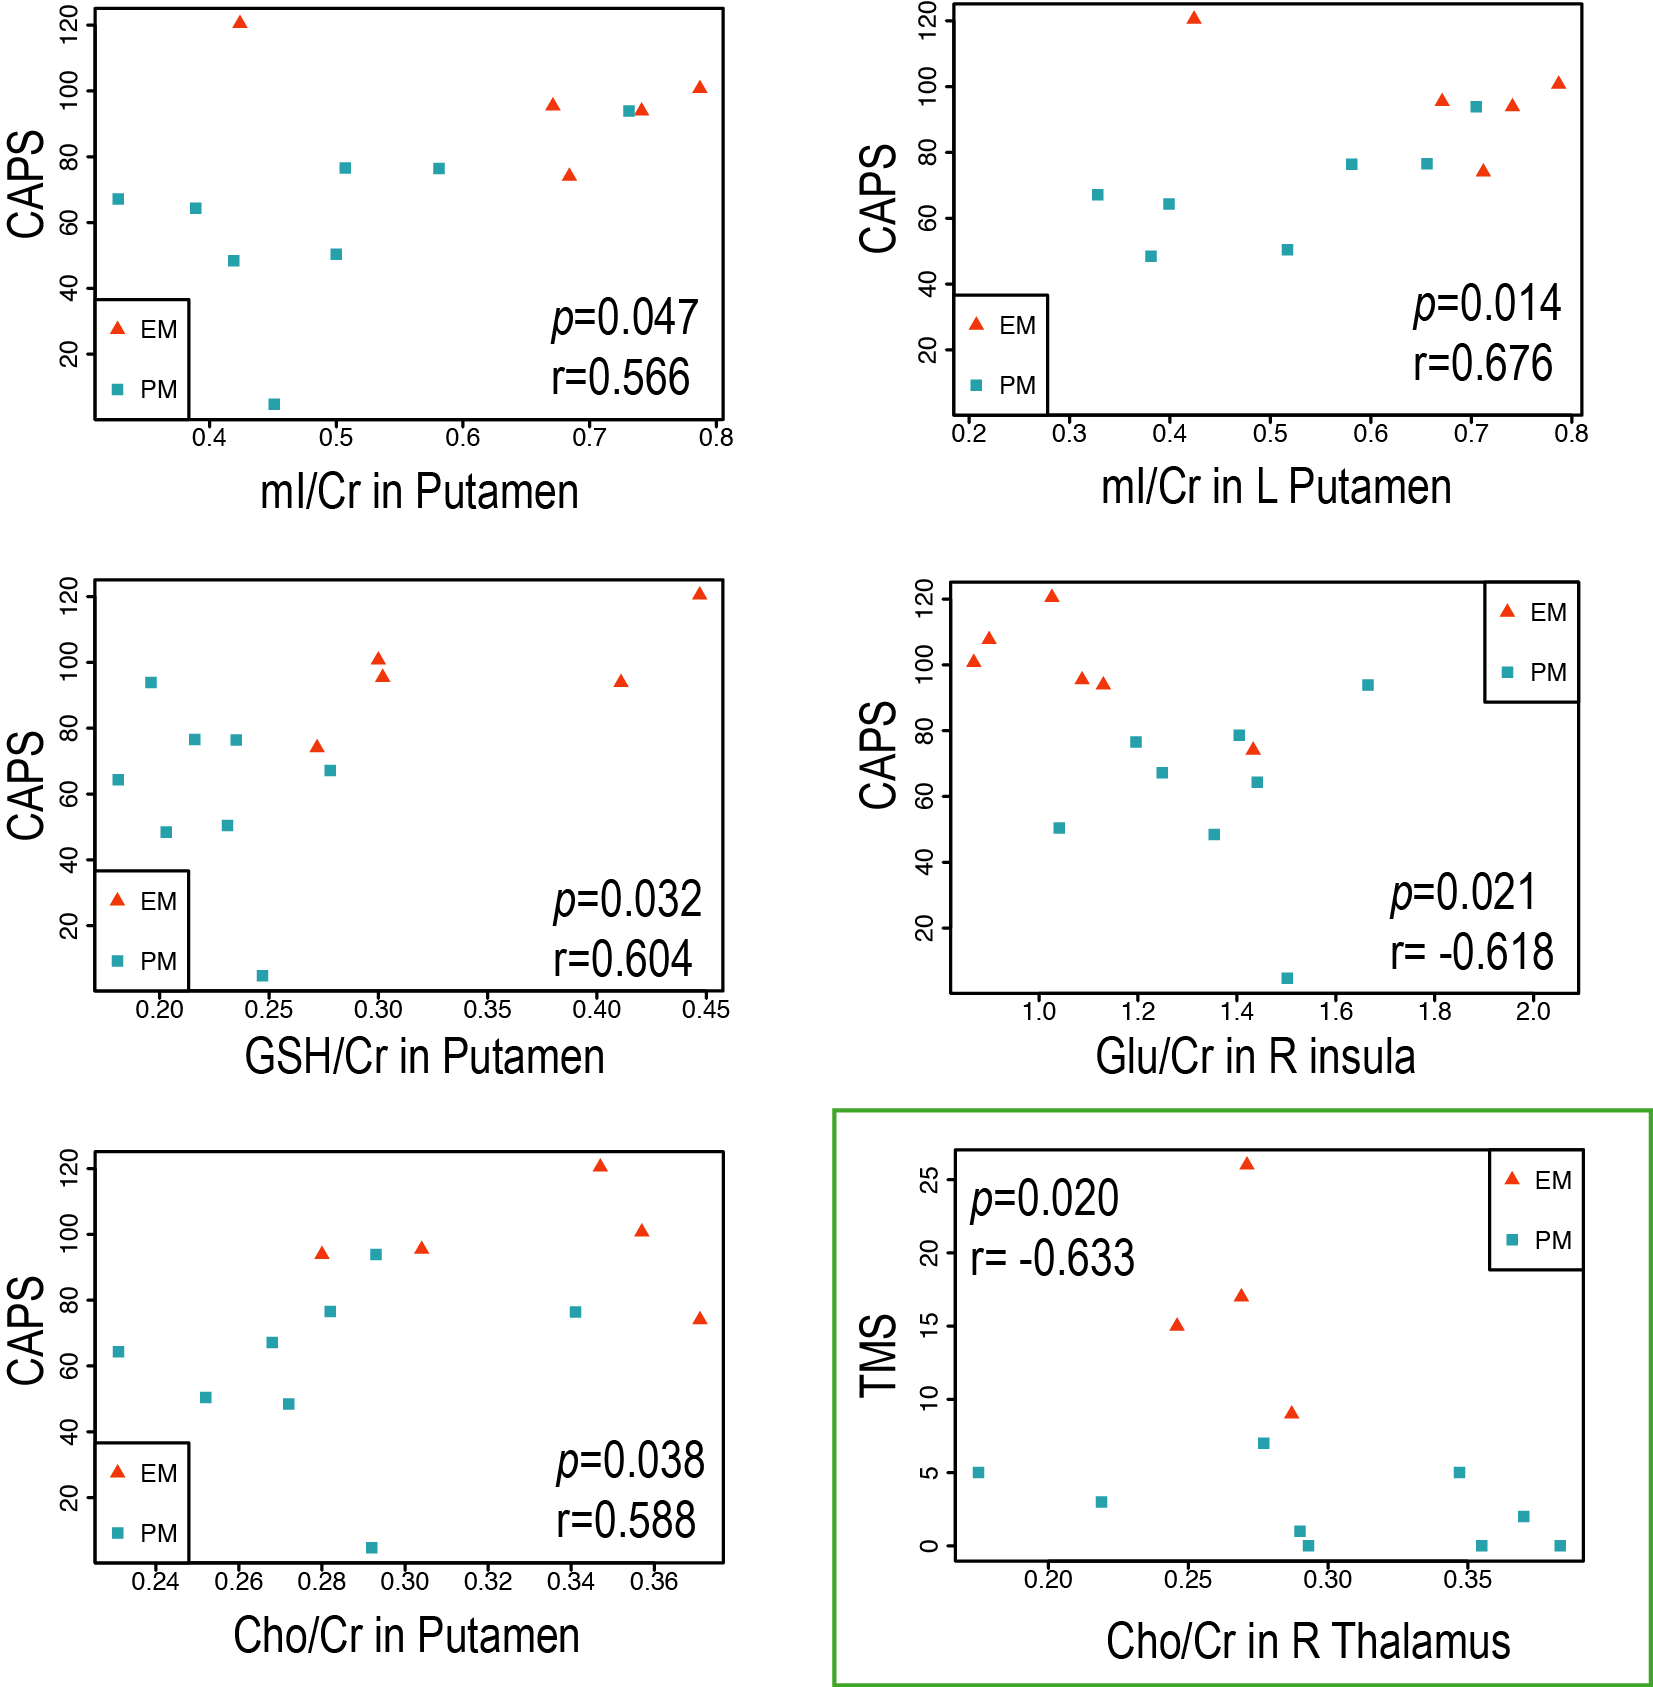
Figure 4 shows the regions in which they were significant associations between metabolite ratios and CAPS/TMS. Higher CAPS were significantly associated with higher mI/creatine in the left putamen (r=0.68, p<0.05) and putamen (r=0.57, p<0.05), lower glutamate/creatine in the right insula (r=-0.62, p<0.05), higher glutathione/creatine (r=0.60, p<0.05) and higher choline/creatine (r=0.59, p<0.05) in the putamen, while higher TMS was associated with lower choline/creatine in the right thalamus (r=-0.63, p<0.05).
DISCUSSION & CONCLUSIONS
This study demonstrates the feasibility of using a fast and high-resolution multi-voxel MRS acquisition at 7T to obtain brain metabolites in a group of patients with PM and EM at the spatial resolution of 0.5x0.5x2.0cm (0.5cm3) within a clinical feasible acquisition of 7 minutes. Compared to controls, PM patients had normal or reduced NAA in the putamen5,6, while manifest HD had reduced NAA in the caudate9, putamen5,7 and thalamus8, decreased glutamate in the putamen7, and increased choline/creatine in the thalamus8. In this study, levels of metabolite were referenced to creatine. Although some previous studies found no difference in creatine9, others reported a decrease in creatine in EM7, which may limit our finding. It has been also reported that motor function was correlated with mI in the putamen7, NAA in the caudate10, and Glx in the frontal lobe10. We additionally found metabolic alterations in the thalamus and insula and changes in choline and glutathione that were correlated with clinical measures of disease severity. Future studies will expand these findings to a larger cohort and evaluate the serial evolution of these metabolites prior to the onset of symptoms and characterizing their relationship with age and gender.Acknowledgements
This work was supported by NIH R01 CA127612, NIH R21 HD092660, NIH R01 R01NS099564 and a technology development research grant from GE Healthcare.References
1. Zhang Y, Long JD, Mills JA, et al. Indexing disease progression at study entry with individuals at-risk for Huntington disease. Am J Med Genet B Neuropsychiatr Genet. 2011;156B(7):751-763.
2. Li Y, Kaso A, Noeske R, et al. Ultra-high-field high-resolution semi-LASER MRSI of the brain. Paper presented at: Proceedings of the 27th Annual Meeting of ISMRM2019; Montreal, Canada.
3. Li Y, Larson P, Chen AP, et al. Short-echo three-dimensional H-1 MR spectroscopic imaging of patients with glioma at 7 Tesla for characterization of differences in metabolite levels. J Magn Reson Imaging. 2015;41(5):1332-1341.
4. Provencher SW. Estimation of metabolite concentrations from localized in vivo proton NMR spectra. Magn Reson Med. 1993;30(6):672-679.
5. Sturrock A, Laule C, Wyper K, et al. A longitudinal study of magnetic resonance spectroscopy Huntington's disease biomarkers. Mov Disord. 2015;30(3):393-401.
6. Reynolds NC, Jr., Prost RW, Mark LP. Heterogeneity in 1H-MRS profiles of presymptomatic and early manifest Huntington's disease. Brain Res. 2005;1031(1):82-89.
7. van den Bogaard SJ, Dumas EM, Teeuwisse WM, et al. Exploratory 7-Tesla magnetic resonance spectroscopy in Huntington's disease provides in vivo evidence for impaired energy metabolism. J Neurol. 2011;258(12):2230-2239.
8. Casseb RF, D'Abreu A, Ruocco HH, Lopes-Cendes I, Cendes F, Castellano G. Thalamic metabolic abnormalities in patients with Huntington's disease measured by magnetic resonance spectroscopy. Brazilian journal of medical and biological research = Revista brasileira de pesquisas medicas e biologicas. 2013;46(8):722-727.
9. Graham SF, Kumar PK, Bjorndahl T, et al. Metabolic signatures of Huntington's disease (HD): (1)H NMR analysis of the polar metabolome in post-mortem human brain. Biochim Biophys Acta. 2016;1862(9):1675-1684.
10. Padowski JM, Weaver KE, Richards TL, et al. Neurochemical correlates of caudate atrophy in Huntington's disease. Mov Disord. 2014;29(3):327-335.
Figures