0345
The Macromolecular Background Spectrum Does Not Change with Age in Healthy Participants
Steve C.N. Hui1,2, Tao Gong3, Helge J. Zöllner1,2, Yulu Song3, Yufan Chen3, Muhammad G. Saleh4, Mark Mikkelsen1,2, Georg Oeltzschner1,2, Sofie Tapper1,2, Weibo Chen5, Richard A.E. Edden1,2, and Guangbin Wang3
1Russell H. Morgan Department of Radiology and Radiological Science, The Johns Hopkins University School of Medicine, Baltimore, MD, United States, 2F.M. Kirby Research Center for Functional Brain Imaging, Kennedy Krieger Institute, Baltimore, MD, United States, 3Department of Imaging and Nuclear Medicine, Shandong Medical Imaging Research Institute, Cheeloo College of Medicine, Shandong University, Jinan, China, 4Department of Diagnostic Radiology and Nuclear Medicine, University of Maryland School of Medicine, Baltimore, MD, United States, 5Philips Healthcare, Shanghai, China
1Russell H. Morgan Department of Radiology and Radiological Science, The Johns Hopkins University School of Medicine, Baltimore, MD, United States, 2F.M. Kirby Research Center for Functional Brain Imaging, Kennedy Krieger Institute, Baltimore, MD, United States, 3Department of Imaging and Nuclear Medicine, Shandong Medical Imaging Research Institute, Cheeloo College of Medicine, Shandong University, Jinan, China, 4Department of Diagnostic Radiology and Nuclear Medicine, University of Maryland School of Medicine, Baltimore, MD, United States, 5Philips Healthcare, Shanghai, China
Synopsis
The aim of this project was to investigate the time course of macromolecular (MM) background spectrum during healthy aging. Recruiting a structured, cross-sectional cohort of 100 participants (10 male and 10 female subject per decade: 20s; 30s; 40s; 50s; and 60s), we acquired metabolite-nulled short-TE PRESS data and modeled the MM spectrum as a series of Gaussian signals at literature-defined chemical shifts. Linear regression of water-scaled MM signal areas revealed no significant relationship between age and MM signal areas, suggesting the MM spectrum may be more stable than has been suggested in the literature.
Introduction
Appropriate treatment of macromolecular (MM) signals is important for quantitative modeling of short-TE 1H spectra. While the commonest current approach is to rely on the default MM parametrization in LCModel, community consensus increasingly argues for the use of measured MM basis functions (either measured in each subject or averaged across subjects)(1-3). Access to pre-inversion sequences to effectively measure MM spectra is still limited, so there has been a recent effort to improve the dissemination/sharing of MM data throughout the community.The MM spectrum has been suggested to differ between young and old adults, particularly for resonances around 1.7 ppm (3-5). In this study, we set out to investigate this age effect in greater detail, by recruiting a structured cohort to build a cross-sectional dataset of the age trajectory of the MM background spectrum.Methods
100 healthy volunteers were recruited with local IRB approval (10 male and 10 female subjects per decade-of-life: 20s; 30s; 40s; 50s; and 60s). All subjects underwent a 3T MR examination (Philips Ingenia CX) during which metabolite-nulled spectra were collected with the following parameters: TR/TE 2000/30 ms; 30x26x26 mm3 voxel in the centrum semiovale white matter; 600 ms inversion time with an adiabatic hyperbolic secant pulse with 698 Hz bandwidth (FWHM); CHESS water suppression; PRESS voxel localization with 1.3 kHz refocusing bandwidth; 96 transients sampled at 2 kHz. Water reference spectra were acquired without water suppression or pre-inversion. T1-weighted MPRAGE data (TR/TE/ 8.1/3.7 ms; FA 8°) with 1 mm3 isotropic resolution were acquired for voxel positioning and tissue segmentation.Spectra were processed in Osprey (6). Frequency-domain metabolite-nulled spectra were modeled using a reduced basis set (NAA, Cr, Cho, Glu) and a flexible spline baseline (0.1 ppm knot spacing) in order to define the residual metabolite signals. The residual metabolite model was then subtracted from the acquired spectrum to yield a ‘clean’ MM spectrum (Figure 1). Data from four subjects were excluded due to the appearance of out-of-voxel lipid signals.Each voxel was co-registered to the SPM12-segmented (7) MRI to extract voxel tissue fractions. Water reference spectra were modeled in the frequency domain as Gaussian-Lorentzian signals, and each subject’s MM spectrum was scaled by the water integral, adjusted for tissue-specific water visibility and relaxation based upon literature values (8).All MM spectra were averaged and modeled as a sum of 14 Gaussian peaks between 0.5 and 4.1 ppm. The chemical shifts of the peaks followed Giapitzakis et al. (9), with the exception that the aspartate signal was collapsed to a single Gaussian (M2.66) to reflect the more strongly coupled case at 3T: M0.94; M1.22; M1.43; M1.69; M2.04; M2.27; M2.66; M3.01; M3.21; M3.71; M3.79; M3.87;. M3.97; and M4.2. Model parameters included the width and amplitude of each Gaussian (2x14=28 parameters), and three additional parameters modeled a global frequency shift (to account for ppm referencing) and a baseline offset and linear slope (31 parameters in total). Once the cohort-average spectrum had been modeled, the final model parameters were used to initialize modeling of the individual-subject spectra. For each subject, modeled MM signal areas were extracted for each Gaussian peak; for display purposes, the integrals between 3.71 and 3.97 ppm are combined. For each of the 14 MM resonances, Pearson correlation coefficients were calculated to investigate relationships between MM signal areas and age.Results
The 96 spectra included in further analysis are shown in Figure 2A, with the MM signal labels shown in Figure 2B. Average spectra are shown for male and female participants in Figure 2C, and the spectra are averaged from each decade of life in Figure 2D. The voxel was segmented as 80±4% white matter (WM), 18±4% gray matter (GM), and 2±1% CSF. There were no significant correlations between the water-scaled MM integrals and age (Figure 3, p>0.17 for all 11 correlations).Discussion
Macromolecular spectra were successfully acquired in 96 of 100 subjects, using pre-inversion to null the metabolite signals. Due to the range of metabolite T1s, additional post-processing was performed to remove residual metabolite signals from the spectra, as implemented within Osprey. The ‘cleaned’ MM spectra were consistent between male and female subjects, and stable with age. The resulting mean MM spectrum is implemented within the default workflow for linear-combination modeling of short-TE spectra in Osprey. The results of this study differ from a previous report of age-related changes in specific peaks in the MM spectrum (4,5). It is possible that these discrepancies are explained by the different brain region. The water referencing procedure used here differs from that account in using the same relaxation values at all ages, but this scaling factor applies to the whole MM spectrum equally, and cannot explain the emergence of age-dependence for a small subset of MM signals. Our study benefits from increased sample size and a cohort spanning a wider age range to allow for correlational analysis. There is much value in resolving the question of whether the MM spectrum changes with age and other factors. This strong evidence of stable MM spectra with age and sex support the use of average MM spectra in LCM analyses for many applications.Acknowledgements
This work was supported by NIH grants R01 EB016089, R01 EB023963, R21 AG060245 and K99 AG062230.References
- Wilson M, Andronesi O, Barker PB, et al. Methodological consensus on clinical proton MRS of the brain: Review and recommendations. Magn Reson Med 2019;82(2):527-550.
- Near J, Harris AD, Juchem C, et al. Preprocessing, analysis and quantification in single-voxel magnetic resonance spectroscopy: experts' consensus recommendations. NMR Biomed 2020:e4257.
- Cudalbu C, Behar KL, Bhattacharyya PK, et al. Contribution of macromolecules to brain (1) H MR spectra: Experts' consensus recommendations. NMR Biomed 2020:e4393.
- Marjanska M, Deelchand DK, Hodges JS, et al. Altered macromolecular pattern and content in the aging human brain. NMR Biomed 2018;31(2).
- Hofmann L, Slotboom J, Boesch C, Kreis R. Characterization of the macromolecule baseline in localized (1)H-MR spectra of human brain. Magn Reson Med 2001;46(5):855-863.
- Oeltzschner G, Zollner HJ, Hui SCN, et al. Osprey: Open-source processing, reconstruction & estimation of magnetic resonance spectroscopy data. J Neurosci Methods 2020;343:108827.
- Friston KJ, Holmes AP, Worsley KJ, Poline JP, Frith CD, Frackowiak RSJ. Statistical parametric maps in functional imaging: A general linear approach. Human Brain Mapping 1994;2(4):189-210.
- Wansapura JP, Holland SK, Dunn RS, Ball WS, Jr. NMR relaxation times in the human brain at 3.0 tesla. J Magn Reson Imaging 1999;9(4):531-538.
- Giapitzakis IA, Avdievich N, Henning A. Characterization of macromolecular baseline of human brain using metabolite cycled semi-LASER at 9.4T. Magn Reson Med 2018;80(2):462-473.
Figures
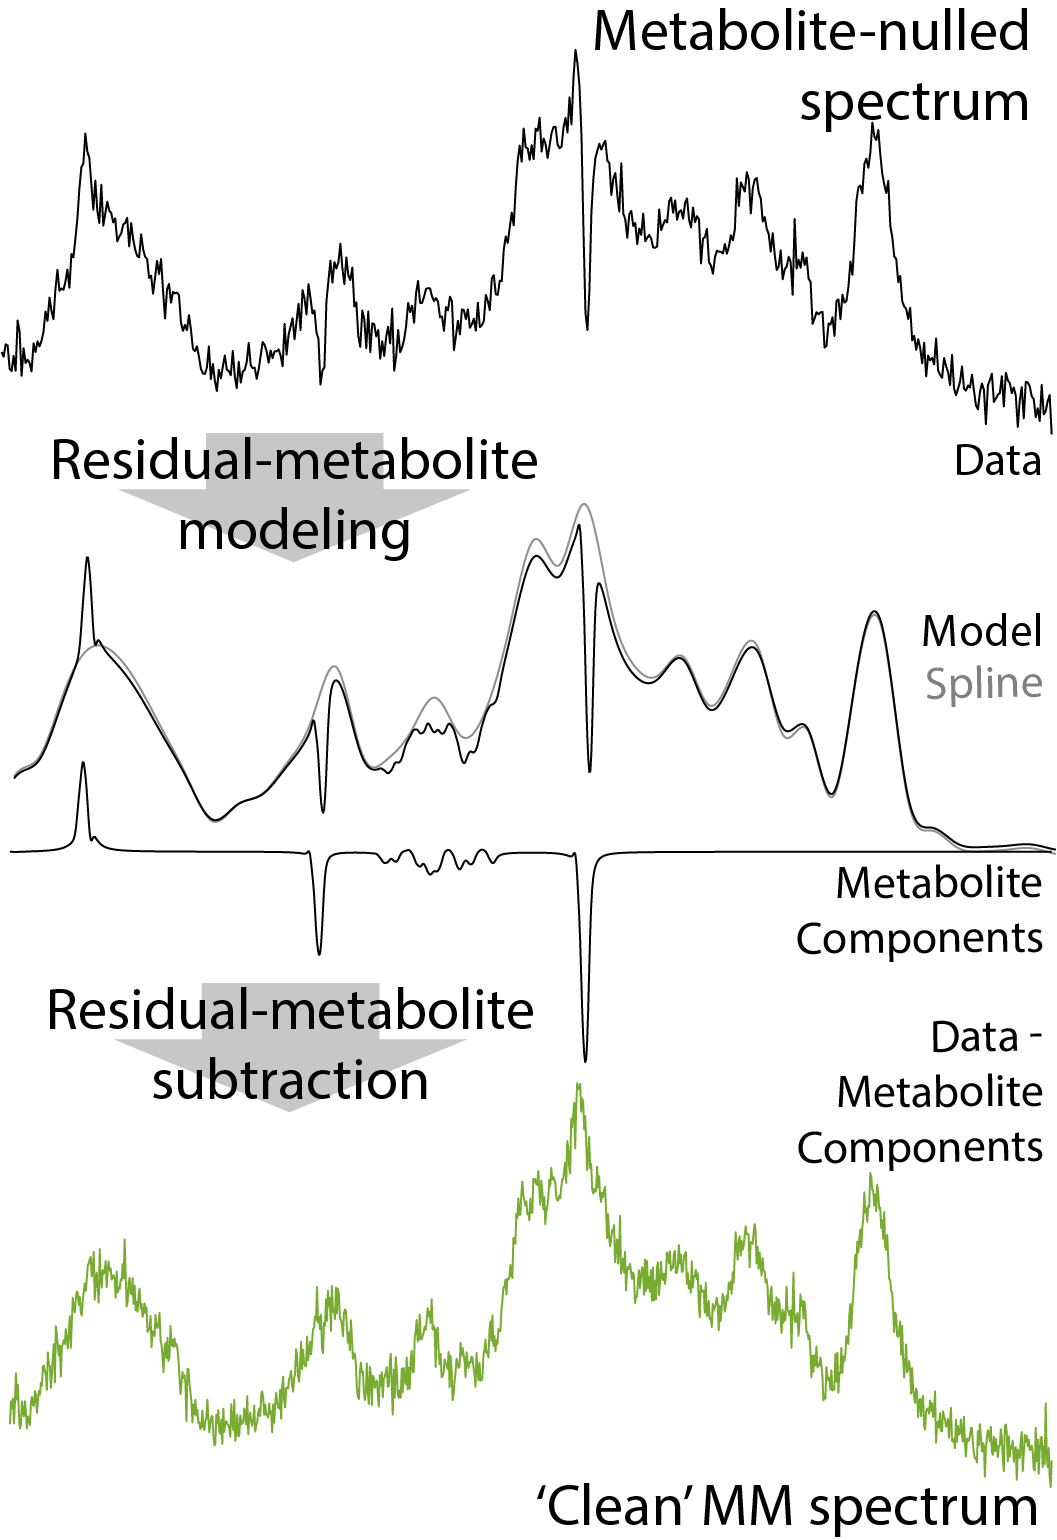
Figure 1. Osprey analysis workflow to remove residual metabolite signals and generate ‘clean’ MM spectrum.
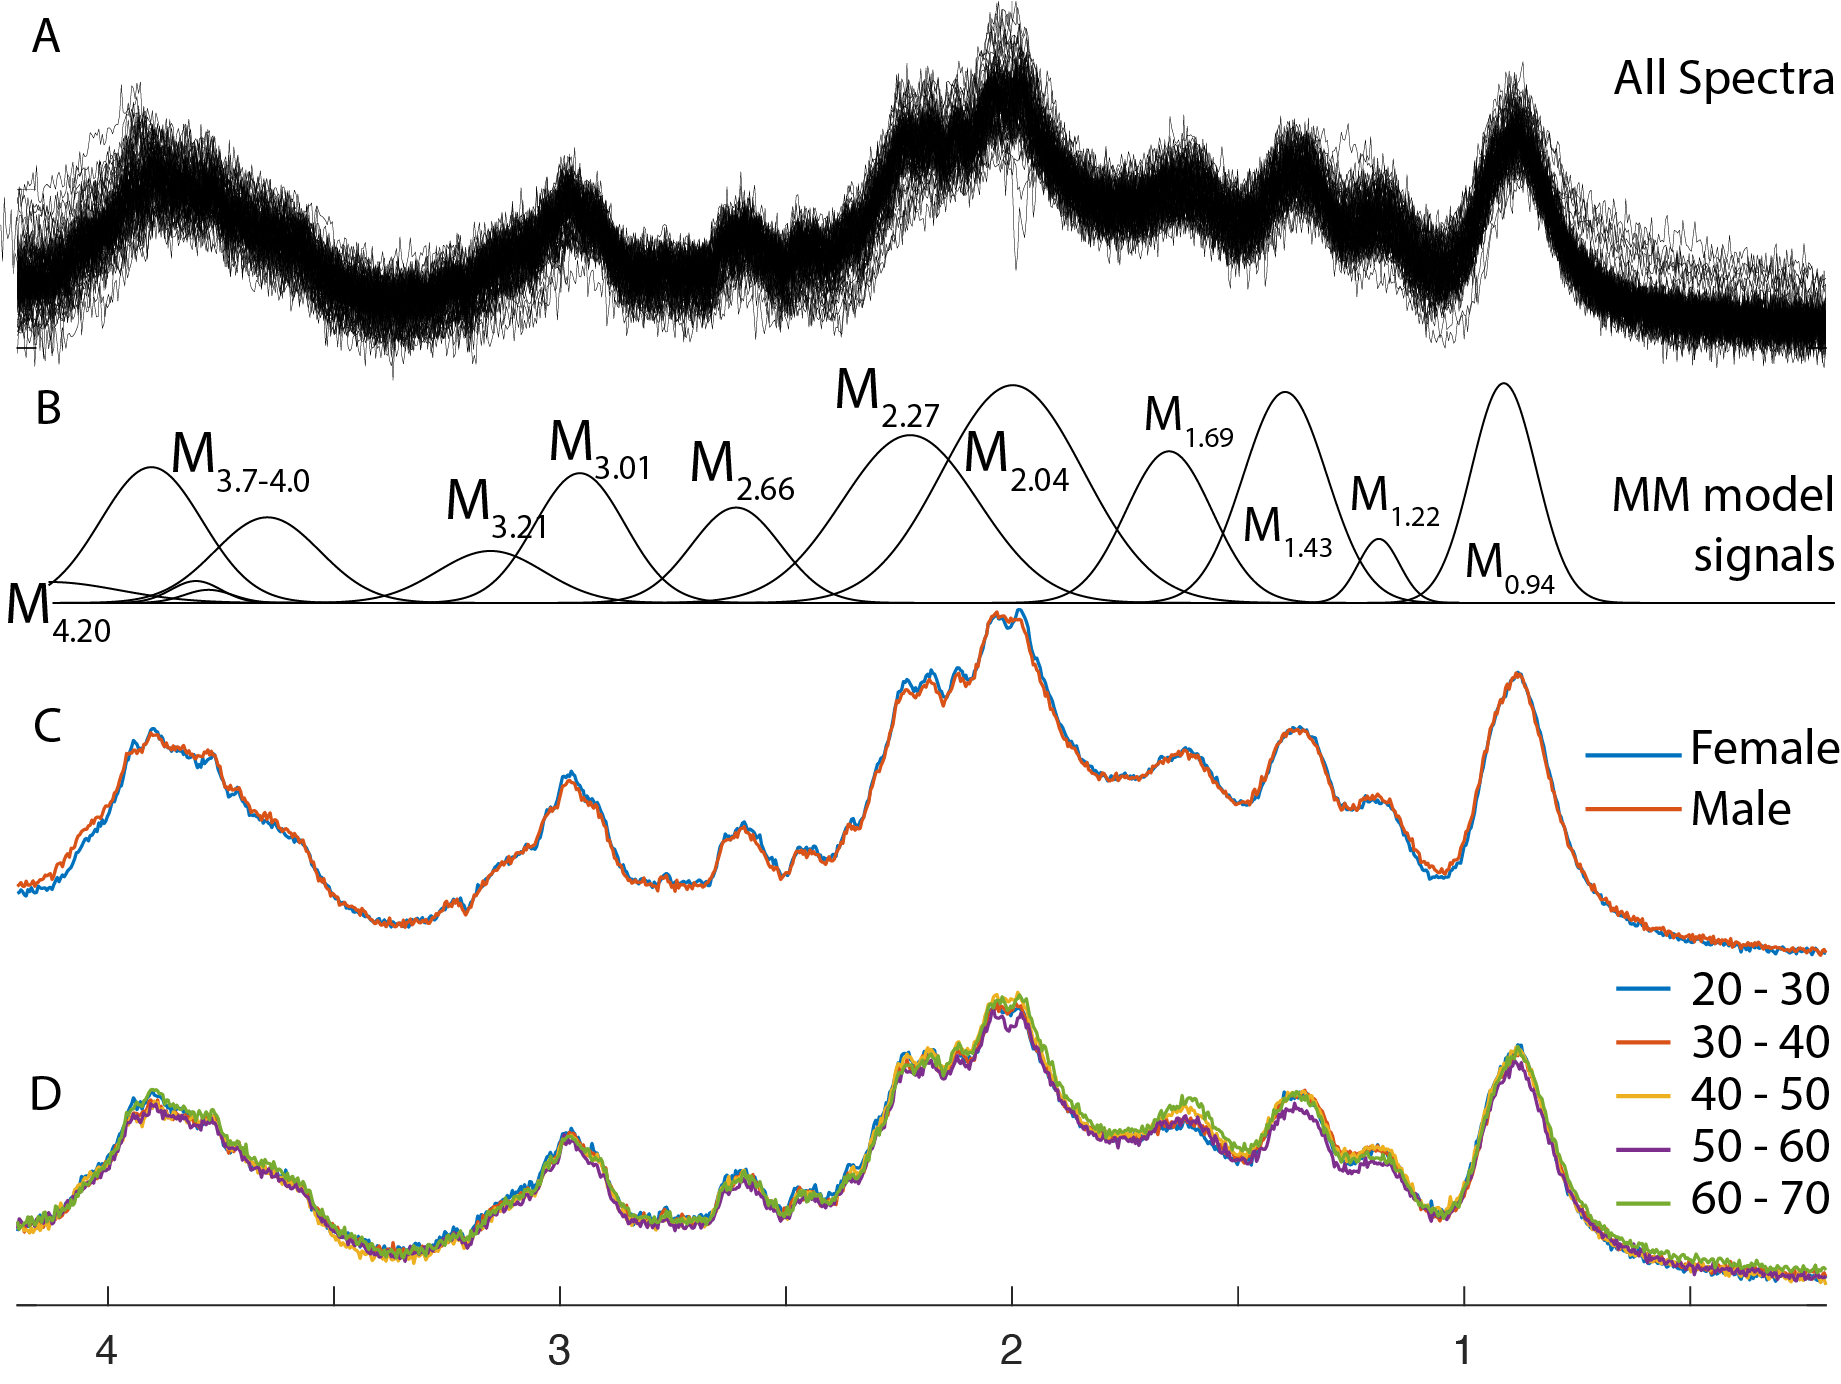
Figure 2. MM spectra from centrum semiovale white matter. Spectra from 96 subjects are overlaid in panel A, and the metabolite model signals are labeled in panel B. The mean spectra for male and female subjects are compared in panel C. The mean spectra for each decade of age are compared in panel D.
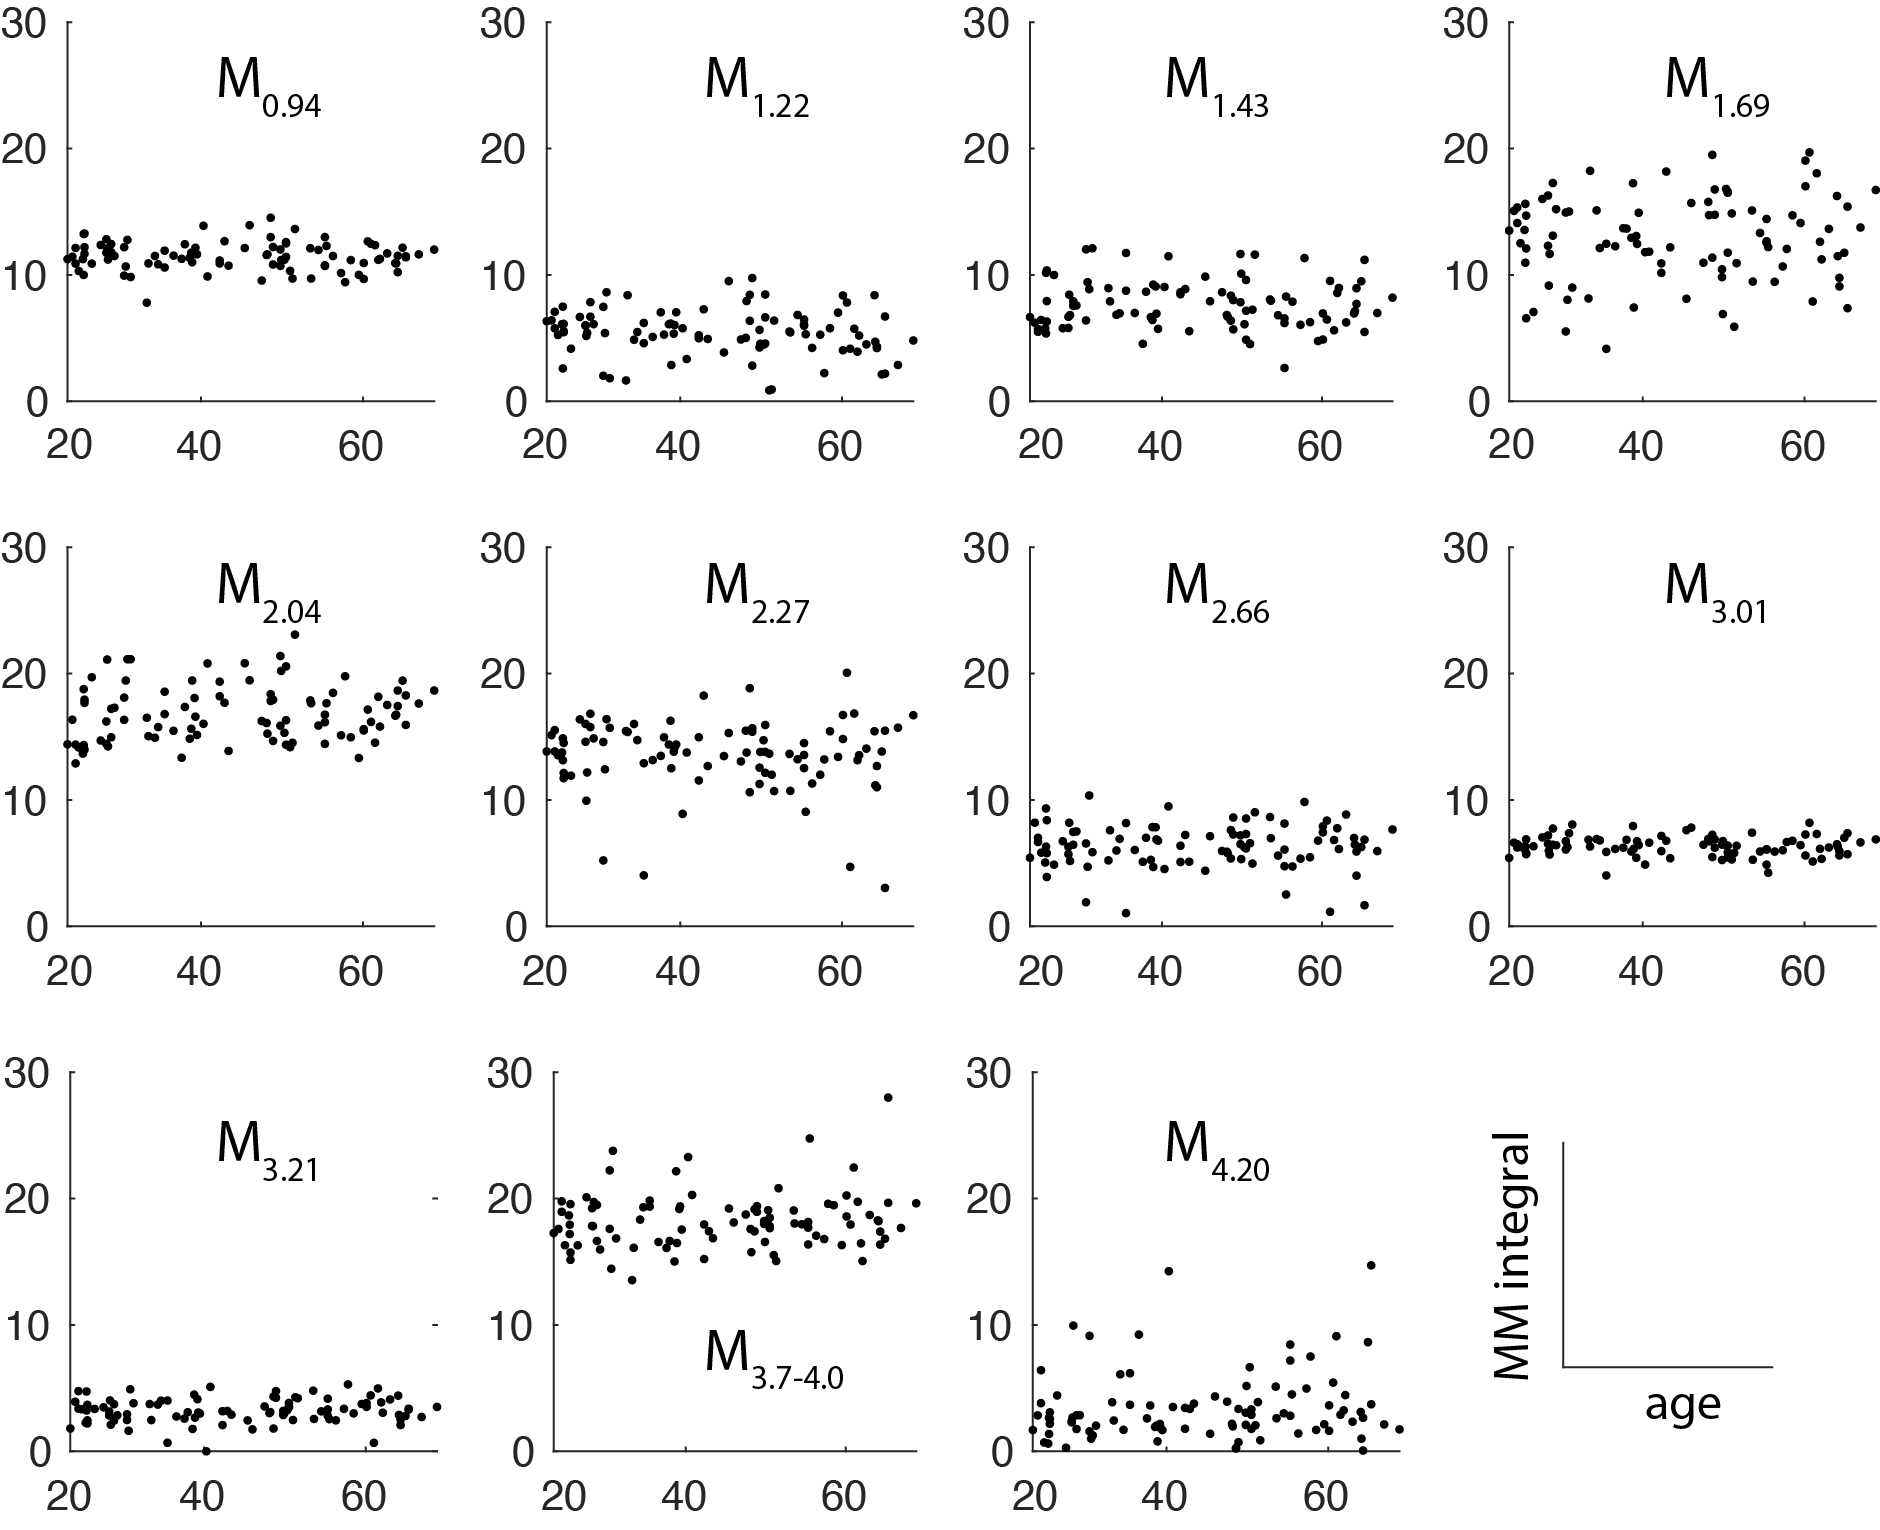
Figure 3. MM-age correlation plots. Water-referenced MM signals appear to be stable with age across the age range 20-70 (p>0.17 for all 11 correlations).