0344
Combining 1H MRS and deuterium labeled glucose for mapping of neural metabolism in humans1Center for Magnetic Resonance and Optical Imaging, Department of Radiology, University of Pennsylvania, Philadelphia, PA, United States, 2Siemens Medical Solutions, USA, Malvern, PA, United States, 3Department of Radiology, University of Pennsylvania, Philadelphia, PA, United States, 4Department of Neurology, University of Pennsylvania, Philadelphia, PA, United States
Synopsis
Here we present spectroscopic and chemical shift imaging data from the brains of healthy human subjects acquired using a novel method termed qMRS, which enables tracking of metabolic turnover with the inherent sensitivity of 1H MRS and widespread applicability using standard 1H-based clinical MRI scanners. We demonstrate the feasibility of using qMRS and its corollary chemical shift imaging technique (qCSI) to monitor the temporal and spatial dynamics of metabolite labelling in the human brain following oral consumption of deuterium-labeled glucose. Unlike the related technique of deuterium metabolic imaging (DMI), qMRS does not require implementation of multinuclear MR spectroscopy.
Introduction
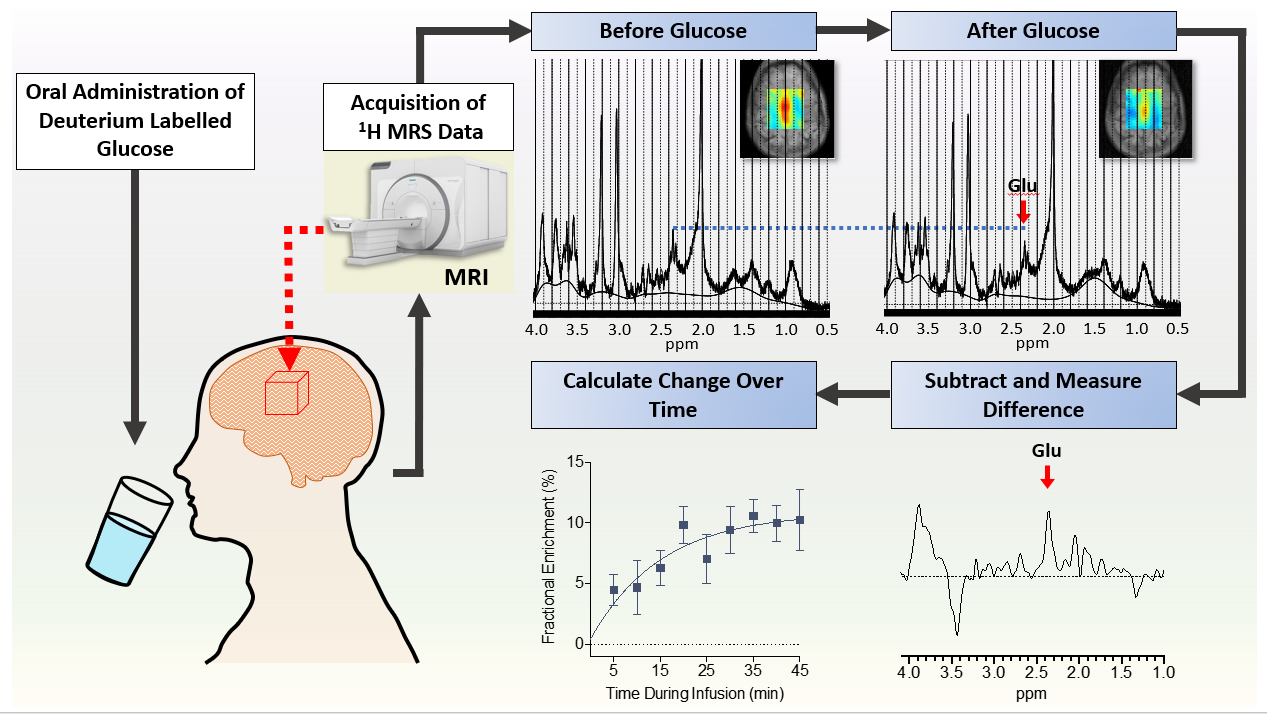
Quantitative exchange label turnover MRS (qMRS) is a recently developed strategy which increases the range of applications for magnetic resonance based metabolic mapping without the requirement for specialized hardware1. Similar to recently developed deuterium metabolic imaging (DMI)2, this technique relies on the administration of deuterium labeled glucose, resulting in accumulation of downstream 2H labeled metabolites. Since the 2H label is invisible in 1H MRS, accumulation of labeled metabolites leads to an overall reduction in the endogenous 1H MRS signal of the corresponding resonances. Here we present the initial demonstratation of qMRS and its corresponding chemical shift imaging technique, qCSI, applied to the measurement of neural metabolism in human beings at 7T .Methods
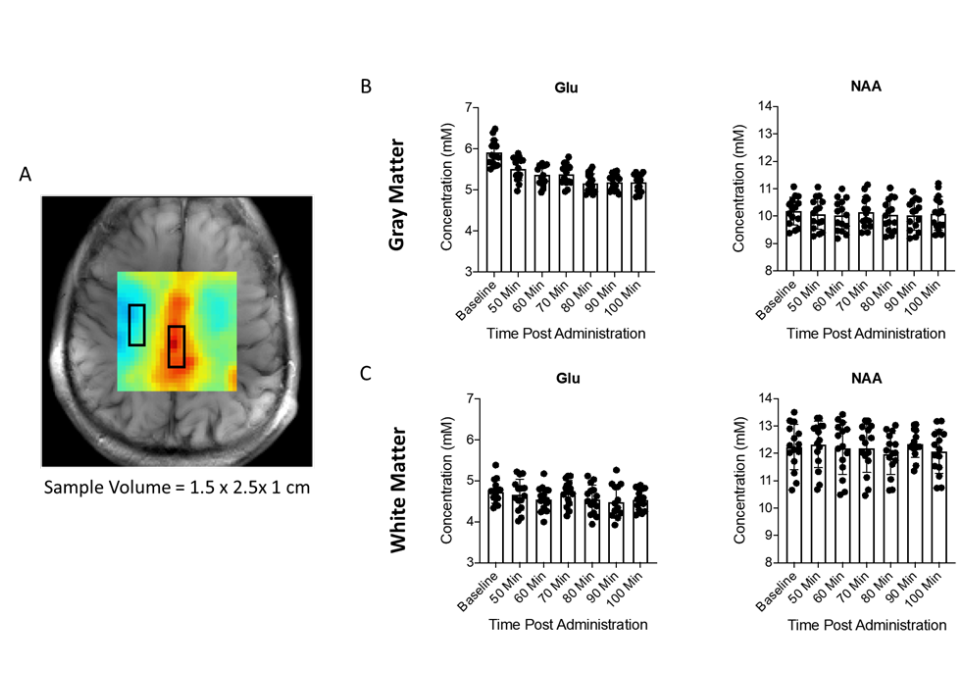
This protocol was approved by the Institutional Review Board at the University of Pennsylvania, with informed consent obtained prior to the initial scan. Eight subjects participated in this study, four male and four female, of average age 29.5 years. MR experiments were performed on a 7T scanner (MAGNETOM Terra, Siemens Healthcare, Erlangen, Germany) in investigational mode equipped with a 1Tx/32Rx head coil (Nova Medical, Wilmington, MA, USA). The volunteers fasted overnight before undergoing studies in the morning. Subjects were scanned for approximately two hours, beginning directly after oral ingestion 0.8g/kg of body weight of [6,6′-2H2] glucose dissolved in water. Axial T1-weighted FLASH images were obtained to enable localization of the cortex. Following localization, spectroscopy data were acquired using custom sequences for CSI with sLASER localization (MRSI)3 and SVS with PRESS localization4. Specifically, SVS and the initial MRSI measurement were performed directly upon positioning the subject in the scanner (t = 20-30 mins post-ingestion), with six subsequent MRSI acquisitions (t = 50, 60, 70, 80, 90, 100 mins) and one additional SVS acquisition (t = 120 mins) at the end of the experiment. Voxel sizes of MRSI and SVS were 10mm3 and 10x30x10 mm, respectively. Analysis of the spectra was performed using LCModel and MATLAB.Results
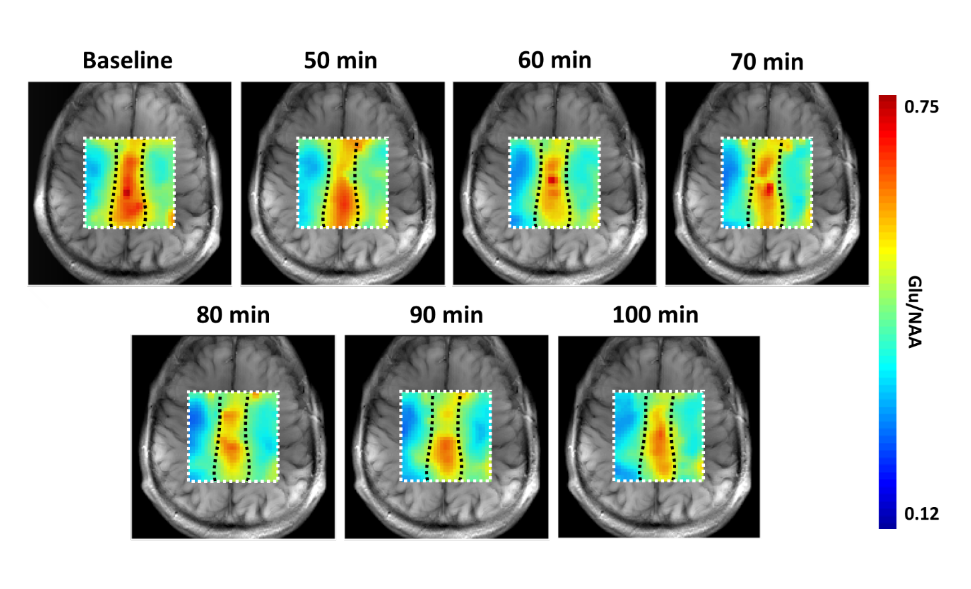
To demonstrate the potential of qMRS based metabolic flux imaging, we performed a time series of qCSI measurements on four subjects. Figure 2 shows representative qCSI maps in a healthy male volunteer as a time course following oral consumption of deuterated glucose. As the deuterated glucose is metabolized, the fraction of Glu labelled with deuterium increases, and the 1H MRS amplitude decreases. In contrast, NAA, which does not turn over on this time scale, has no change in its NMR signal. Thus, the Glu/NAA ratio decreases as the deuterium enrichment of Glu increases over time. The magnitude of this decrease reflects the rate of glucose to glutamate metabolism in a spatially resolved manner. This visible change was observed for all subjects. To compare qCSI derived changes in Glu and NAA concentrations for gray and white matter regions, a subregion analysis (3 x 5 voxels) was performed (Figure 3A, black boxes) and measurements averaged over all subjects for each timepoint. The results of this computation are plotted in Figures 3B and 3C. In the gray matter voxels, the average decrease observed in the Glu signal from baseline to post-glucose ingestion was 0.7 mM, or a 12% decrease from the pre-ingestion value; in the white matter, an average of 0.2 mM, corresponding to 4%.Discussion
As expected based on differences in metabolic rate, observed changes in the glutamate signal upon ingestion of deuterate glucose were larger in gray matter than in white matter. These changes were compared to that of the concentration of NAA, a dominant component of the 1H spectrum of the human brain which is not expected to turn over on this timescale5. These measurements illustrate the potential for temporal and spatial mapping of neural glucose metabolism in vivo in human beings on standard MR hardware. An important point to consider when assessing the utility of this novel technique is the signal to noise ratio (SNR) comparison between qMRS, qCSI and deuterium metabolic imaging (DMI). When averaging several voxels, the SNR from our 1H MRS sequences is approximately 30-35 for qMRS and approximately 25-30 for qCSI. These values are reported by LC model and correspond to the NAA resonance, which is the largest component of the 1H MRS spectrum in the brain following water and lipid suppression. It is worth noting that the concentration of NAA in the brain is comparable to the natural abundance of deuterium in water, approximately 10mM. A recently published work on DMI reports a peak height SNR of the natural abundance water resonance of 95.9 ± 10.9 at 7T for a voxel of 8mL acquired for 29.5 minutes6. While a comparison between different techniques is difficult to make rigorously, it is clear that a proton signal based qMRS or qCSI sequences acquired for an equivalent amount of time and volume would yield SNR more than sufficient for quantification of most metabolites.Conclusions
These findings demonstrate the feasibility of performing 1H MRSI in conjunction with deuterium labeling to perform spatially and temporally resolved measurements of neural metabolism. In addition to glutamate, qMRS enables tracking of other important metabolites including glutamine, GABA, and lactate.Acknowledgements
The authors would like to thank Damodar Reddy for his assitance with handling and coordination of human subjects.References
[1] Rich LJ, Bagga P, Wilson NE, Schnall MD, Detra JA, Haris M, Reddy. (2020) 1H magnetic resonance spectroscopy of 2H-to-1H exchange quantifies the dynamics of cellular metabolism in vivo. Nature Biomedical Engineering 4, 335-342.
[2] De Feyter HM, Behar KL, Corbin ZA, Fulbright RK, Brown PB, McIntyre S, Nixon TW, Rothman DL, de Graaf RA. (2018) Deuterium metabolic imaging (DMI) for MRI-based 3D mapping of metabolism in vivo. Science advances. 4(8), eaat7314
[3] Scheenen TWJ, Klomp DWJ, Wijnen JP, Heerschap A. (2008) Short echo time 1H‐MRSI of the human brain at 3T with minimal chemical shift displacement errors using adiabatic refocusing pulses. Magnetic Resonance in Medicine. 59 (1), 1-6.
[4] Bottomley, PA. (1984). Spatial Localization in NMR Spectroscopy in Vivo. Annals of the New York Academy of Sciences 508 (1), 333-348.
[5] Baslow MH. N-acetylaspartate in the vertebrate brain: Metabolism and function. Neurochem Res. 2003;28(6):941-953. doi:10.1023/A:1023250721185
[6] de Graaf RA, Hendriks AD, Klomp DWJ, et al. On the magnetic field dependence of deuterium metabolic imaging. NMR Biomed. 2020;33(3). doi:10.1002/nbm.4235
Figures