0343
Validation of dynamic Deuterium Metabolic Imaging (DMI) for the measurement of cerebral metabolic rates of glucose in rat.1Department of Radiology and Biomedical Imaging, Magnetic Resonance Research Center, Yale University, New Haven, CT, United States, 2Institute of Physical and Theoretical Chemistry, University of Bonn, Bonn, Germany, 3Department of Diagnostic and Interventional Radiology, RWTH Aachen, Aachen, Germany, 4Department of Psychiatry, Yale University, New Haven, CT, United States, 5Department of Biomedical Engineering, Yale University, New Haven, CT, United States
Synopsis
Deuterium metabolic imaging (DMI) is a novel metabolic imaging technique where 2H MRSI is combined with administration of 2H-labeled substrates. DMI data acquired at metabolic steady-state reveal the relative activities of metabolic pathways, whereas dynamically acquired DMI also provides the metabolic pathway activity rates. The analysis of dynamic DMI data is complicated by the presence of deuterium label loss between deuterated products and water. Here we validated metabolic rates obtained with dynamic DMI with those established using more traditional, 13C-based MR methods.
Introduction
Direct and indirect 13C MRS with infusion of 13C-labeled substrates are considered the gold standard for metabolic flux rate determination in vivo.1 However, 13C MRS(I) methods are technically highly demanding. The novel 2H-based methods, 2H MRS and 2H MRSI (or deuterium metabolic imaging, DMI), offer relatively high sensitivity and are technically much simpler than 13C-MRS(I) methods.2,3DMI has mostly been used to generate maps at metabolic steady-state.3,4 To allow for absolute quantification of metabolism, DMI needs to be performed within the dynamic time span of 2H-labeling. In the literature, only two 2H-based studies focused on absolute metabolic rate quantification by dynamic 2H-MRS(I), in healthy rat brain, without spatial localization, and in mouse lymphoma using dynamic DMI.2,5
Here, we acquired dynamic DMI data during infusion of [6,6’-2H2]-glucose to capture the kinetics of 2H-labeling in a brain volume containing gray and white matter, in healthy rats. The metabolic flux rates of glucose consumption (CMRgl) and the tricarboxylic acid (TCA) cycle (Vtca) were determined using a modified mathematical model that integrates label loss of 2H, an aspect that is not a concern in 13C-based metabolic studies. For validation, the flux rates were also determined based on Proton-observed, Carbon-edited (POCE) MRSI, a sensitive 1H-[13C] detection method,1 within a similar brain volume, during infusion of [1-13C]-glucose.
Methods
Animal experiments were performed on an 11.7T magnet (Magnex Scientific Ltd., Yarnton, UK) interfaced to an Avance III HD spectrometer running on ParaVision 6 (Bruker, Billerica, MA, USA), using previously described RF coil setups.3,6,7 2H-MRSI spectra were obtained by a spin-echo sequence (TR/TE=800/8ms, SW=5kHz). Spatial localization was achieved by a frequency-selective Shinnar-Le-Roux excitation pulse and phase encoding with a resolution of 6x3x6mm3. POCE spectra were acquired (TR/TE=4000/21 ms, SW=10kHz) as previously described.6 Spatial localization was achieved by LASER 3D volume selection and phase-encoding following the 13C-inversion pulse, with a resolution of 6x1.5x6mm3.Fischer344 rats were anaesthetized with isoflurane (1.5%) in 30/70% O2/N2O applied through a nose cone, and body temperature maintained at ~37°C. Catheters were placed in the femoral artery for blood sampling and blood pressure monitoring, and in the femoral vein for the bolus-continuous infusion of [6,6’-2H2]-glucose (n=2) or [1-13C]-glucose (n=4) over 120 min, while acquiring DMI or POCE data. Rats were then euthanized by focused beam microwave irradiation to stop brain metabolism immediately.8 Metabolite extraction from cortical and subcortical tissue, and plasma sample preparation were performed as previously described.3,9
High resolution scans were performed on a 500 MHz Bruker Avance III spectrometer. 1H NMR spectra of plasma were collected using pulse-acquire sequences (TR=15s) with water presaturation, and for detection of 2H-labeled lactate combined with 2H WALTZ decoupling. High resolution spectra of brain extracts were obtained using a POCE sequence with water presaturation and adiabatic 13C broadband decoupling (TR/TE=15s/7.9ms).
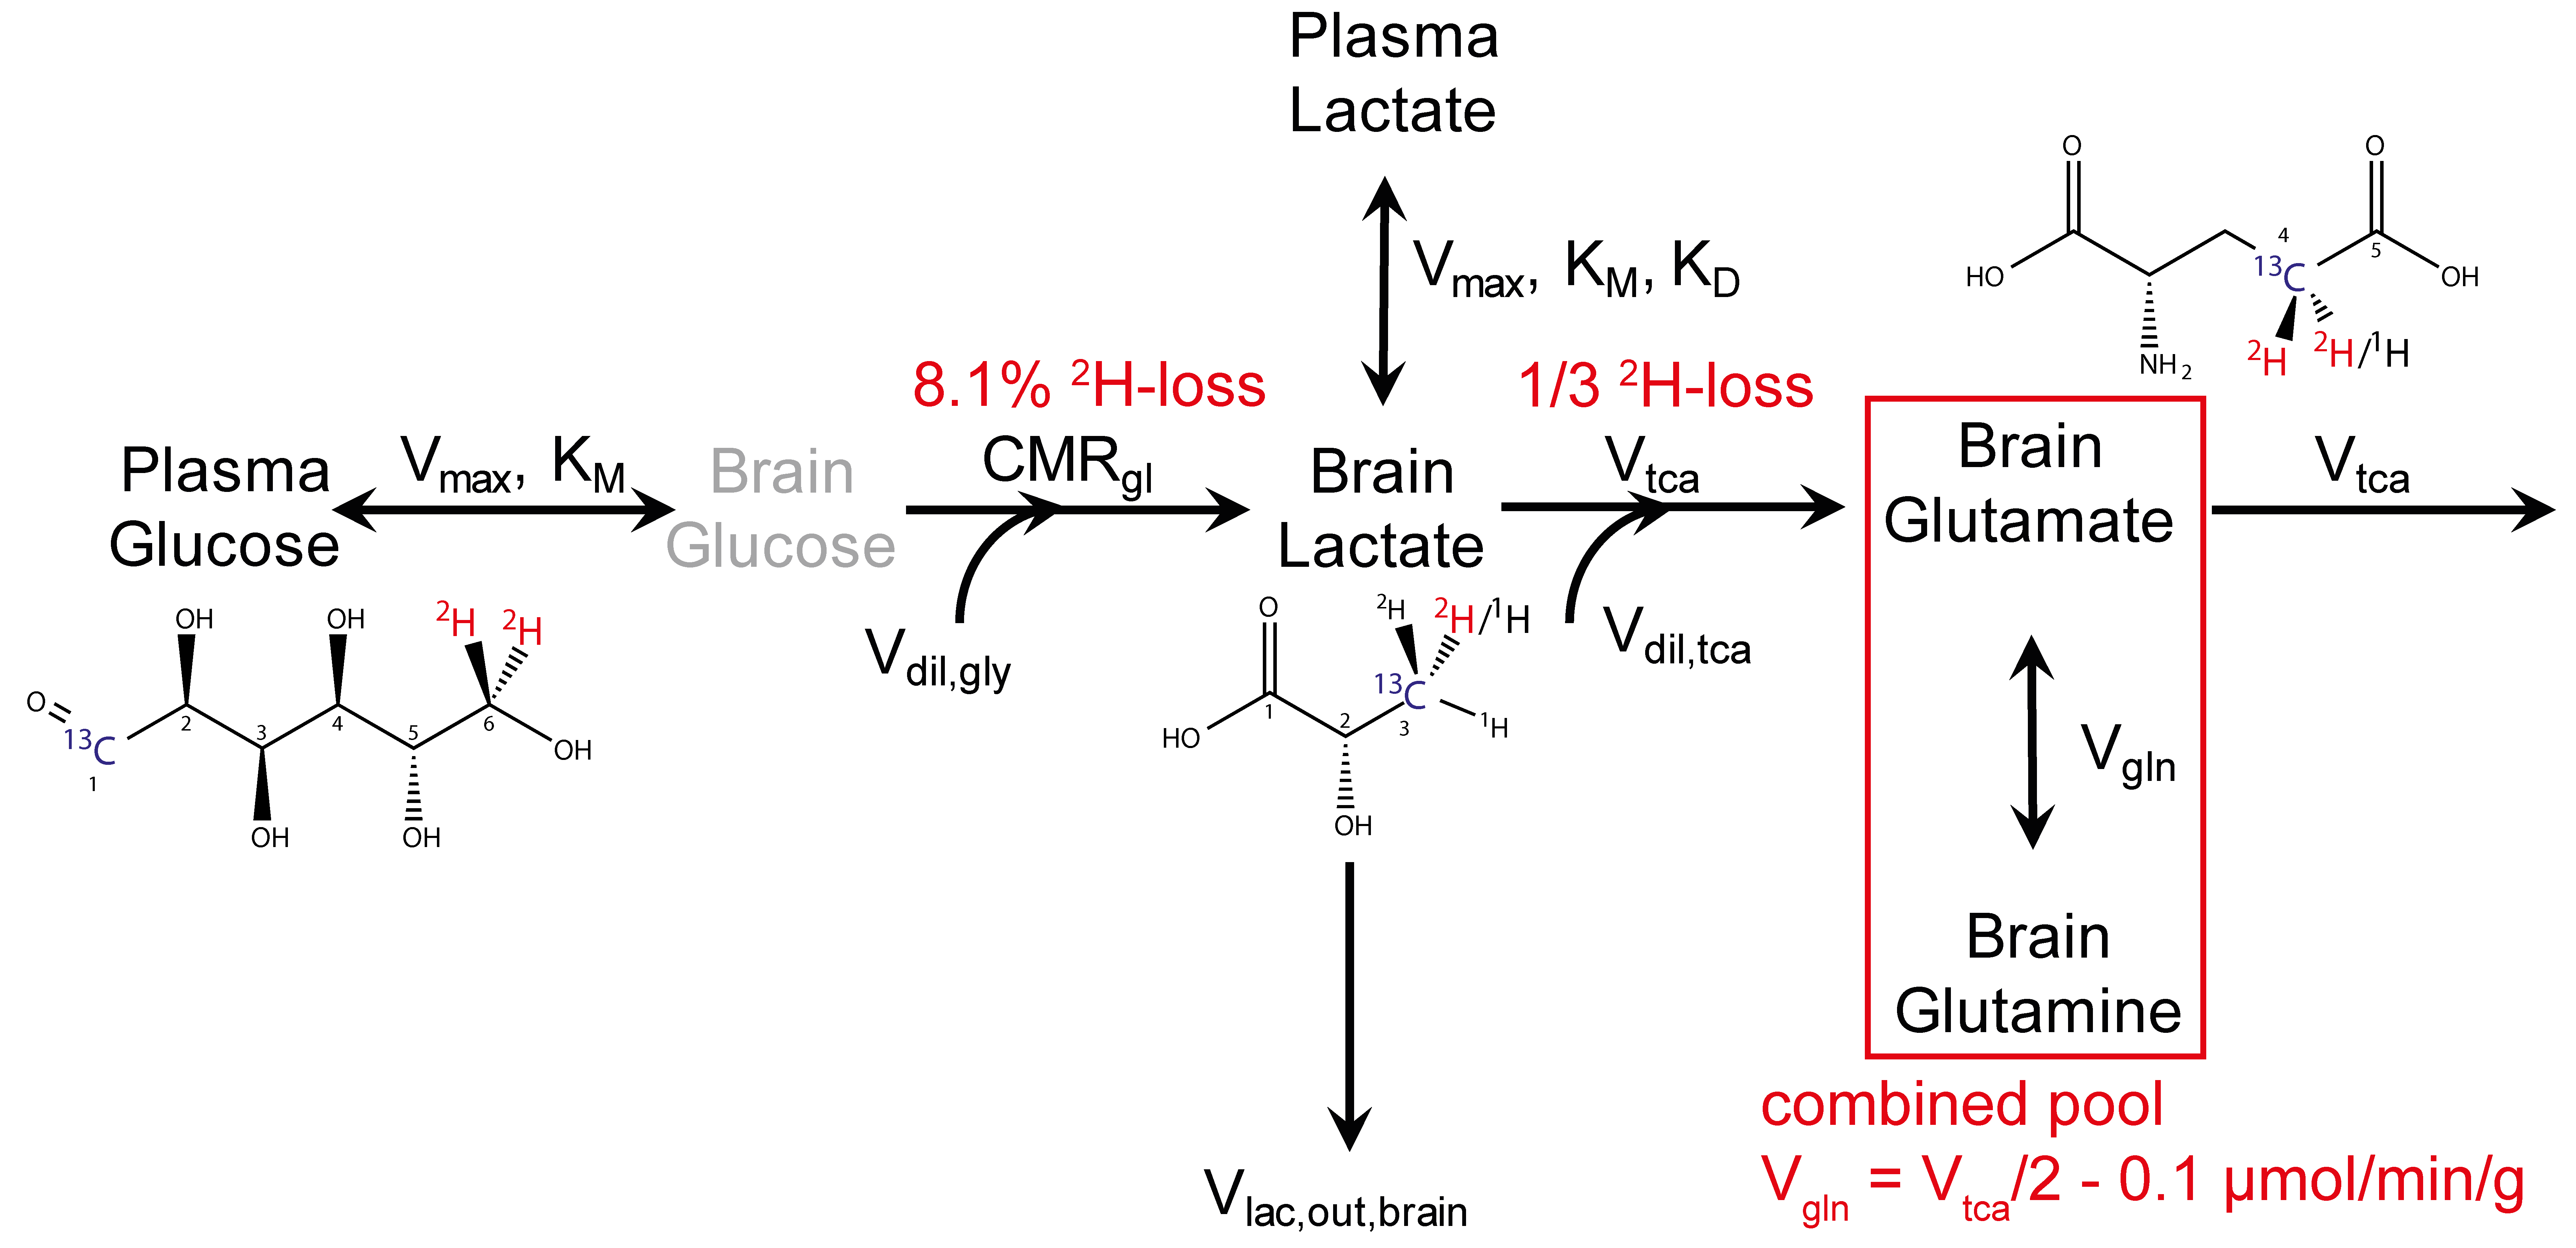
For absolute quantification of CMRgl and Vtca from 13C and 2H kinetics, a mathematical model (Fig. 1) was developed using in-house written software (CWave).10 To consider aspects of 2H-labeling, we treated glutamate and glutamine as a combined pool (Glx), connected via Vgln= Vtca/2-0.1 µmol/min/g.11 We also applied correction factors for a previously described 8.1% 2H-label loss during glycolysis and label loss of 1/3 at the citrate synthase.3
Results
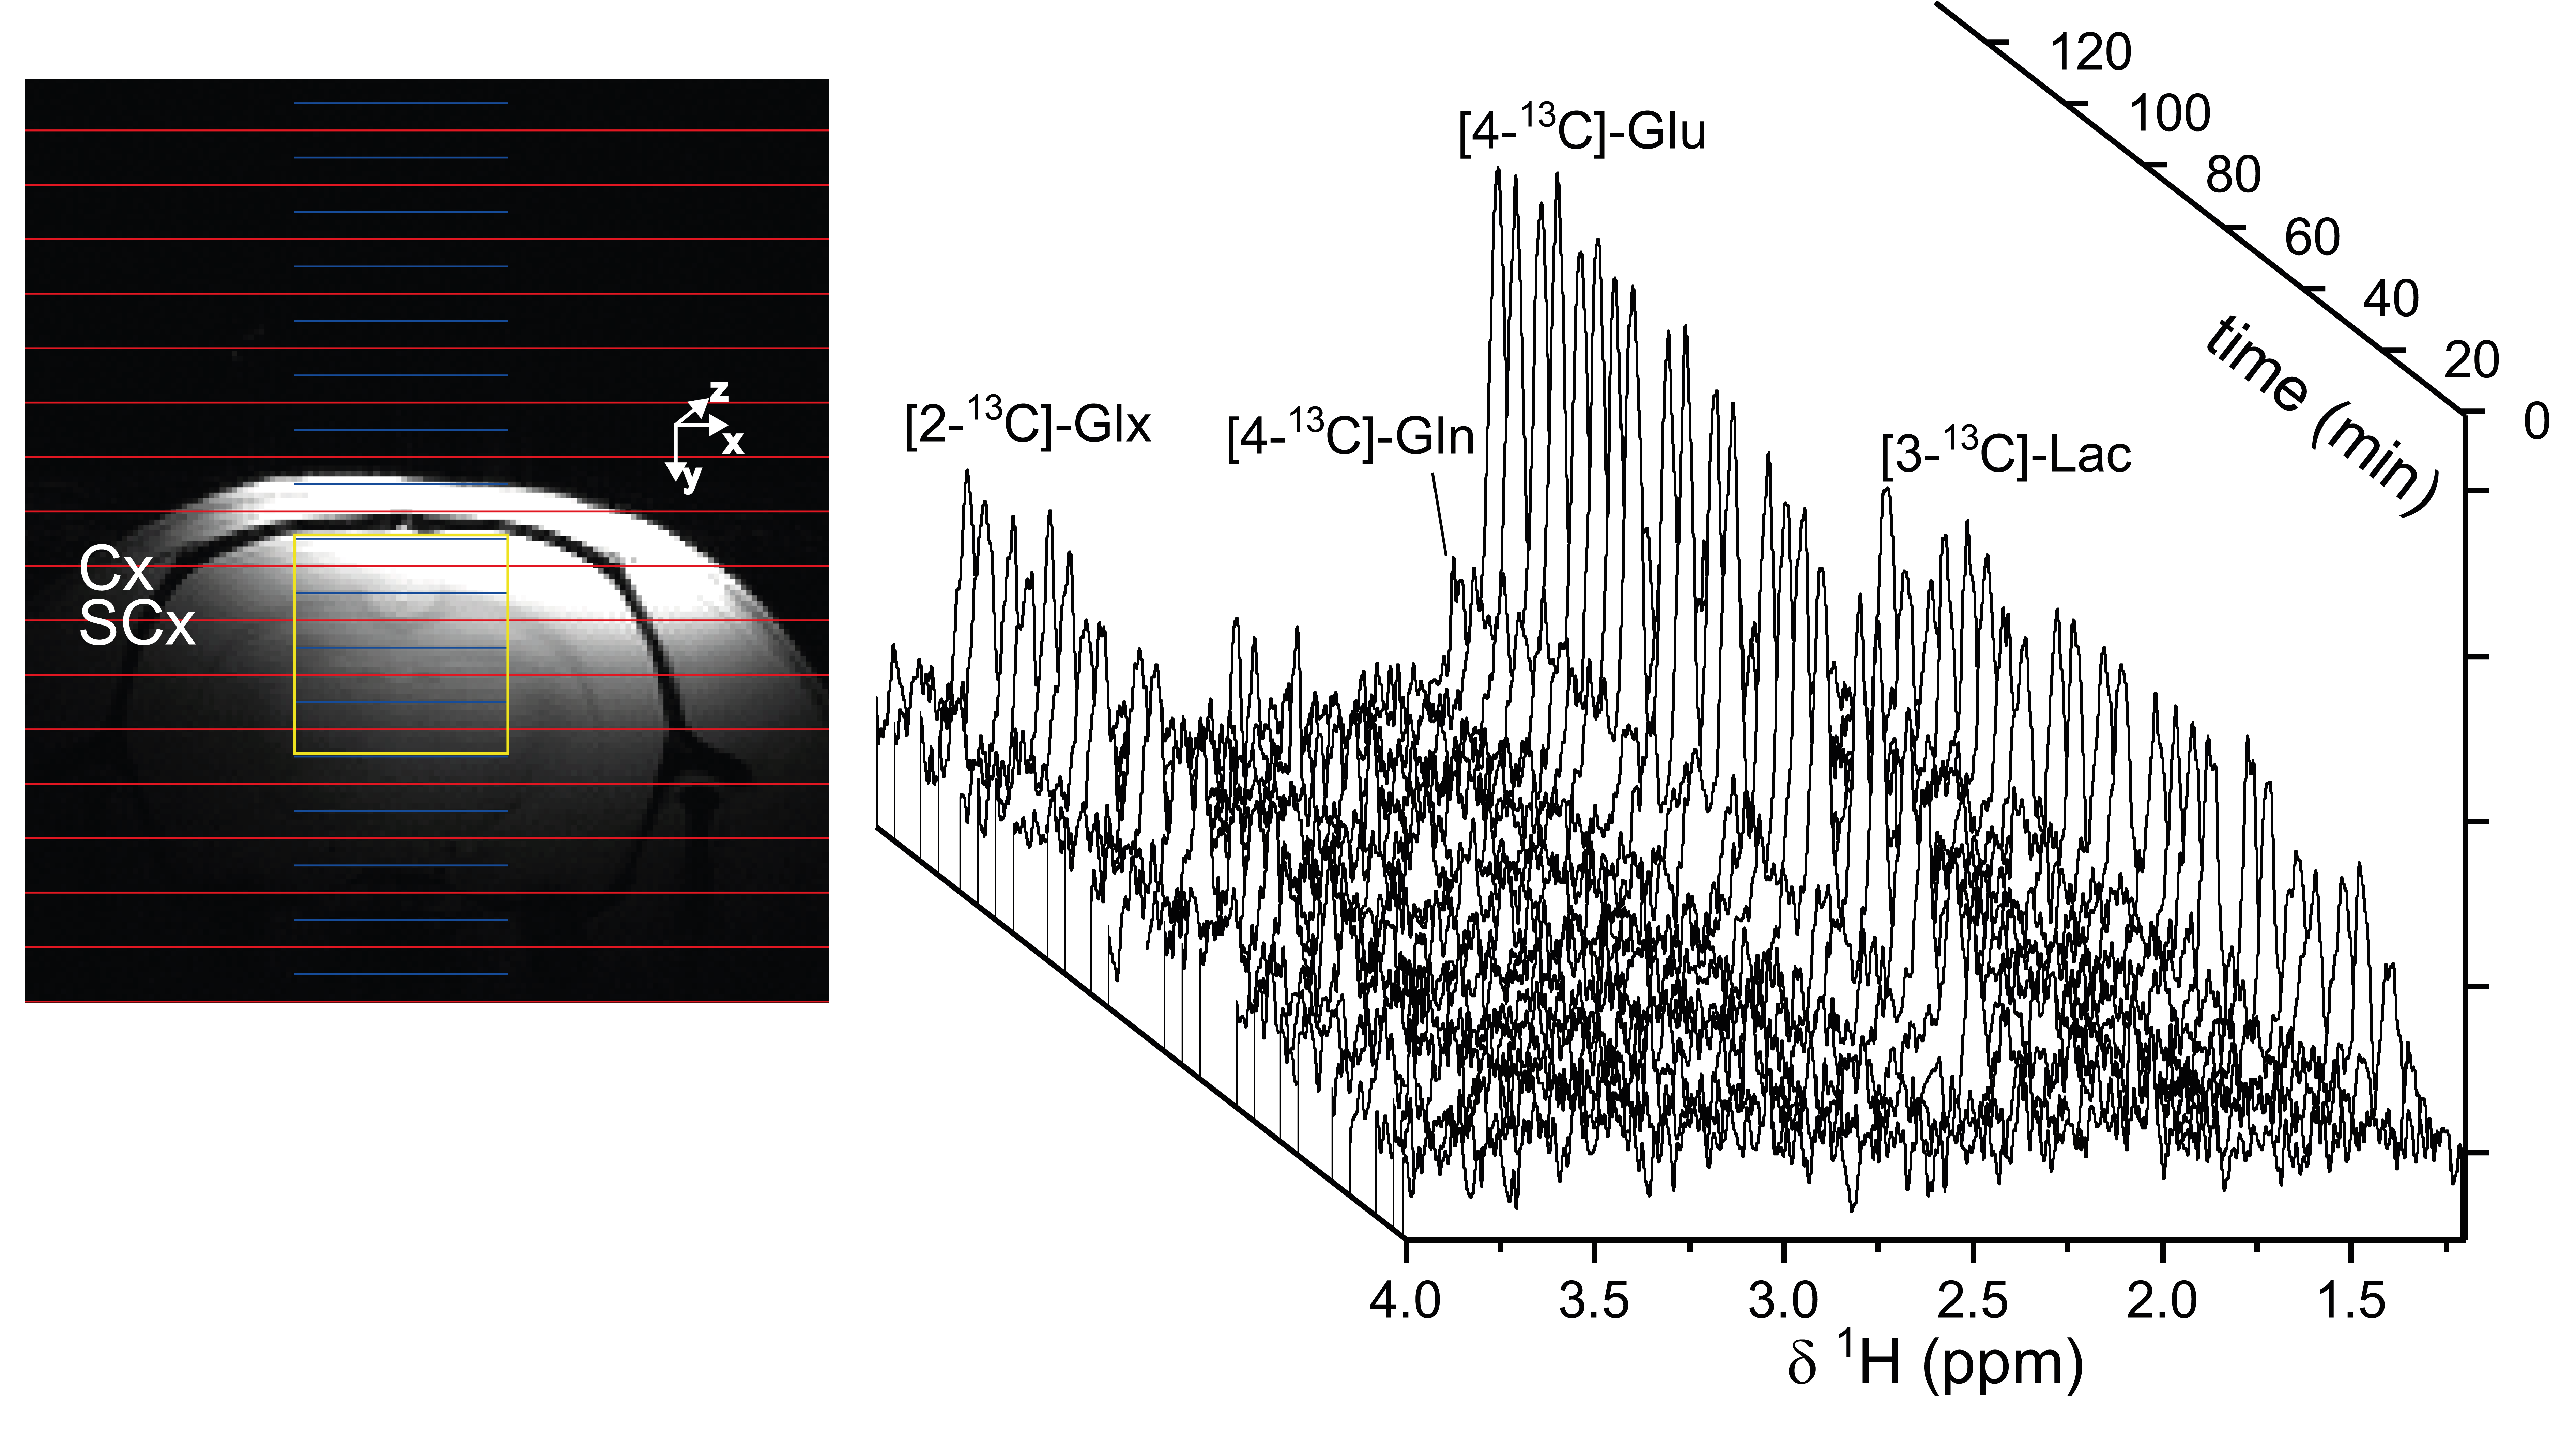
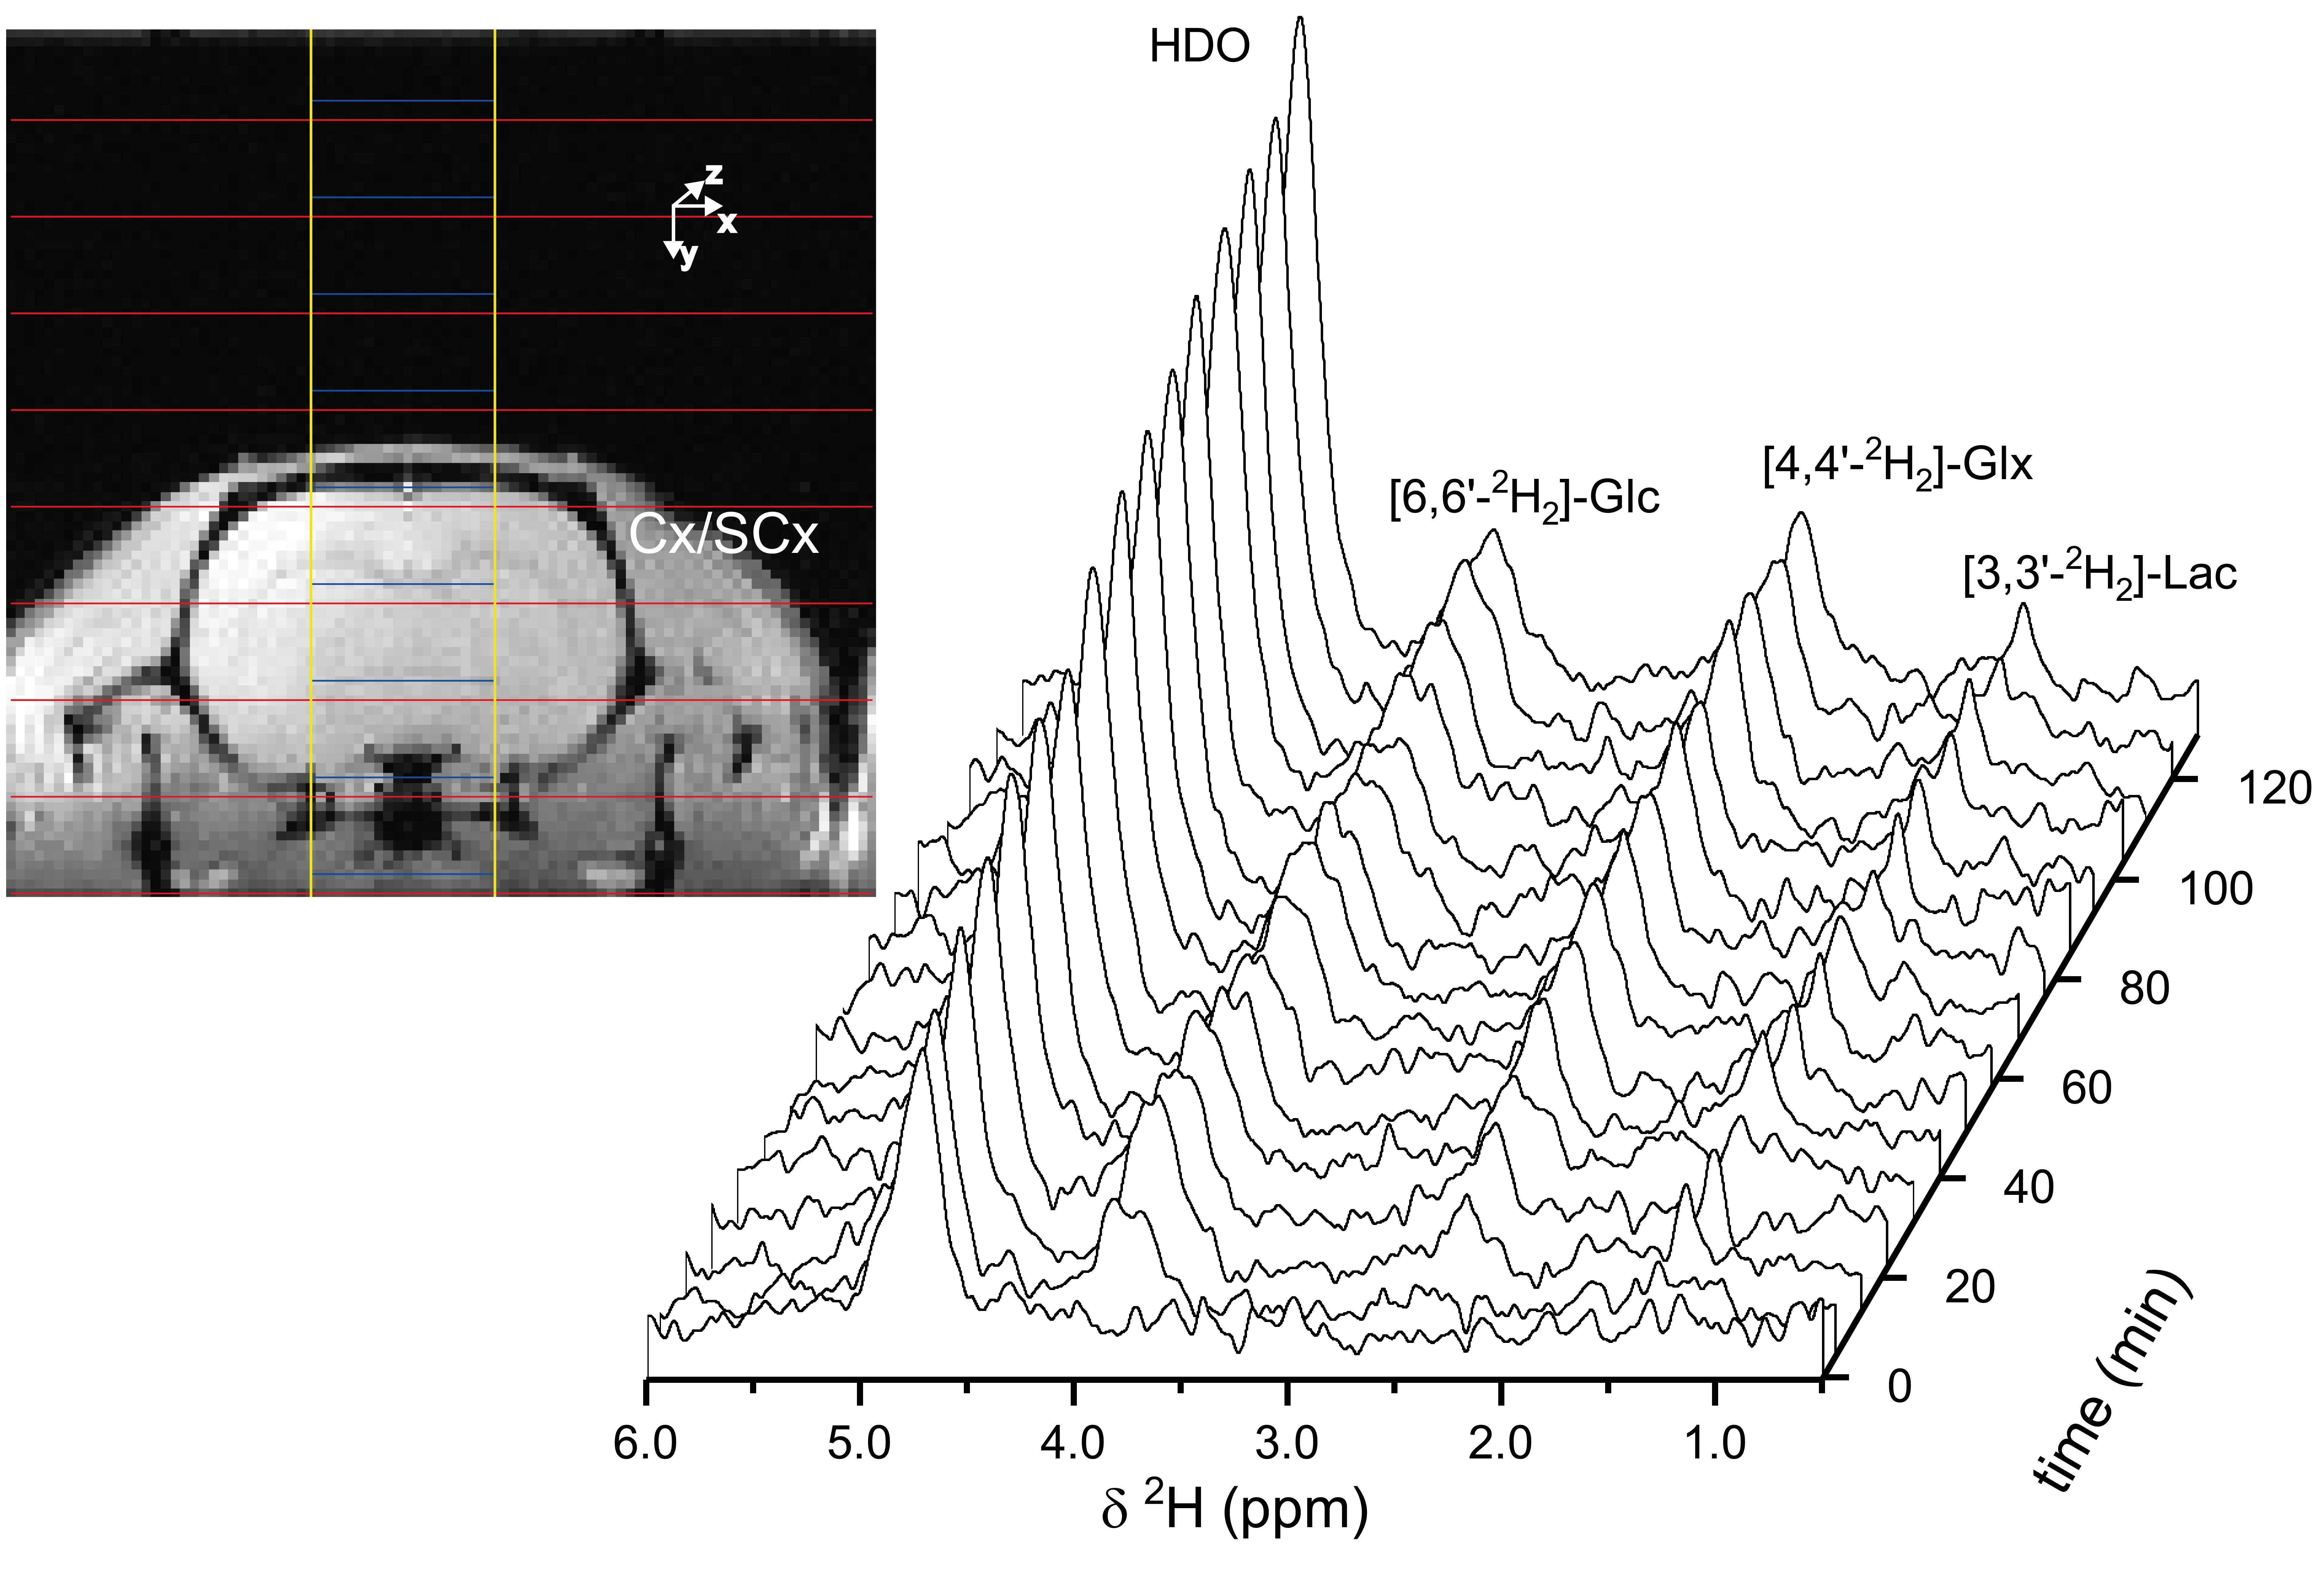
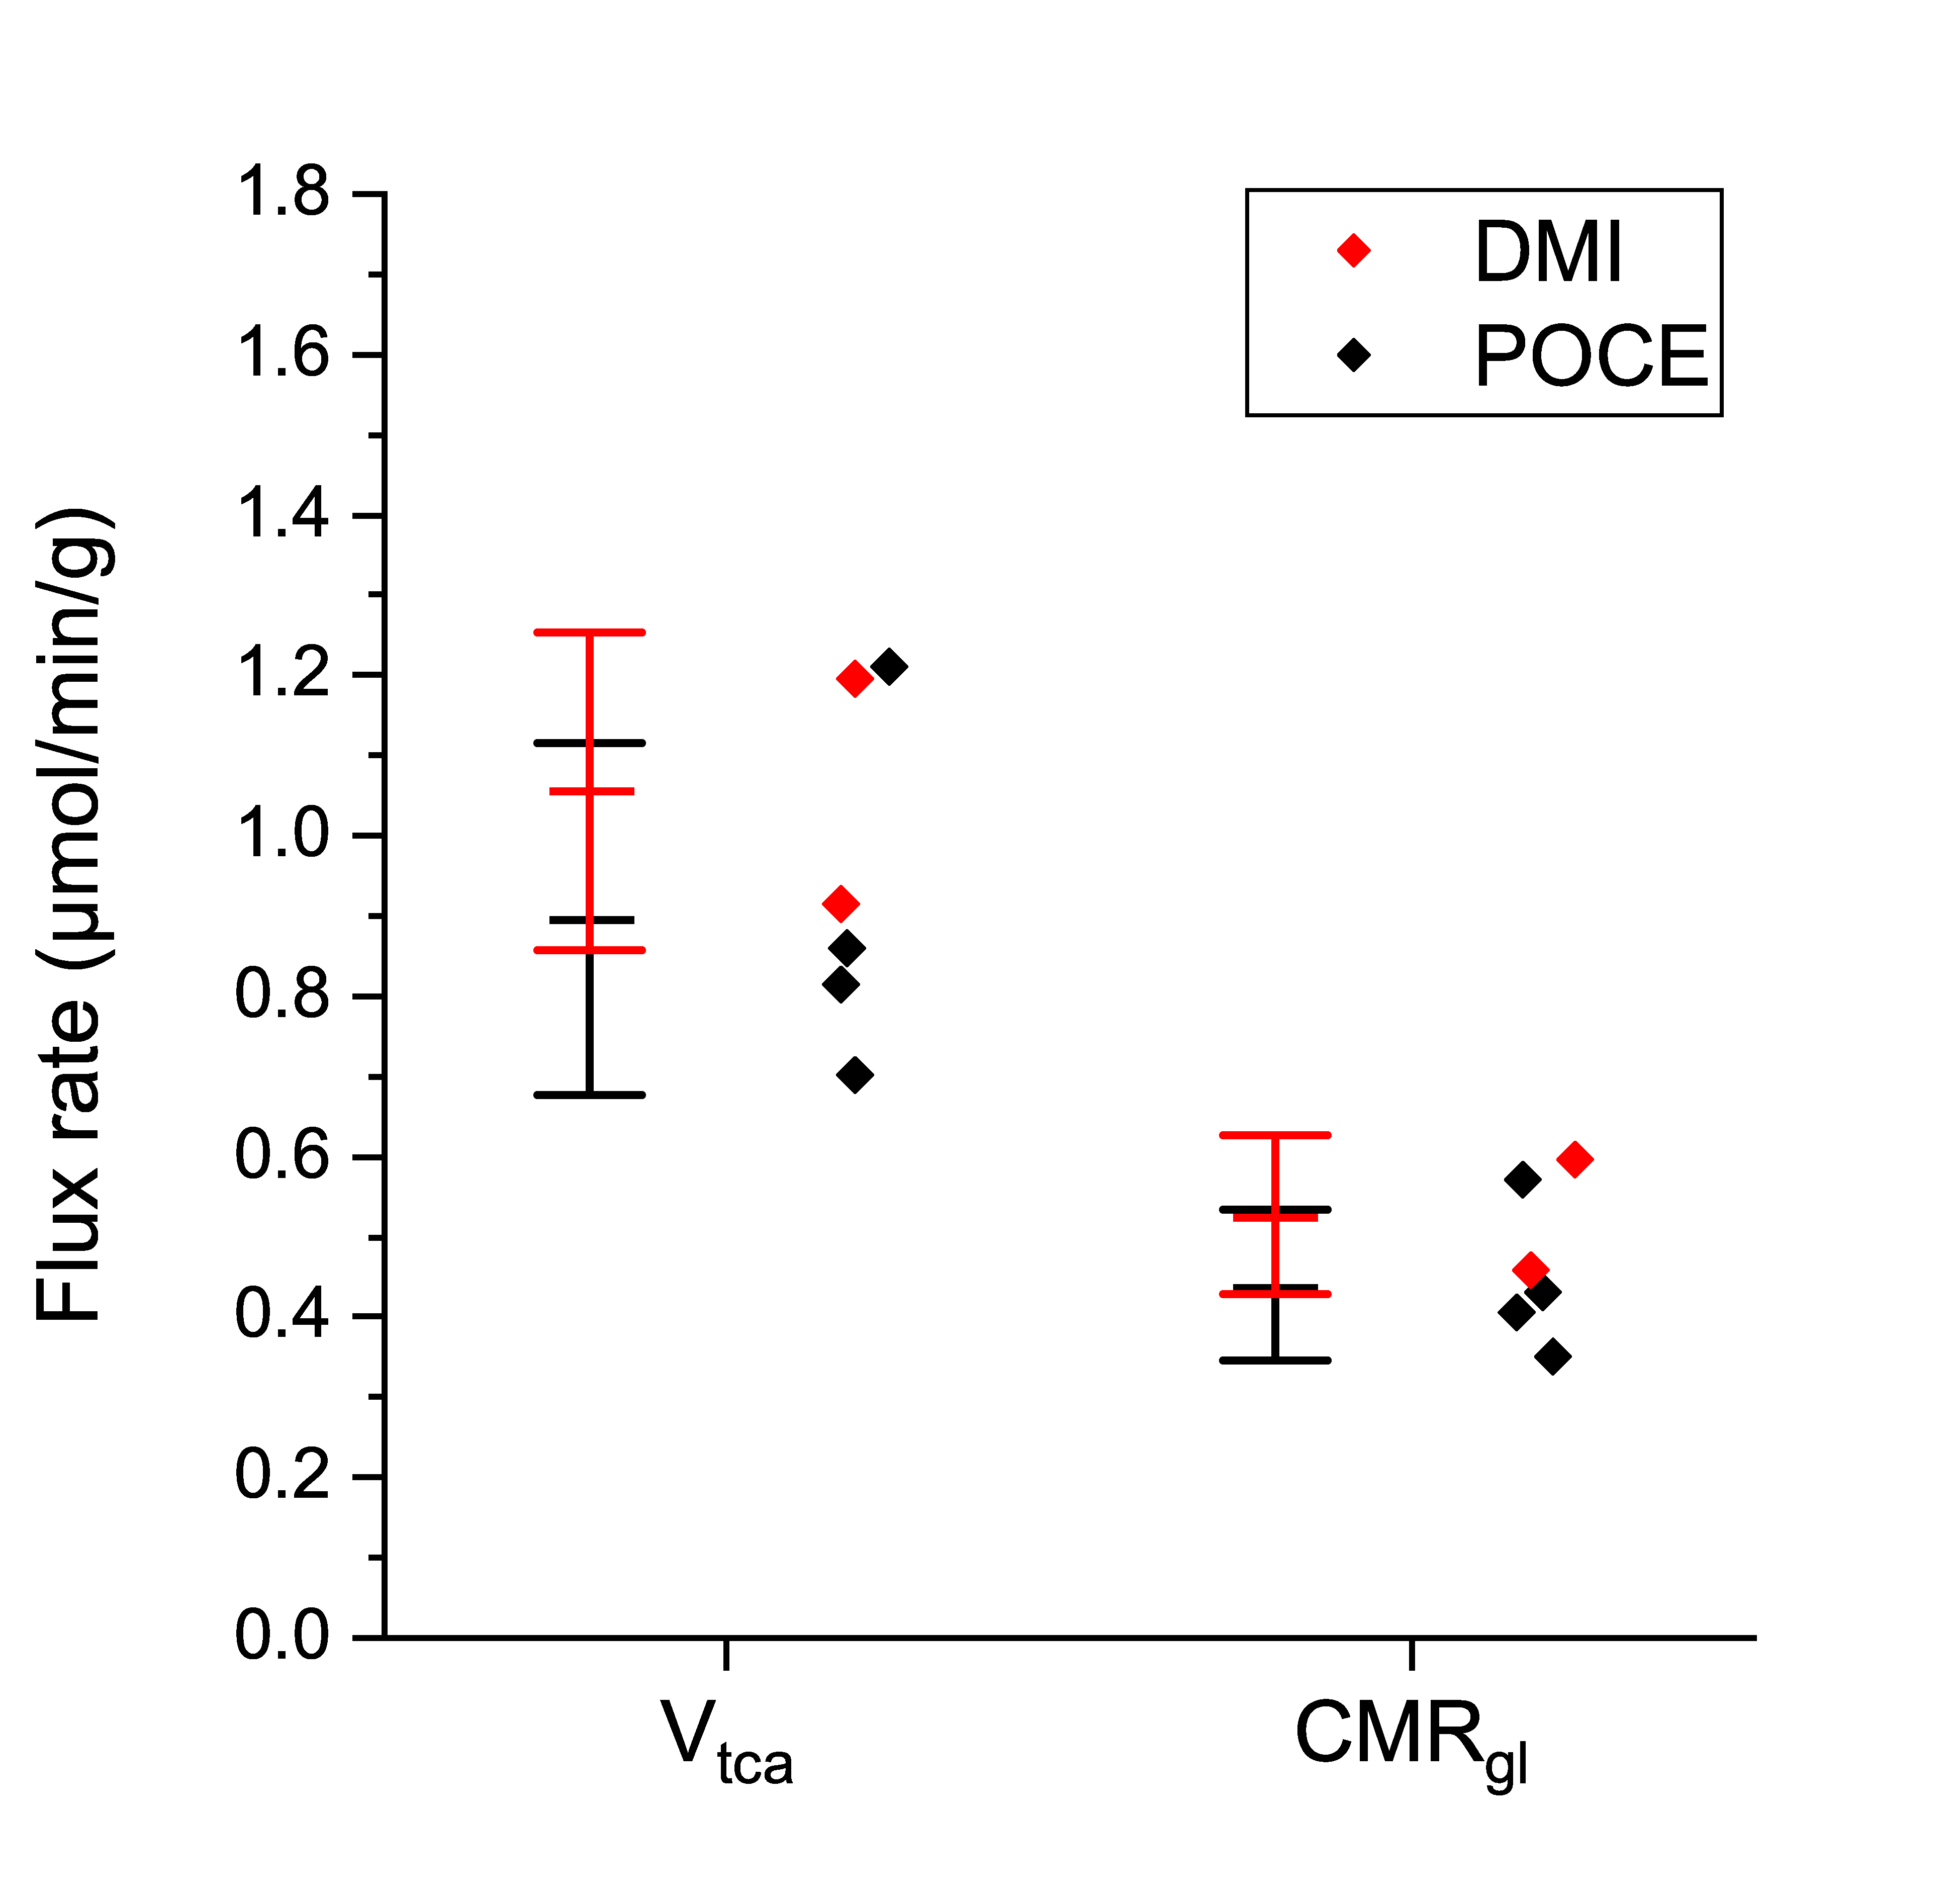
Figure 2 shows the time course of 1H-[13C] difference spectra of a subcortical volume acquired with a 4.5min time resolution, and the spatial localization of the brain volume during the infusion of [1-13C]-glucose. The time course shows the fastest turnover for [3-13C]-lactate, followed by [4-13C]-glutamate, [4-13C]-glutamine, [3-13C]-Glx and [2-13C]-Glx. Fig. 3 shows the corresponding time course of 2H-MRS spectra with a time resolution of 8min localized within a brain volume comprising cortical and subcortical areas. Compared to the POCE-experiments the size of the brain volume needed to be doubled to achieve comparable SNR. Natural abundance HDO was the only signal visible prior to infusion of [6,6’-2H2]-glucose and doubled over the entire infusion duration. In contrast to [1-13C]-glucose, [6,6’-2H2]-glucose was easily detectable, rose quickly, and remained stable until the end of the experiment. It was followed by [3-2H]-lactate and [4-2H]-Glx. Compared to POCE, only position 4 became labeled because of 2H-label loss in the TCA cycle downstream of Glx.12Spectral-fitted and normalized time courses of individual metabolites, plasma data of glucose/lactate, and total pool sizes obtained from brain extracts were used as input for the model. To compare the flux rates determined by DMI within a brain volume comprising cortical and subcortical areas, with those determined by POCE separately in a cortex and a subcortex volume, the POCE rates were averaged. Metabolic modeling of the DMI data resulted in CMRgl and Vtca of 0.53±0.10 µmol/min/g and 1.06±0.20 µmol/min/g, respectively, and agreed with those determined by POCE, 0.44±0.09 µmol/min/g and 0.90±0.22 µmol/min/g, as presented in Fig. 4.
Discussion and Conclusion
Dynamic DMI during [6,6’-2H2]-glucose infusion has been shown to provide spatially localized metabolic flux rates of glucose metabolism when combined with a modified metabolic model accounting for 2H-label loss, and a combined glutamate+glutamine pool, in healthy brain. The flux rates were successfully validated by comparison with dynamic POCE data using similar spatial localization. After extending to a larger sample size, these data will form the basis for further use of dynamic DMI to quantitatively study metabolic disorders.Acknowledgements
The authors thank Xiaoxian Ma and Bei Wang for their assistance with animal preparation. This research was funded, in part by NIBIB R01-EB025840.References
(1) de Graaf, R. A. In vivo NMR spectroscopy:Principles and techniques, Third
edition; John Wiley & Sons, Inc, 2019. DOI: 10.1002/9781119382461' fill='%235dd95d'%3E%3Cpath d='M 9.249787330627441 17.17169380187988 L 4.762476921081543 12.68437480926514 L 7.214956283569336 10.23189544677734 L 9.015677452087402 12.03262424468994 L 9.369227409362793 12.38618469238281 L 9.722777366638184 12.03262424468994 L 16.32264709472656 5.432744979858398 L 18.65010833740234 7.760213375091553 L 9.249787330627441 17.17169380187988 Z' stroke='none'/%3E%3Cpath d='M 9.249578475952148 16.46436309814453 L 17.94319725036621 7.760422229766846 L 16.32264709472656 6.139865875244141 L 10.07633686065674 12.38618469238281 L 9.369227409362793 13.09329414367676 L 8.662117004394531 12.38618469238281 L 7.214955806732178 10.93901634216309 L 5.469596385955811 12.68437480926514 L 9.249578475952148 16.46436309814453 M 9.249997138977051 17.87900352478027 L 4.05537748336792 12.68437385559082 L 7.214957237243652 9.524794578552246 L 9.369227409362793 11.67907428741455 L 16.32264709472656 4.725644111633301 L 19.35699653625488 7.76000452041626 L 9.249997138977051 17.87900352478027 Z' stroke='none' fill='%23fff'/%3E%3C/g%3E%3C/svg%3E%0A "In Citavi anzeigen") .
.
(2) Lu, M.; Zhu, X.-H.; Zhang, Y.;
Mateescu, G.; Chen, W. Quantitative assessment of brain glucose metabolic
rates using in vivo deuterium magnetic resonance spectroscopy. Journal of cerebral blood flow and
metabolism : official journal of the International Society of Cerebral Blood
Flow and Metabolism 2017, 37 (11), 3518–3530. DOI:
10.1177/0271678X17706444'%3E%3Crect id='Rectangle_515' data-name='Rectangle 515' width='12.5' height='6.5' transform='translate(661 98)' fill='%23fff'/%3E%3Cpath id='Path_1430' data-name='Path 1430' d='M0,0,3.962,4H0Z' transform='translate(672.288 91)' fill='%23fff'/%3E%3Cg id='picto-support-e-books' transform='translate(661 91)'%3E%3Cg id='Group_699' data-name='Group 699' transform='translate(2.445 8.827)'%3E%3Cg id='Group_698' data-name='Group 698' transform='translate(2.625)'%3E%3Cpath id='Path_1267' data-name='Path 1267' d='M34.475,35.928V35.4H32.732V38.27h.647V37.114H34.4v-.529H33.379v-.657Z' transform='translate(-29.619 -35.373)' fill='%23d52b1e'/%3E%3Cpath id='Path_1268' data-name='Path 1268' d='M22.32,35.615a1.829,1.829,0,0,0-1.168-.307,5.693,5.693,0,0,0-.871.06V38.19a5.482,5.482,0,0,0,.732.043,2.036,2.036,0,0,0,1.315-.37A1.462,1.462,0,0,0,22.8,36.7,1.28,1.28,0,0,0,22.32,35.615Zm-1.168,2.111a1.18,1.18,0,0,1-.224-.013V35.832a1.315,1.315,0,0,1,.293-.025.821.821,0,0,1,.9.912A.888.888,0,0,1,21.152,37.726Z' transform='translate(-20.281 -35.308)' fill='%23d52b1e'/%3E%3C/g%3E%3Cpath id='Path_1269' data-name='Path 1269' d='M11.521,35.539a1.36,1.36,0,0,0-.87-.23,5.138,5.138,0,0,0-.871.06v2.836h.638V37.177a1.66,1.66,0,0,0,.22.013,1.311,1.311,0,0,0,.926-.3.923.923,0,0,0,.262-.683A.841.841,0,0,0,11.521,35.539Zm-.888,1.152a1.075,1.075,0,0,1-.216-.016v-.849a1.064,1.064,0,0,1,.266-.026c.323,0,.5.158.5.422C11.187,36.516,10.976,36.691,10.633,36.691Z' transform='translate(-9.78 -35.309)' fill='%23d52b1e'/%3E%3C/g%3E%3Cpath id='Path_1270' data-name='Path 1270' d='M15.228,3.552,11.686.027V0H4.53l-1.345,0v7.02H0v6.529H3.185V16H15.247l0-12.448Zm-3.6,9.252H.744V7.776H11.626Zm.061-9.252V.991L14.26,3.552Z' fill='%23d52b1e'/%3E%3C/g%3E%3C/g%3E%3Cg id='Path_1429' data-name='Path 1429' transform='translate(21.445 -2.124)' fill='%235dd95d'%3E%3Cpath d='M 9.249787330627441 17.17169380187988 L 4.762476921081543 12.68437480926514 L 7.214956283569336 10.23189544677734 L 9.015677452087402 12.03262424468994 L 9.369227409362793 12.38618469238281 L 9.722777366638184 12.03262424468994 L 16.32264709472656 5.432744979858398 L 18.65010833740234 7.760213375091553 L 9.249787330627441 17.17169380187988 Z' stroke='none'/%3E%3Cpath d='M 9.249578475952148 16.46436309814453 L 17.94319725036621 7.760422229766846 L 16.32264709472656 6.139865875244141 L 10.07633686065674 12.38618469238281 L 9.369227409362793 13.09329414367676 L 8.662117004394531 12.38618469238281 L 7.214955806732178 10.93901634216309 L 5.469596385955811 12.68437480926514 L 9.249578475952148 16.46436309814453 M 9.249997138977051 17.87900352478027 L 4.05537748336792 12.68437385559082 L 7.214957237243652 9.524794578552246 L 9.369227409362793 11.67907428741455 L 16.32264709472656 4.725644111633301 L 19.35699653625488 7.76000452041626 L 9.249997138977051 17.87900352478027 Z' stroke='none' fill='%23fff'/%3E%3C/g%3E%3C/svg%3E%0A "In Citavi anzeigen") .
.
(3) De Feyter, H. M.; Behar, K.
L.; Corbin, Z. A.; Fulbright, R. K.; Brown, P. B.; McIntyre, S.; Nixon, T. W.;
Rothman, D. L.; de Graaf, R. A. Deuterium metabolic imaging (DMI) for
MRI-based 3D mapping of metabolism in vivo. Science advances 2018, 4 (8), eaat7314. DOI:
10.1126/sciadv.aat7314.
(4) Riis-Vestergaard, M. J.;
Laustsen, C.; Mariager, C. Ø.; Schulte, R. F.; Pedersen, S. B.; Richelsen, B.
Glucose metabolism in brown adipose tissue determined by deuterium metabolic
imaging in rats. Int J Obes 2020, 1–11. DOI:
10.1038/s41366-020-0533-7.
(5) Kreis, F.; Wright, A. J.;
Hesse, F.; Fala, M.; Hu, D.-E.; Brindle, K. M. Measuring Tumor Glycolytic Flux
in Vivo by Using Fast Deuterium MRI. Radiology
2020, 294 (2), 289–296. DOI: 10.1148/radiol.2019191242.
(6) de Graaf, R. A.; Rothman, D.
L.; Behar, K. L. State of the art direct 13C and indirect 1H-13C NMR
spectroscopy in vivo. A practical guide. NMR in biomedicine 2011,
24 (8), 958–972. DOI:
10.1002/nbm.1761.
(7) Adriany, G.; Gruetter, R. A
half-volume coil for efficient proton decoupling in humans at 4 tesla. Journal of Magnetic Resonance 1997, 125 (1), 178–184. DOI: 10.1006/jmre.1997.1113.
(8) de Graaf, R. A.; Chowdhury, G.
M. I.; Brown, P. B.; Rothman, D. L.; Behar, K. L. In situ 3D magnetic
resonance metabolic imaging of microwave-irradiated rodent brain: a new tool
for metabolomics research. Journal
of Neurochemistry 2009, 109 (2), 494–501. DOI:
10.1111/j.1471-4159.2009.05967.x.
(9) De Feyter, H. M.; Behar, K.
L.; Rao, J. U.; Madden-Hennessey, K.; Ip, K. L.; Hyder, F.; Drewes, L. R.;
Geschwind, J.-F.; de Graaf, R. A.; Rothman, D. L. A ketogenic diet increases
transport and oxidation of ketone bodies in RG2 and 9L gliomas without
affecting tumor growth. Neuro Oncol
2016, 18 (8), 1079–1087. DOI: 10.1093/neuonc/now088.
(10) Mason, G. F.; Falk Petersen,
K.; de Graaf, R. A.; Kanamatsu, T.; Otsuki, T.; Rothman, D. L. A comparison of
13C NMR measurements of the rates of glutamine synthesis and the tricarboxylic
acid cycle during oral and intravenous administration of [1-13C]glucose. Brain Research Protocols 2003, 10 (3), 181–190. DOI: 10.1016/S1385-299X(02)00217-9.
(11) Sibson, N. R.; Dhankhar, A.;
Mason, G. F.; Rothman, D. L.; Behar, K. L.; Shulman, R. G. Stoichiometric
coupling of brain glucose metabolism and glutamatergic neuronal activity. Proceedings of the National Academy of
Sciences of the United States of America 1998, 95 (1), 316–321.
DOI: 10.1073/pnas.95.1.316.
(12) de Graaf, R. A.; Thomas, M.
A.; Behar, K. L.; De Feyter, H. M. Characterization of kinetic isotope effects
and label loss in deuterium-based isotopic labeling studies. ACS Chemical Neuroscience 2020, In Press. DOI:
10.1021/acschemneuro.0c00711.
Figures