0340
In Vivo Measurement of 13C Labeling of Glutamate and Glutamine in the Human Brain Using 1H MRS
Li An1, Shizhe Li1, Maria Ferraris Araneta1, Milalynn Victorino1, Christopher Johnson1, and Jun Shen1
1National Institute of Mental Health, National Institutes of Health, Bethesda, MD, United States
1National Institute of Mental Health, National Institutes of Health, Bethesda, MD, United States
Synopsis
A recently developed single-step spectral editing 1H MRS technique that induces intense Glu and Gln H4 singlets at TE = 56 ms was used to measure fractional enrichments of glutamate and glutamine in the dorsal anterior cingulate cortex (dACC) of five healthy volunteers after oral administration of [U-13C]glucose. This technique offers the ability to measure glutamate neurotransmission in the human brain with the high sensitivity and spatial resolution of 1H MRS using standard commercial equipment.
INTRODUCTION
Noninvasive in vivo detection of 13C labeling of glutamate (Glu) and glutamine (Gln) is a powerful tool for investigating Glu and Gln metabolism and neurotransmission in the brain 1. Attempts have been made to circumvent the hardware limitation of 13C MRS by measuring the changes in short TE 1H MRS spectra caused by incorporation of 13C labels into brain amino acids 2. However, it has been difficult to reliably separate Glu and Gln in the crowded 1H MRS spectra, especially after the incorporation of 13C labels. Quantification of 13C labeling of both Glu and Gln using 1H MRS in the human brain has not been reported. In this work, we demonstrate the feasibility of measuring 13C fractional enrichments of Glu and Gln at 7 T using a recently published single-step spectral editing 1H MRS pulse sequence, which induces intense Glu and Gln H4 singlets at TE = 56 ms using an always-on editing pulse at 2.12 ppm 3.METHODS
Five healthy volunteers were scanned on a Siemens Magnetom 7 T scanner equipped with a 32-channel receiver head coil. In each scan session, the subject was first scanned to acquire the pre-13C MRS data from a 3.5 × 1.8 × 2 cm3 voxel in the dorsal anterior cingulate cortex (dACC) of the brain. Subsequently, the subject exited from the scanner and was orally administered 20% w/w 99% enriched [U-13C]glucose solution at a dosage of 0.75 g [U-13C]glucose per kg of body weight. After a rest period, the subject reentered the scanner. Post-13C MRS data were repeatedly acquired from the same voxel as the pre-13C scan. The pre-13C MRS data were processed first and the process was similar to that described previously 3. Using an in-house developed fitting program, the reconstructed pre-13C spectrum was fitted in the range of 1.8 – 3.4 ppm by linear combination of numerically computed basis spectra of acetate (Ace), N-acetyl-aspartate (NAA), N-acetylaspartylglutamate (NAAG), γ-aminobutyric acid (GABA), Glu, Gln, glutathione (GSH), aspartate (Asp), total creatine (tCr), total choline (tCho), taurine (Tau), myo-inositol (mI), and scyllo-inositol (sI), as well as a cubic spline baseline with 13 knots. After the metabolite concentrations in arbitrary unit were obtained from the fitting, we computed the metabolite ratios, which were defined as the concentration of a metabolite divided by the sum of concentration of tCr and three times the concentration of tCho ([tCr]+3[tCho]), which weighs approximately equally the intensities of the tCr and tCho singlet peaks.The post-13C spectra were reconstructed in the same way as the pre-13C spectrum. Additional basis spectra of 13C satellites of Glu H4, Gln H4 and Asp H3 were simulated for the subsequent fitting process. When fitting each post-13C spectrum, the metabolites ratios (/ [tCr]+3[tCho]) of Ace, NAA, NAAG, GABA, GSH, Asp, tCr, tCho, Tau, mI, and sI were fixed to the pre-13C values. The sum of metabolite ratios of Glu and its 13C satellites was constrained to be the same as the metabolite ratio of Glu obtained from the pre-13C spectrum. Similar constraints were also applied to Gln and Asp. After obtaining the metabolite concentrations from the fitting process, the 13C fractional enrichment of Glu H4 for a post-13C spectrum was computed as the ratio of the concentration of its 13C satellites to the total concentration of Glu. The fractional enrichment of Gln H4 was similarly computed.
RESULTS
Figure 1 shows the basis spectra of Glu, Gln, Asp, and their 13C satellites. The spectrum of [4,5-13C]Glu is highly similar to that of [4-13C]Glu because the spectral pattern is dominated by the large 1JHC. As both carbons of the acetyl CoA are 13C-labeled after administration of uniformly labeled glucose 4, [4,5-13C]Glu was chosen to represent the 13C satellite signals of Glu H4 in the fitting process. Similarly, [4,5-13C]Gln and [3,4-13C]Asp were chosen to represent the 13C satellite signals of Gln H4 and Asp H3, respectively. Figure 2 displays the time-course spectra of subject 1 and corresponding fitted spectra of Glu, Gln and their 13C satellites. The in vivo spectra and corresponding fits for the pre-13C MRS scan and the last post-13C scan of subject 1 are displayed in Figure 3. The plots of fractional enrichments of Glu H4 and Gln H4 vs. time after oral administration of [U-13C]glucose for all five subjects are displayed in Figure 4. Table 1 lists the metabolite ratios (/[tCr]) and end point fractional enrichments of Glu H4 and Gln H4 in the dACC of all five subjects.DISCUSSION AND CONCLUSION
We demonstrated the feasibility of using a proton-only single-step spectral editing sequence with TE = 56 ms to measure fractional enrichments of Glu and Gln in the dACC of healthy volunteers after oral administration of [U-13C]glucose. Compared to the existing indirect 1H-[13C] MRS techniques that use 1H and 13C surface coils, this 1H MRS technique can acquire MRS data from a voxel away from the neocortex using a standard 1H head coil. This technique offers the ability to measure glutamate neurotransmission in the human brain with the high sensitivity and spatial resolution of 1H MRS using standard commercial equipment. Brain regions inaccessible to surface coils can now be investigated using the technique described in this work.Acknowledgements
This work was supported by the intramural program of the NIH and NIMH.References
- Rothman DL, de Graaf RA, Hyder F, Mason GF, Behar KL, De Feyter HM. In vivo 13C and 1H-[13C] MRS studies of neuroenergetics and neurotransmitter cycling, applications to neurological and psychiatric disease and brain cancer. NMR Biomed 2019;32(10):e4172.
- Boumezbeur F, Besret L, Valette J, Vaufrey F, Henry PG, Slavov V, Giacomini E, Hantraye P, Bloch G, Lebon V. NMR measurement of brain oxidative metabolism in monkeys using C-13-labeled glucose without a C-13 radiofrequency channel. Magnetic Resonance in Medicine 2004;52(1):33-40.
- An L, Araneta MF, Victorino M, Shen J. Signal enhancement of glutamine and glutathione by single-step spectral editing. Journal of Magnetic Resonance 2020;316.
- Li SZ, Zhang Y, Araneta MF, Xiang Y, Johnson C, Innis RB, Shen J. In vivo detection of C-13 isotopomer turnover in the human brain by sequential infusion of C-13 labeled substrates. Journal of Magnetic Resonance 2012;218:16-21.
Figures
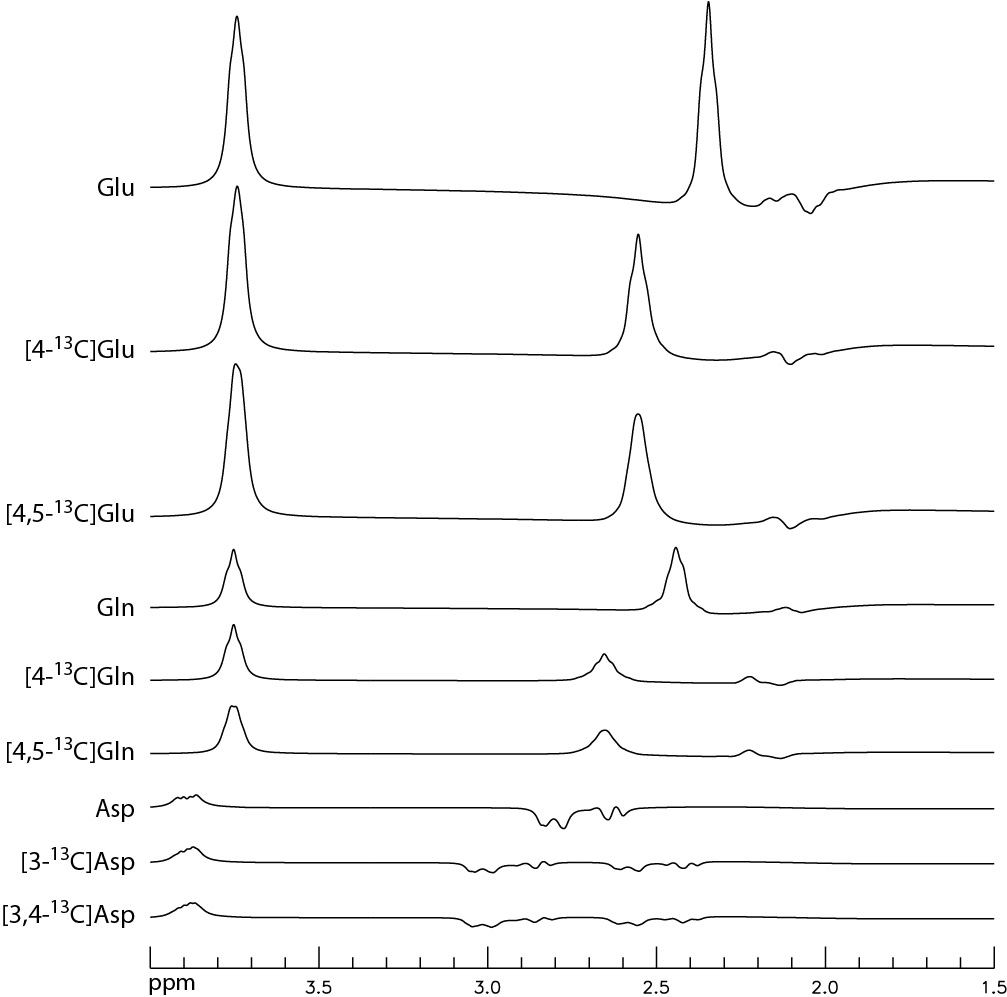
FIGURE 1 Numerically simulated spectra of Glu,
[4-13C]Glu, [4,5-13C]Glu, Gln, [4-13C]Gln,
[4,5-13C]Gln, Asp, [3-13C]Asp, and [3,4-13C]Asp
at TE = 56 ms with an editing pulse placed at 2.12 ppm. The corresponding
concentration ratios were set to 10: 10: 10: 3: 3: 3: 3: 3: 3. The spectra were
broadened to a singlet width of 8 Hz.
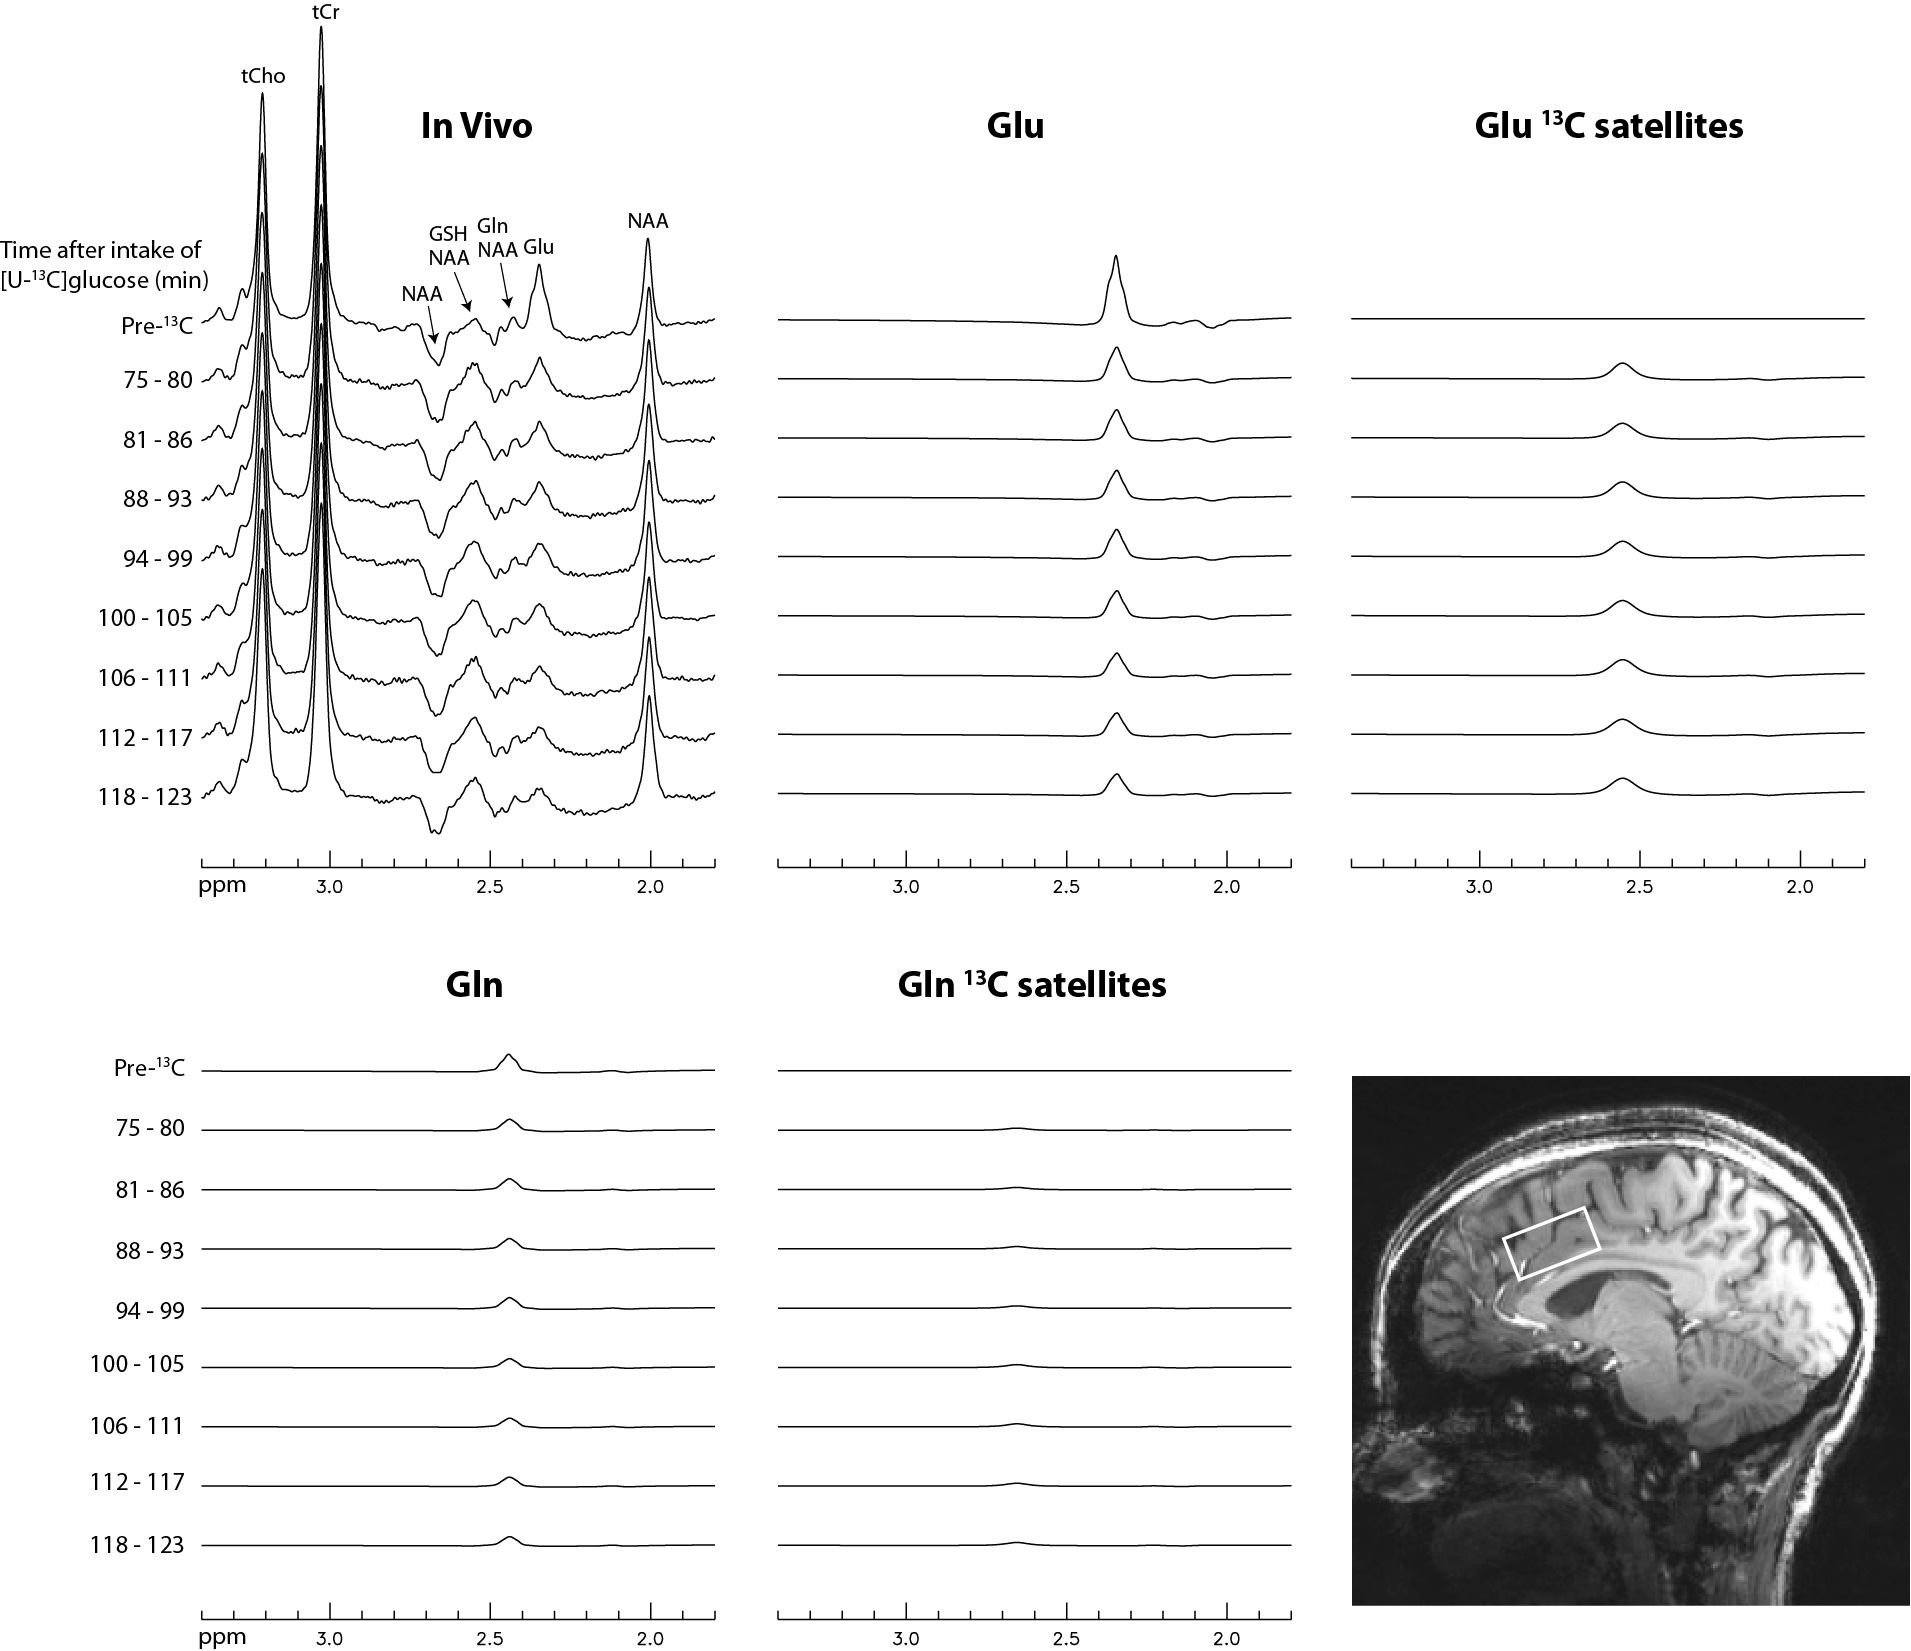
FIGURE 2 Time-course
spectra and corresponding fitted spectra of Glu, Gln, and their 13C
satellites acquired from the dACC of
subject 1. No linebroadening was applied to the spectra. Voxel size = 3.5 × 1.8 × 2 cm3; TR = 2.2 s; TE
= 56 ms; number of averages = 264 and total scan time = 10 min for the pre-13C
spectra; number of averages = 132 and total scan time = 5 min for each individual
post-13C
spectrum.
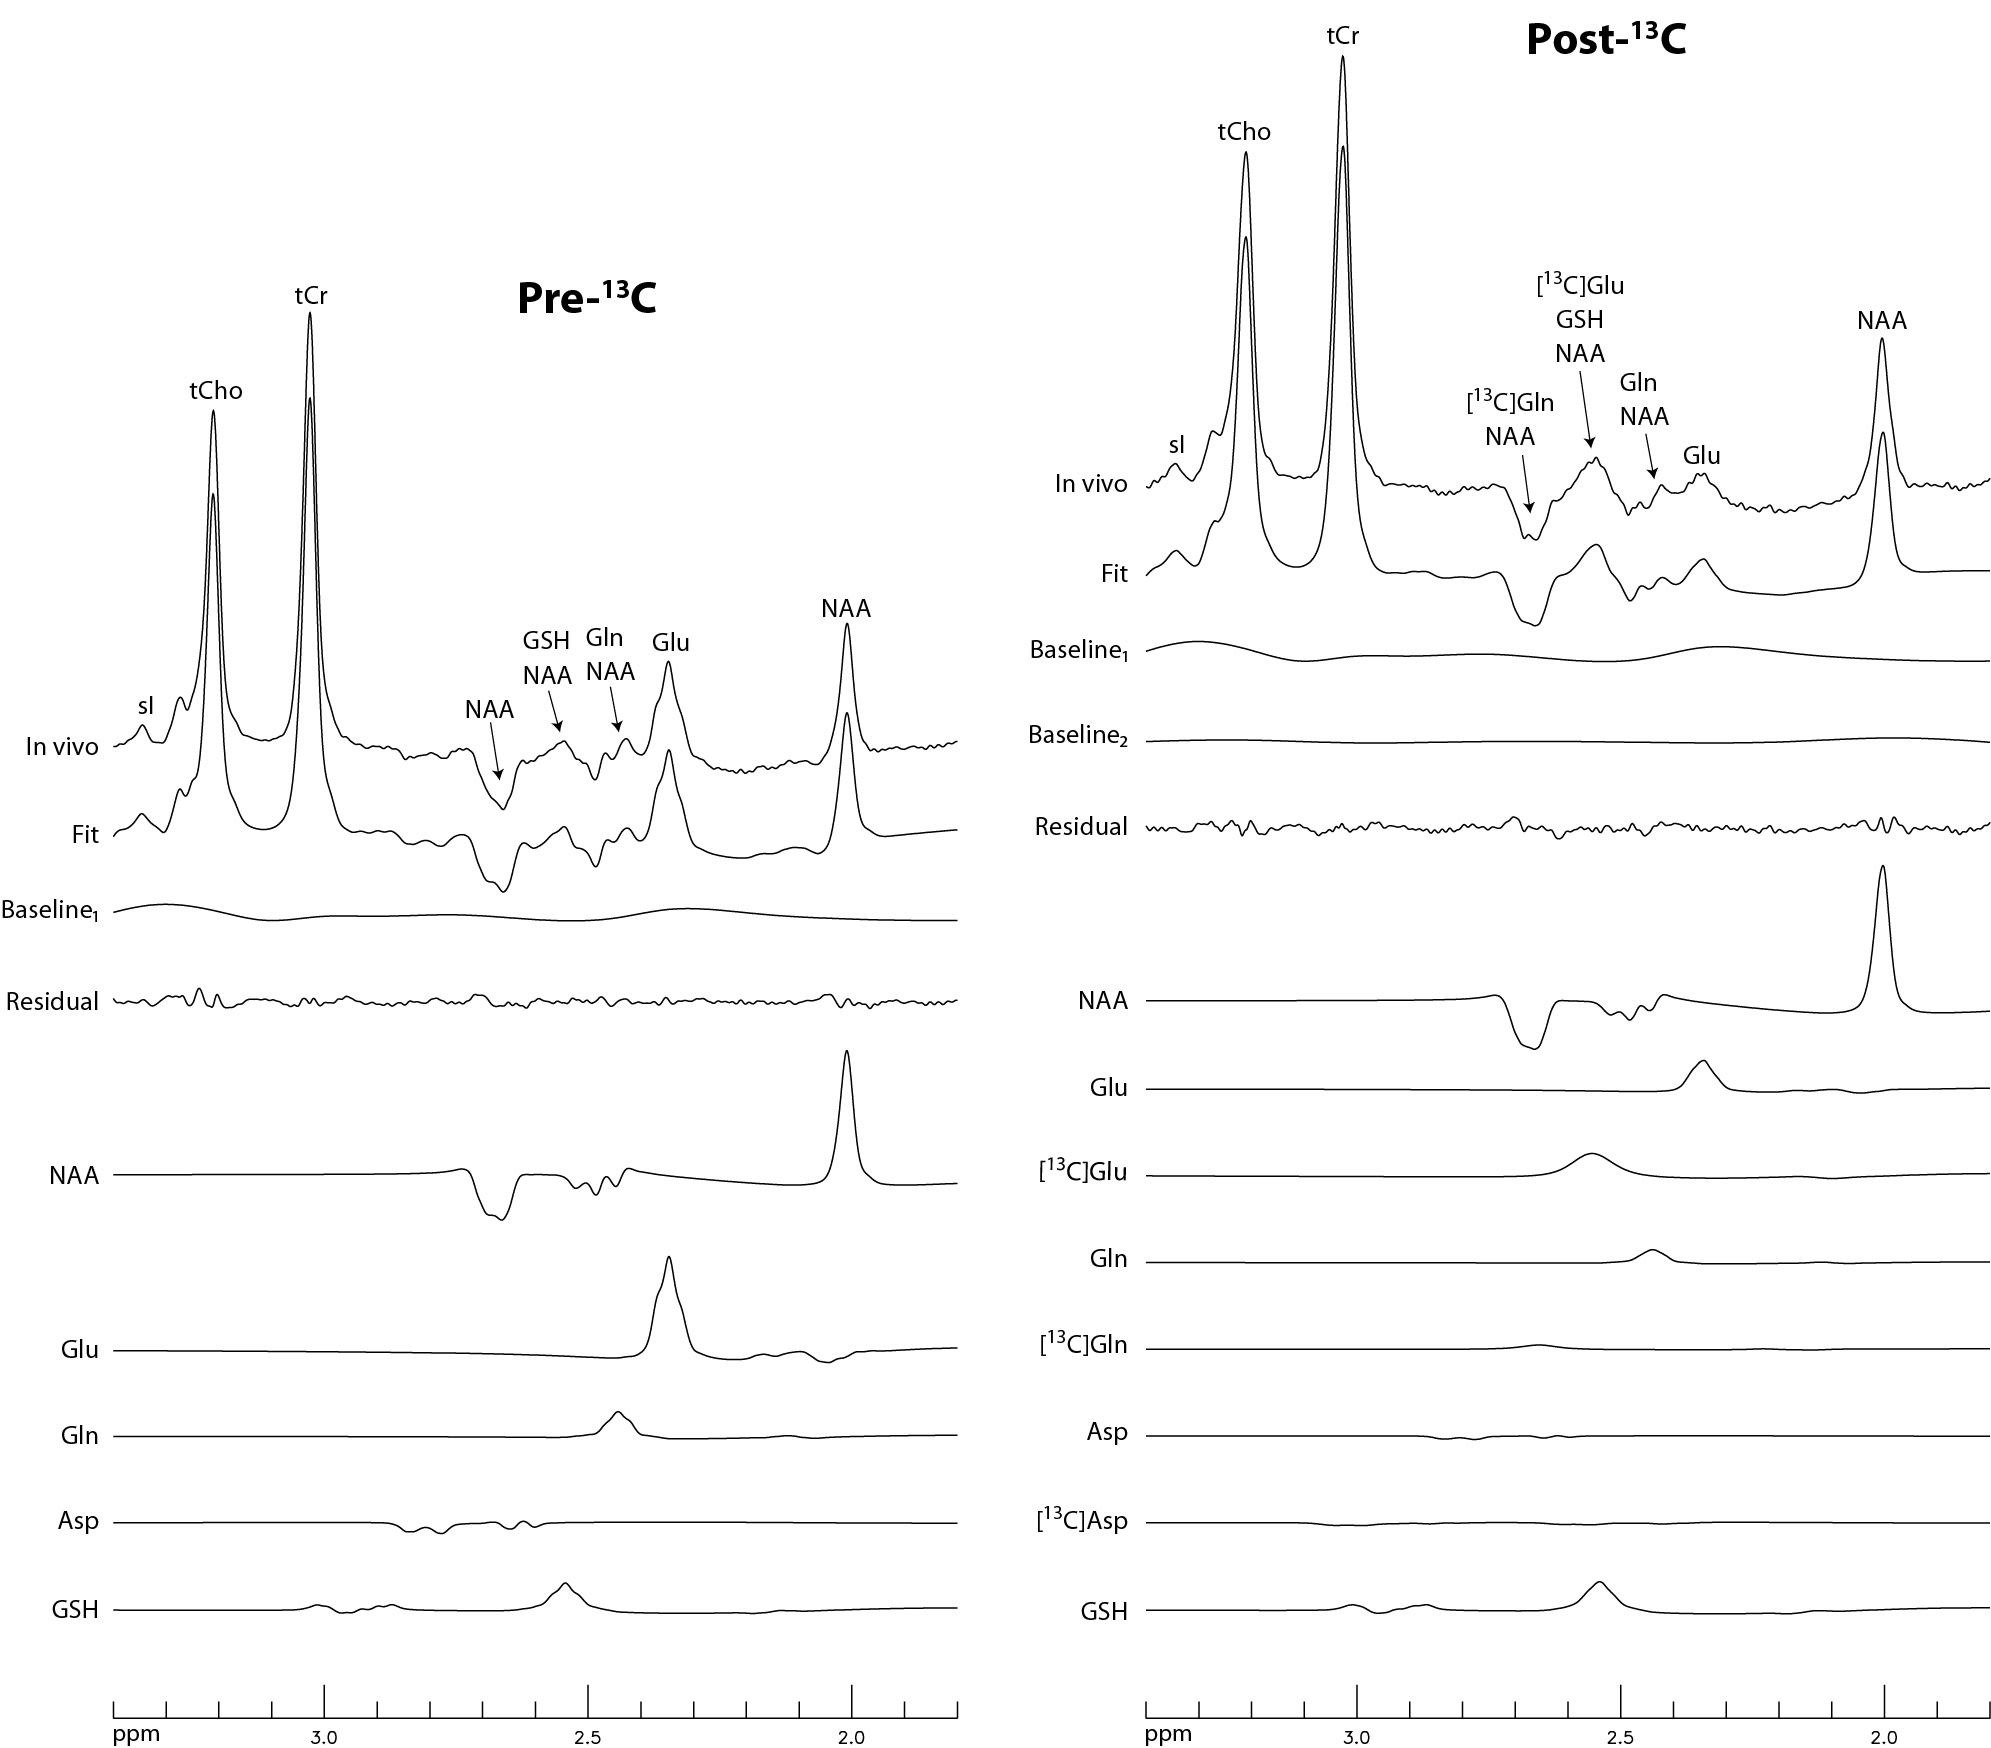
FIGURE 3 Spectra
and corresponding fits for the pre-13C MRS scan and the last post-13C
scan of subject 1. Due
to subject repositioning and B0 shimming, the pre-13C and post-13C spectra have
slightly different baselines. Baseline1 is the baseline in the pre-13C
spectrum, which is a spline baseline with 13 knots. The baseline in the post-13C
spectrum is baseline1 + baseline2, in which baseline2
is a much weaker spline baseline with 8 knots.
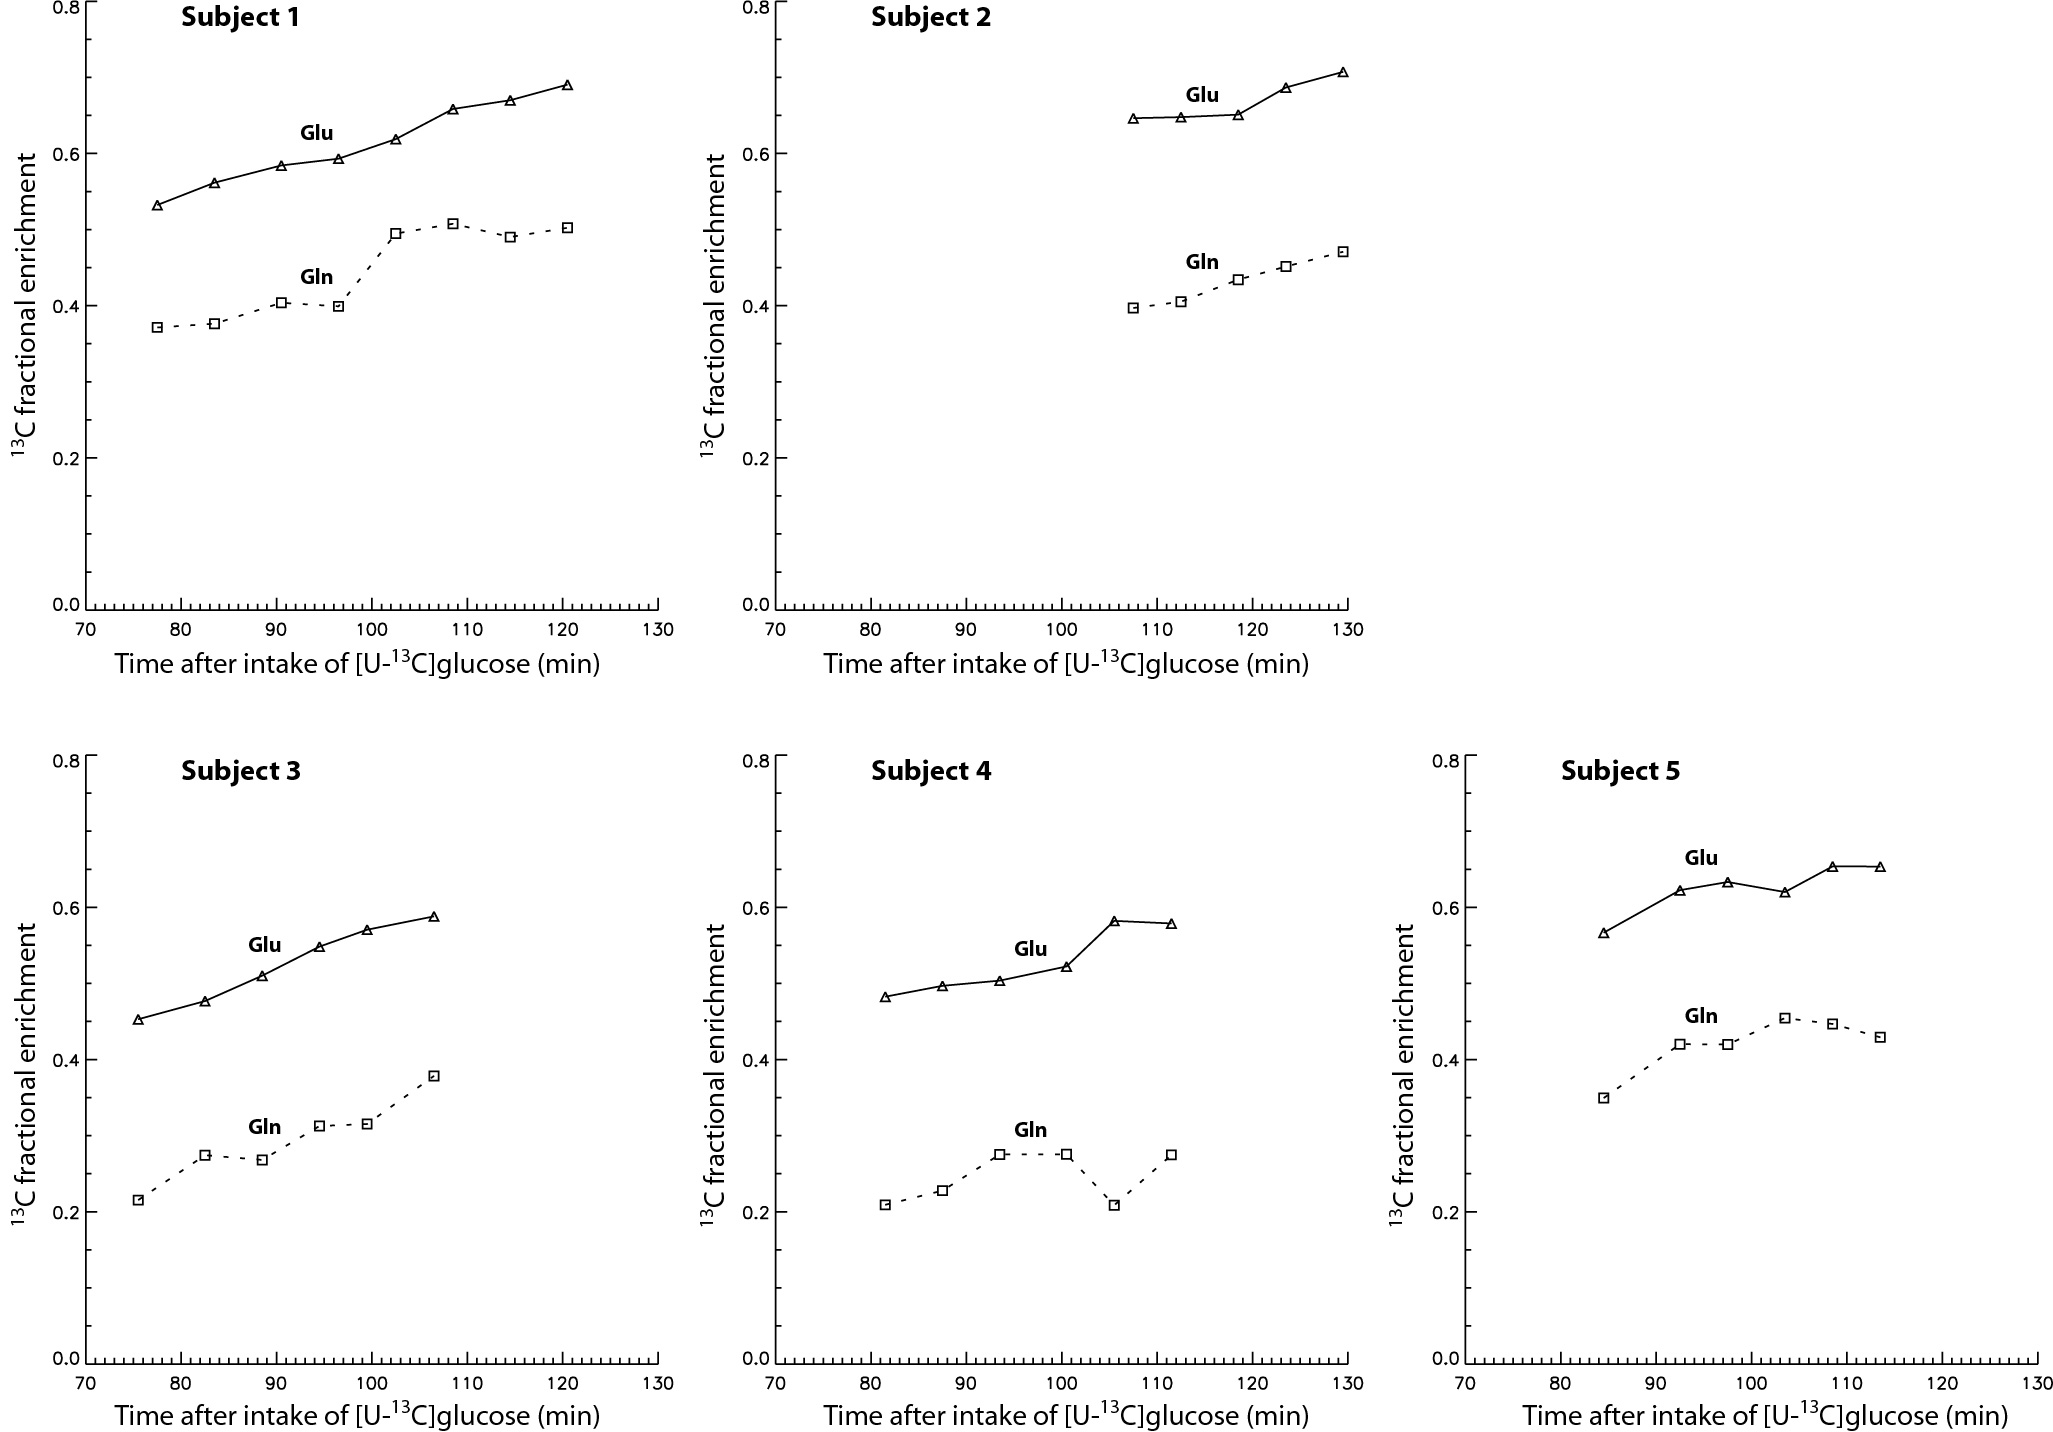
FIGURE 4 Plots of
fractional enrichments of Glu H4 and Gln H4 vs. time after oral
administration of [U-13C]glucose for all five healthy volunteers.
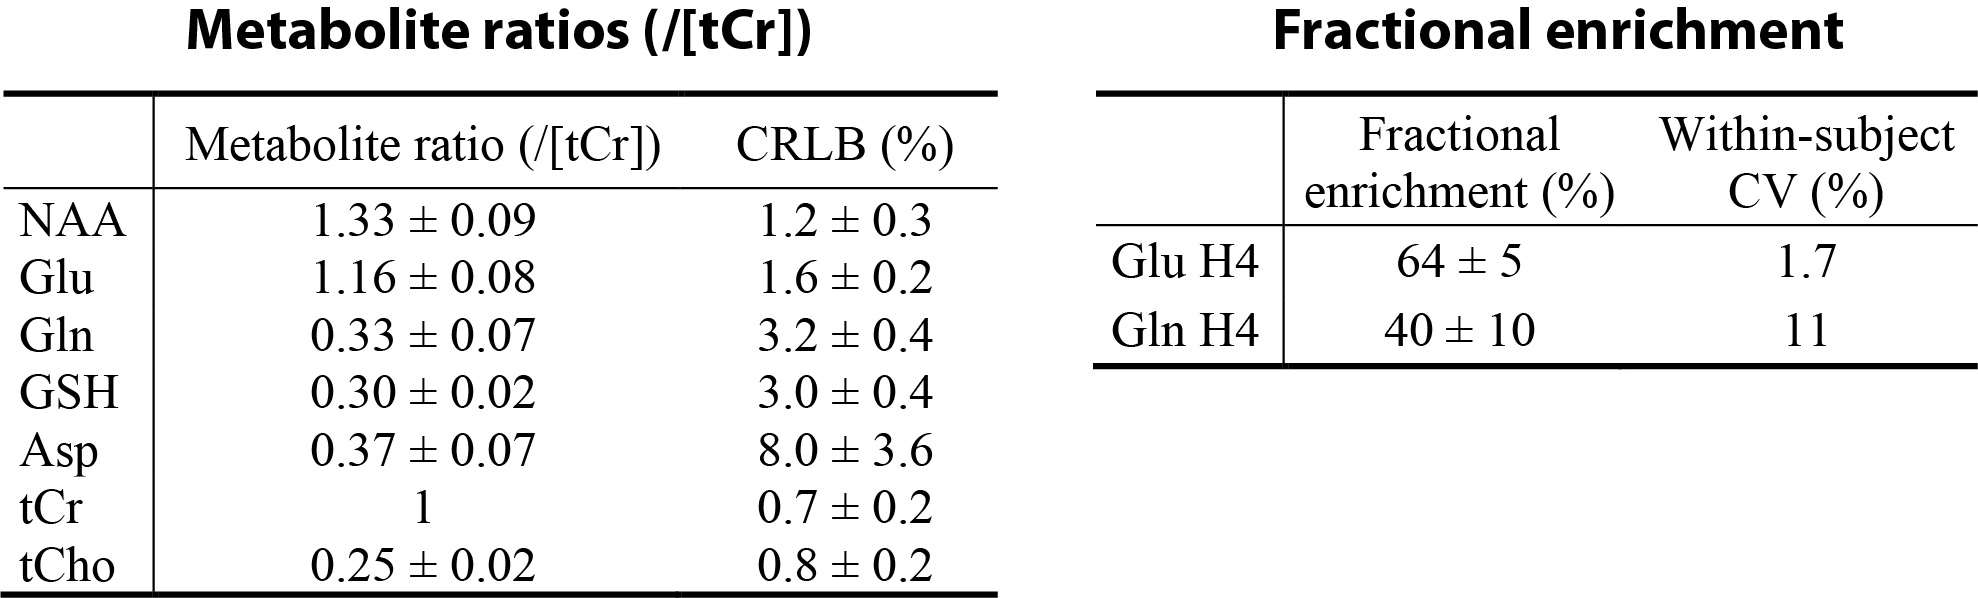
Table 1 Metabolite ratios (/[tCr]) and
fractional enrichments of Glu H4 and Gln H4 in the dACC of five healthy volunteers. Metabolite
ratios were obtained from the pre-13C spectrum of each subject.
Fractional enrichments of Glu H4 and Gln H4 were computed from the last two
post-13C spectra of each subject, which were acquired at 113 ± 9 min
after oral administration of [U-13C]glucose.