0339
Simultaneous Detection of Metabolite Concentration Changes, Water BOLD Signal and pH Changes during Visual Stimulation in the Human Brain at 9.4T1High-Field MR Center, Max Planck Institute for Biological Cybernetics, Tübingen, Germany, 2Advanced Imaging Research Center, UT Southwestern Medical Center, Dallas, TX, United States
Synopsis
Previous studies investigated relationships between the BOLD signal and metabolite concentration changes during visual stimulation by sequential or interleaved fMRI/fMRS measurements. The purpose of this study was to simultaneously investigate the dynamics of BOLD signal and metabolite levels in the activated human brain at 9.4T using the metabolite-cycling (MC) technique. A correlation between the MC water dynamics and concentration increases of lactate and glutamate during activation could be verified. Besides, it could be shown that the high spectral quality of fMRS at 9.4T facilitates separate fitting of creatine and phosphocreatine thereby enabling the calculation of pH dynamics during visual stimulation.
Introduction
Functional Magnetic Resonance Spectroscopy (fMRS) has been performed in several studies to investigate concentration changes of metabolites in the human brain under visual stimulation1–4. To characterize the relationship between neuronal activation and metabolite concentration changes, a combination of sequential BOLD-fMRI and fMRS measurements were performed. The present study aims at characterizing the relationship between the BOLD effect of the water signal and the changes in metabolite concentrations during visual stimulation in the human brain at 9.4T simultaneously employing the metabolite-cycling (MC) technique. Besides, metabolite concentration changes in the PCr buffer system were observed from separately fitted Cr/PCr metabolite concentrations and respective pH alterations were determined.Methods
Experiments were performed on a 9.4T whole-body MRI scanner (Siemens) using a home-built half-volume 3Tx/8Rx 1H coil5. 13 healthy volunteers participated in this study with IRB approval and signed consent. Data of three subjects were discarded; two due to minor lipid contamination and one due to uncorrected astigmatism.For the functional experiments, a block-design paradigm with altering stimulation (radial red-black checkerboard flickering at 10 Hz) and rest periods (black screen) was presented. During the whole measurement, a white fixation cross in the center of the field of view changing its orientation randomly was presented to track the volunteers’ attention via a response button (Figure 1).
A standard multislice Siemens-EPI sequence was used to guide placement of the fMRS voxel (15x18x20 mm3) in the left hemisphere of the occipital cortex (Figure 1). B0-shimming using FASTESTMAP6 and voxel-based power calibration7 were applied. fMRS data were acquired using MC-semiLASER8 (TE/TR 24/5000 ms) with an optimized crusher scheme and a 16-steps COG16(0,15,1,15,0,14;7) phase-cycling scheme9. Metabolite spectra with 320 averages were acquired during 26:40 min measurement time including five blocks (REST-STIM-REST-STIM-REST) with a duration of 5:20 min each for fMRS, and only REST blocks for the control experiment.
Raw data were processed similarly as described previously8. For each subject, single-scan data were averaged in 10 subblocks (32 averages each, 2:40 min acquisition time). Data were then summed across all subjects, and amplitudes and linewidths of MC water and NAA were calculated and correlated using Spearman’s correlation analysis. Next, all fMRS data from the first halves of STIM (S1.1/S2.1) and REST (R2.1/R3.1) were summed resulting in two spectra, STIM and REST with 64 averages each per subject. This is called ‘1st’ in the following. The same was done for the second halves of STIM (S1.2/S2.2) and REST (R2.2/R3.2) (called ‘2nd’ in the following) as well as for the whole STIM (S1.1/S1.2/S2.1/S2.2) and REST (R2.1/R2.2/R3.1/R3.2) blocks (called ‘all’ in the following, 128 averages per spectrum per subject). Metabolites from these spectra were quantified for each volunteer using LCModel10 with a basis set of 17 metabolites and a measured macromolecular baseline. To check whether the metabolite concentration change between STIM and REST is statistically significant, a non-parametric Wilcoxon signed-rank test (α=0.05) combined with a Benjamini-Hochberg correction (q=0.05) was applied. To visualize the concentration difference relative to a baseline concentration (R1.2) with increased time resolution, a moving average of spectra with 32 averages with a sliding offset of 8 scans was applied for every subject, and mean and standard deviations were calculated. Additionally, the metabolite concentration was correlated with the MC water amplitude.
Finally, intracellular pH was estimated from creatine and phosphocreatine concentrations for every subject:
$$\text{p}H=-\log_{10}\left(\begin{array}{c}\frac{[ATP]\times[Cr]\times K^{'}}{ [ADP] \times [PCr]}\end{array}\right)$$ with $$$[ATP]/[ADP]=11.47$$$ and $$$K^{'}=7.09\times 10^{-9}$$$ according to Watanabe et al. and references therein11.
Results and Discussion
Acquired spectra reveal high reliability and reproducibility and show clearly the BOLD effect reflected in increased NAA and Cr+PCr amplitudes (Figure 1). The amplitude and linewidth of MC water spectra follow the stimulation paradigm and correlate with each other (Figure 2). Also, NAA linewidth and amplitude correlate with the MC water amplitude as a result of the BOLD effect (Figure 2). A significant increase of lactate and glutamate was observed in response to stimulation for all three different block combinations (Figure 3). These findings are consistent with previous 7T studies1–4. In contrast to some previous studies, no significant changes in glucose and aspartate could be observed. The time courses of Lac and Glu follow the stimulation paradigm and correlate with the MC water amplitude (Figure 4). The good spectral resolution at 9.4T enables separate fitting of Cr and PCr based on their resonances at 3.913/3.930 ppm. A significant increase in Cr and decrease in PCr was observed in the first halves of the STIM and REST periods (Figure 3). For the second halves, or when averaging over larger periods, the results were less prominent indicating a time dependency. This can also be seen when calculating pH; pH follows the stimulus paradigm and reveals a significant decrease at the onset of STIM (Figure 5). So far, a decrease in PCr/Cr ratio during visual stimulation, and, therefore, pH changes measured by 1H MRS were only reported in animal studies12–14.Conclusion
MC-semiLASER was successfully applied to simultaneously compare metabolite concentration changes in the activated human brain with the BOLD effect. It confirms previously detected metabolite changes in Lac and Glu. Due to the high quality of the spectra measured at 9.4T, separation of Cr and PCr becomes feasible thereby enabling non-invasive pH measurements.Acknowledgements
Funding by the European Union (ERC Starting Grant, SYNAPLAST MR, Grant Number: 679927 and Horizon 2020, CDS-QUAMRI, Grant Number: 634541) and by the Cancer Prevention and Research Institute of Texas (CPRIT) (Grant Number: RR180056) is gratefully acknowledged.References
1. Mangia S, Tkáč I, Gruetter R, Van de Moortele P-F, Maraviglia B, Uğurbil K. Sustained Neuronal Activation Raises Oxidative Metabolism to a New Steady-State Level: Evidence from 1 H NMR Spectroscopy in the Human Visual Cortex. J Cereb Blood Flow Metab. 2007;27(5):1055-1063.
2. Lin Y, Stephenson MC, Xin L, Napolitano A, Morris PG. Investigating the Metabolic Changes due to Visual Stimulation using Functional Proton Magnetic Resonance Spectroscopy at 7 T. J Cereb Blood Flow Metab. 2012;32(8):1484-1495.
3. Schaller B, Mekle R, Xin L, Kunz N, Gruetter R. Net increase of lactate and glutamate concentration in activated human visual cortex detected with magnetic resonance spectroscopy at 7 tesla. J Neurosci Res. 2013;91(8):1076-1083.
4. Bednařík P, Tkáč I, Giove F, et al. Neurochemical and BOLD Responses during Neuronal Activation Measured in the Human Visual Cortex at 7 Tesla. J Cereb Blood Flow Metab. 2015;35(4):601-610.
5. Pfrommer A, Avdievich NI, Henning A. Four Channel Transceiver Array for Functional Magnetic Resonance Spectroscopy in the Human Visual Cortex at 9.4 T 1. In: Proceedings of the Joint Annual Meeting ISMRM-ESMRMB, 2014, Milano, Italy. Vol 22.;2014:1305.
6. Gruetter R, Tkáč I. Field mapping without reference scan using asymmetric echo-planar techniques. Magn Reson Med. 2000;43(2):319-323.
7. Versluis MJ, Kan HE, Van Buchem MA, Webb AG. Improved signal to noise in proton spectroscopy of the human calf muscle at 7 T using localized B1 calibration. Magn Reson Med. 2010;63(1):207-211.
8. Giapitzakis I-A, Shao T, Avdievich N, Mekle R, Kreis R, Henning A. Metabolite-cycled STEAM and semi-LASER localization for MR spectroscopy of the human brain at 9.4T. Magn Reson Med. 2018;79:1841-1850.
9. Landheer K, Juchem C. Simultaneous optimization of crusher and phase cycling schemes for magnetic resonance spectroscopy – an extension of DOTCOPS. Magn Reson Med. 2020;83(2):391-402.
10. Provencher SW. Estimation of metabolite concentrations from localized in vivo proton NMR spectra. Magn Reson Med. 1993;30(6):672-679.
11. Watanabe T, Frahm J, Michaelis T. Amide proton signals as pH indicator for in vivo MRS and MRI of the brain-Responses to hypercapnia and hypothermia. Neuroimage. 2016;133:390-398.
12. Xu S, Yang J, Li CQ, Zhu W, Shen J. Metabolic alterations in focally activated primary somatosensory cortex of α-chloralose-anesthetized rats measured by 1H MRS at 11.7 T. Neuroimage. 2005;28(2):401-409.
13. Sonnay S, Poirot J, Just N, et al. Astrocytic and neuronal oxidative metabolism are coupled to the rate of glutamate–glutamine cycle in the tree shrew visual cortex. Glia. 2018;66(3):477-491.
14. Ligneul C, Fernandes FF, Shemesh N. Functional Magnetic
Resonance Spectroscopy in the mouse. 2020.https://arxiv.org/abs/2001.08505.
Figures
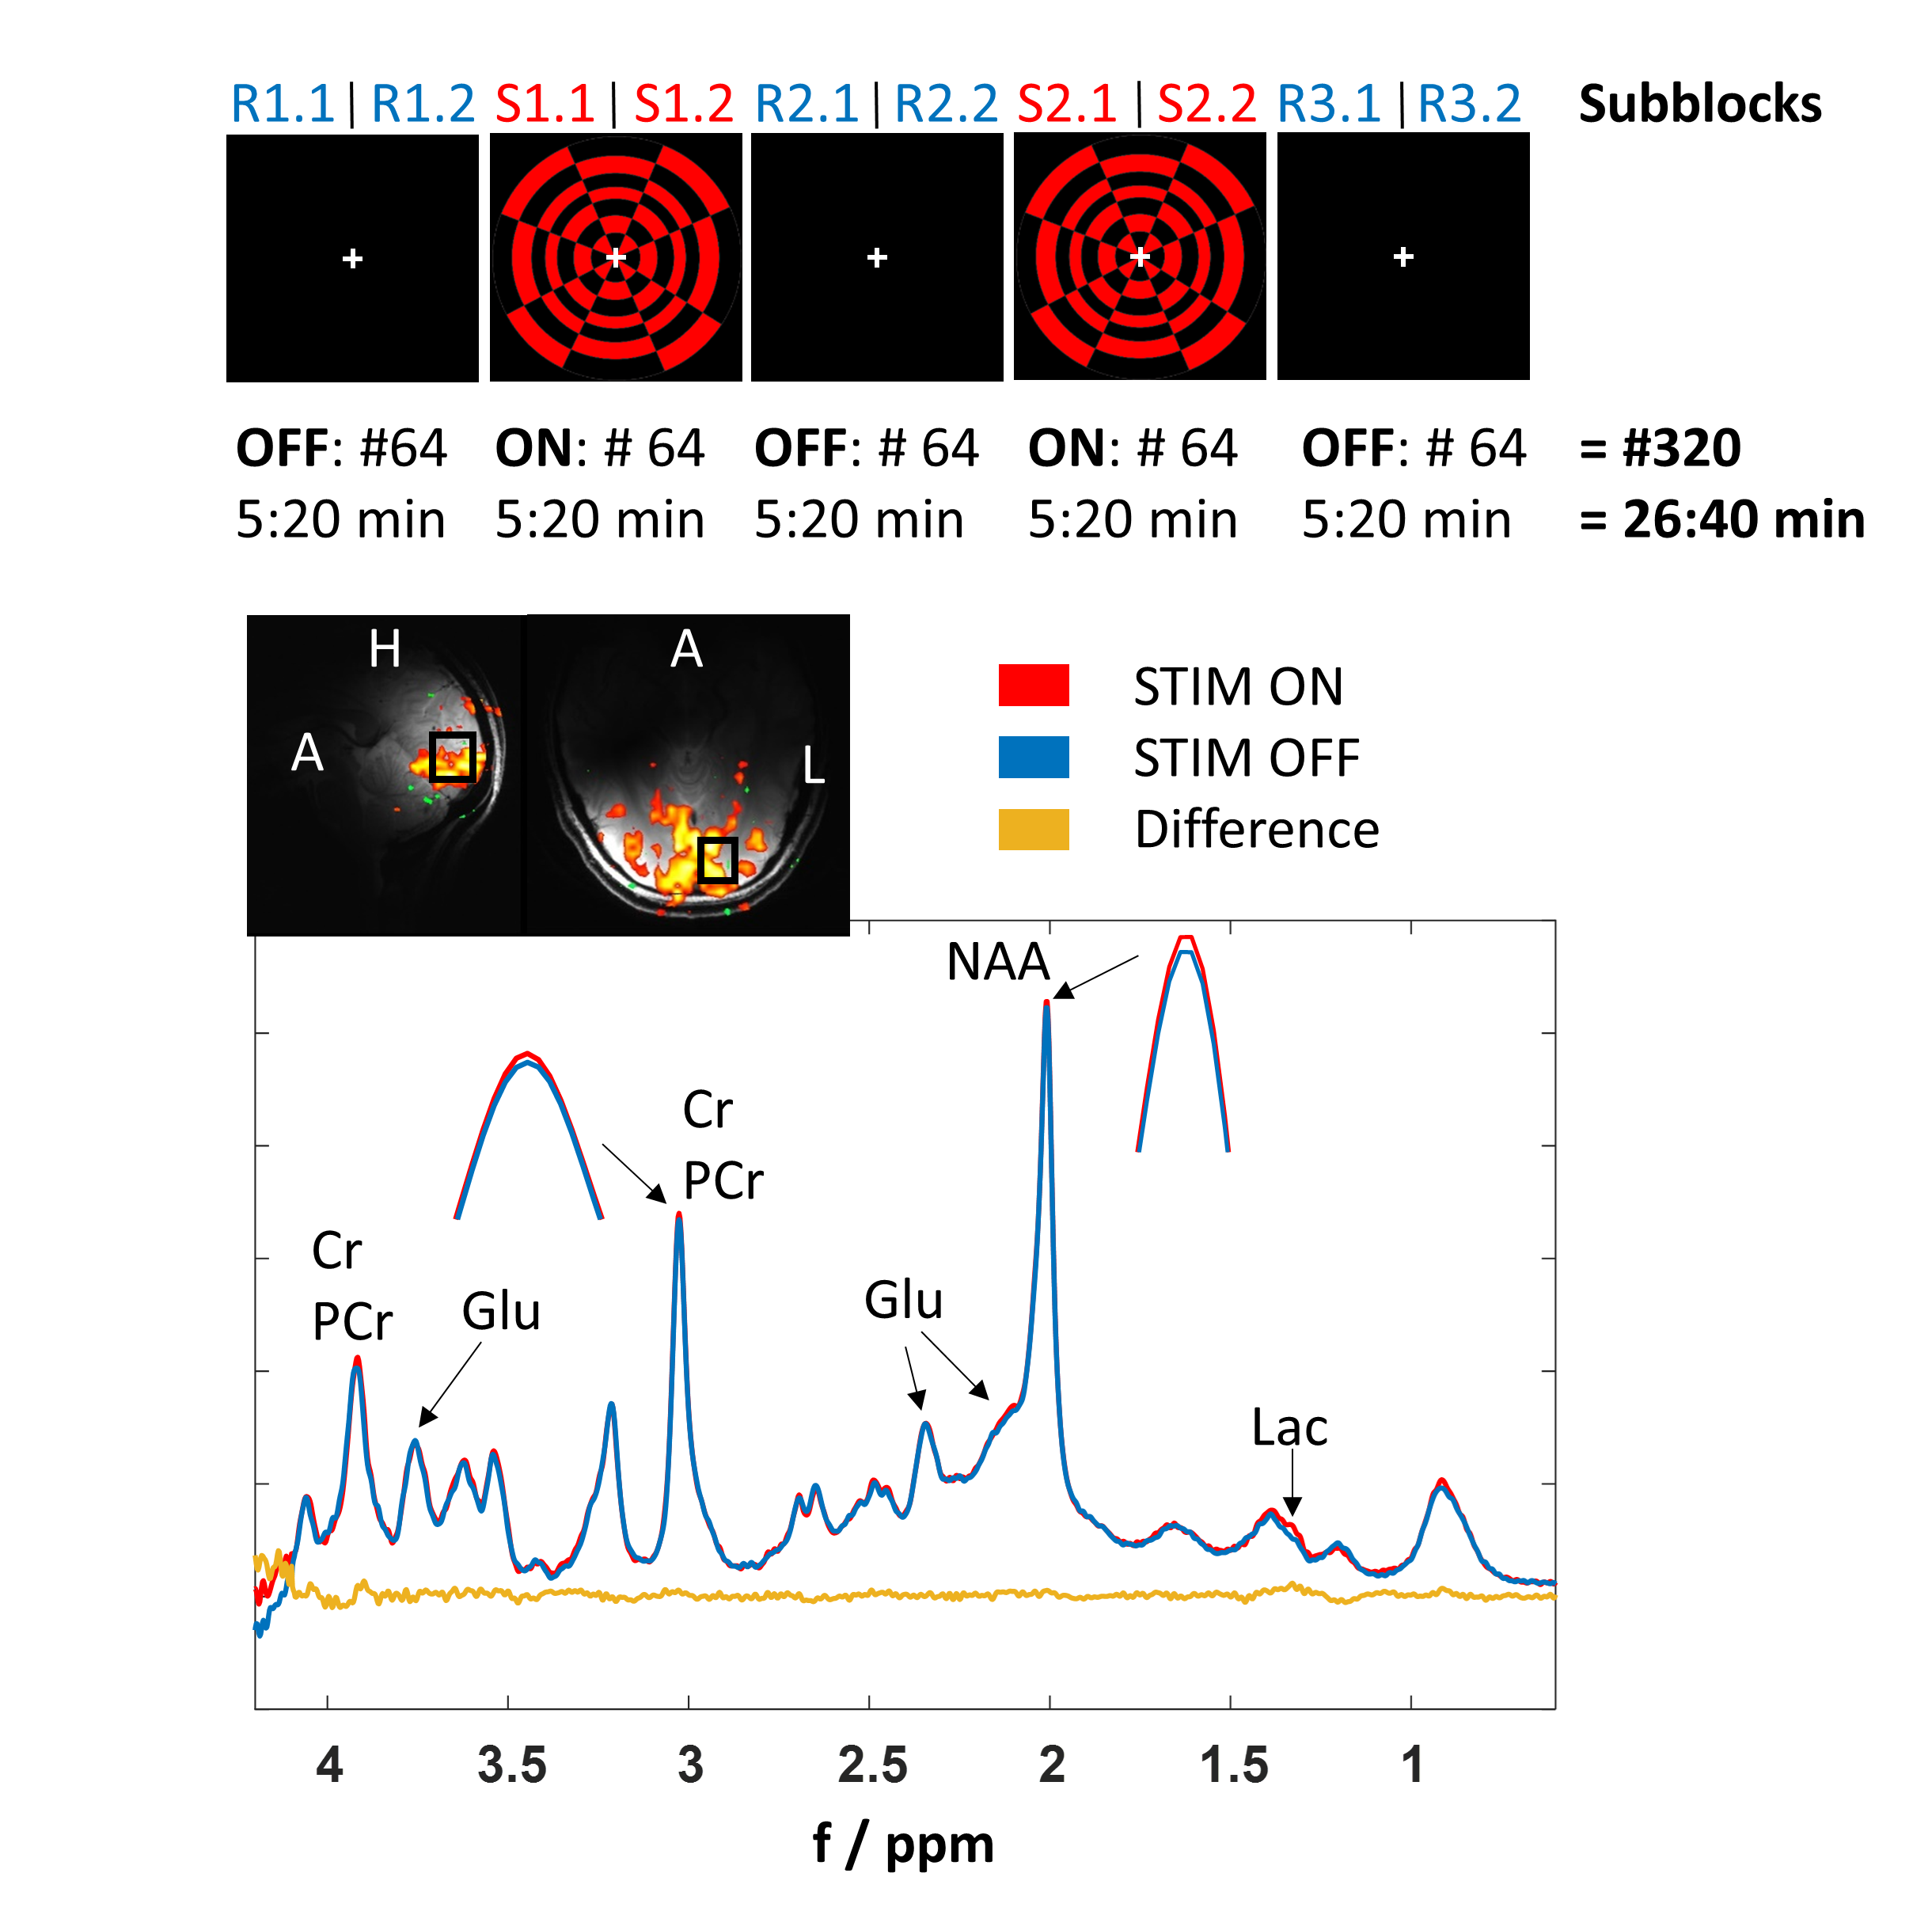
Figure 1: Top: Schematic diagram of the fMRS visual stimulation paradigm using a red-black checkerboard pattern. Numbers indicate the acquired number of averages per block and needed acquisition time. FLASH insets below show the BOLD activated region and the fMRS voxel placement (15x18x20 mm3).
Bottom: Representative MR spectra from one volunteer acquired during STIM (red, S1.2/S2.2) and REST (blue, R2.2/R3.2) periods (64 averages each spectrum) and the difference spectrum (yellow). Small amplitude and linewidth changes of Cr+PCr and NAA indicate the BOLD effect.
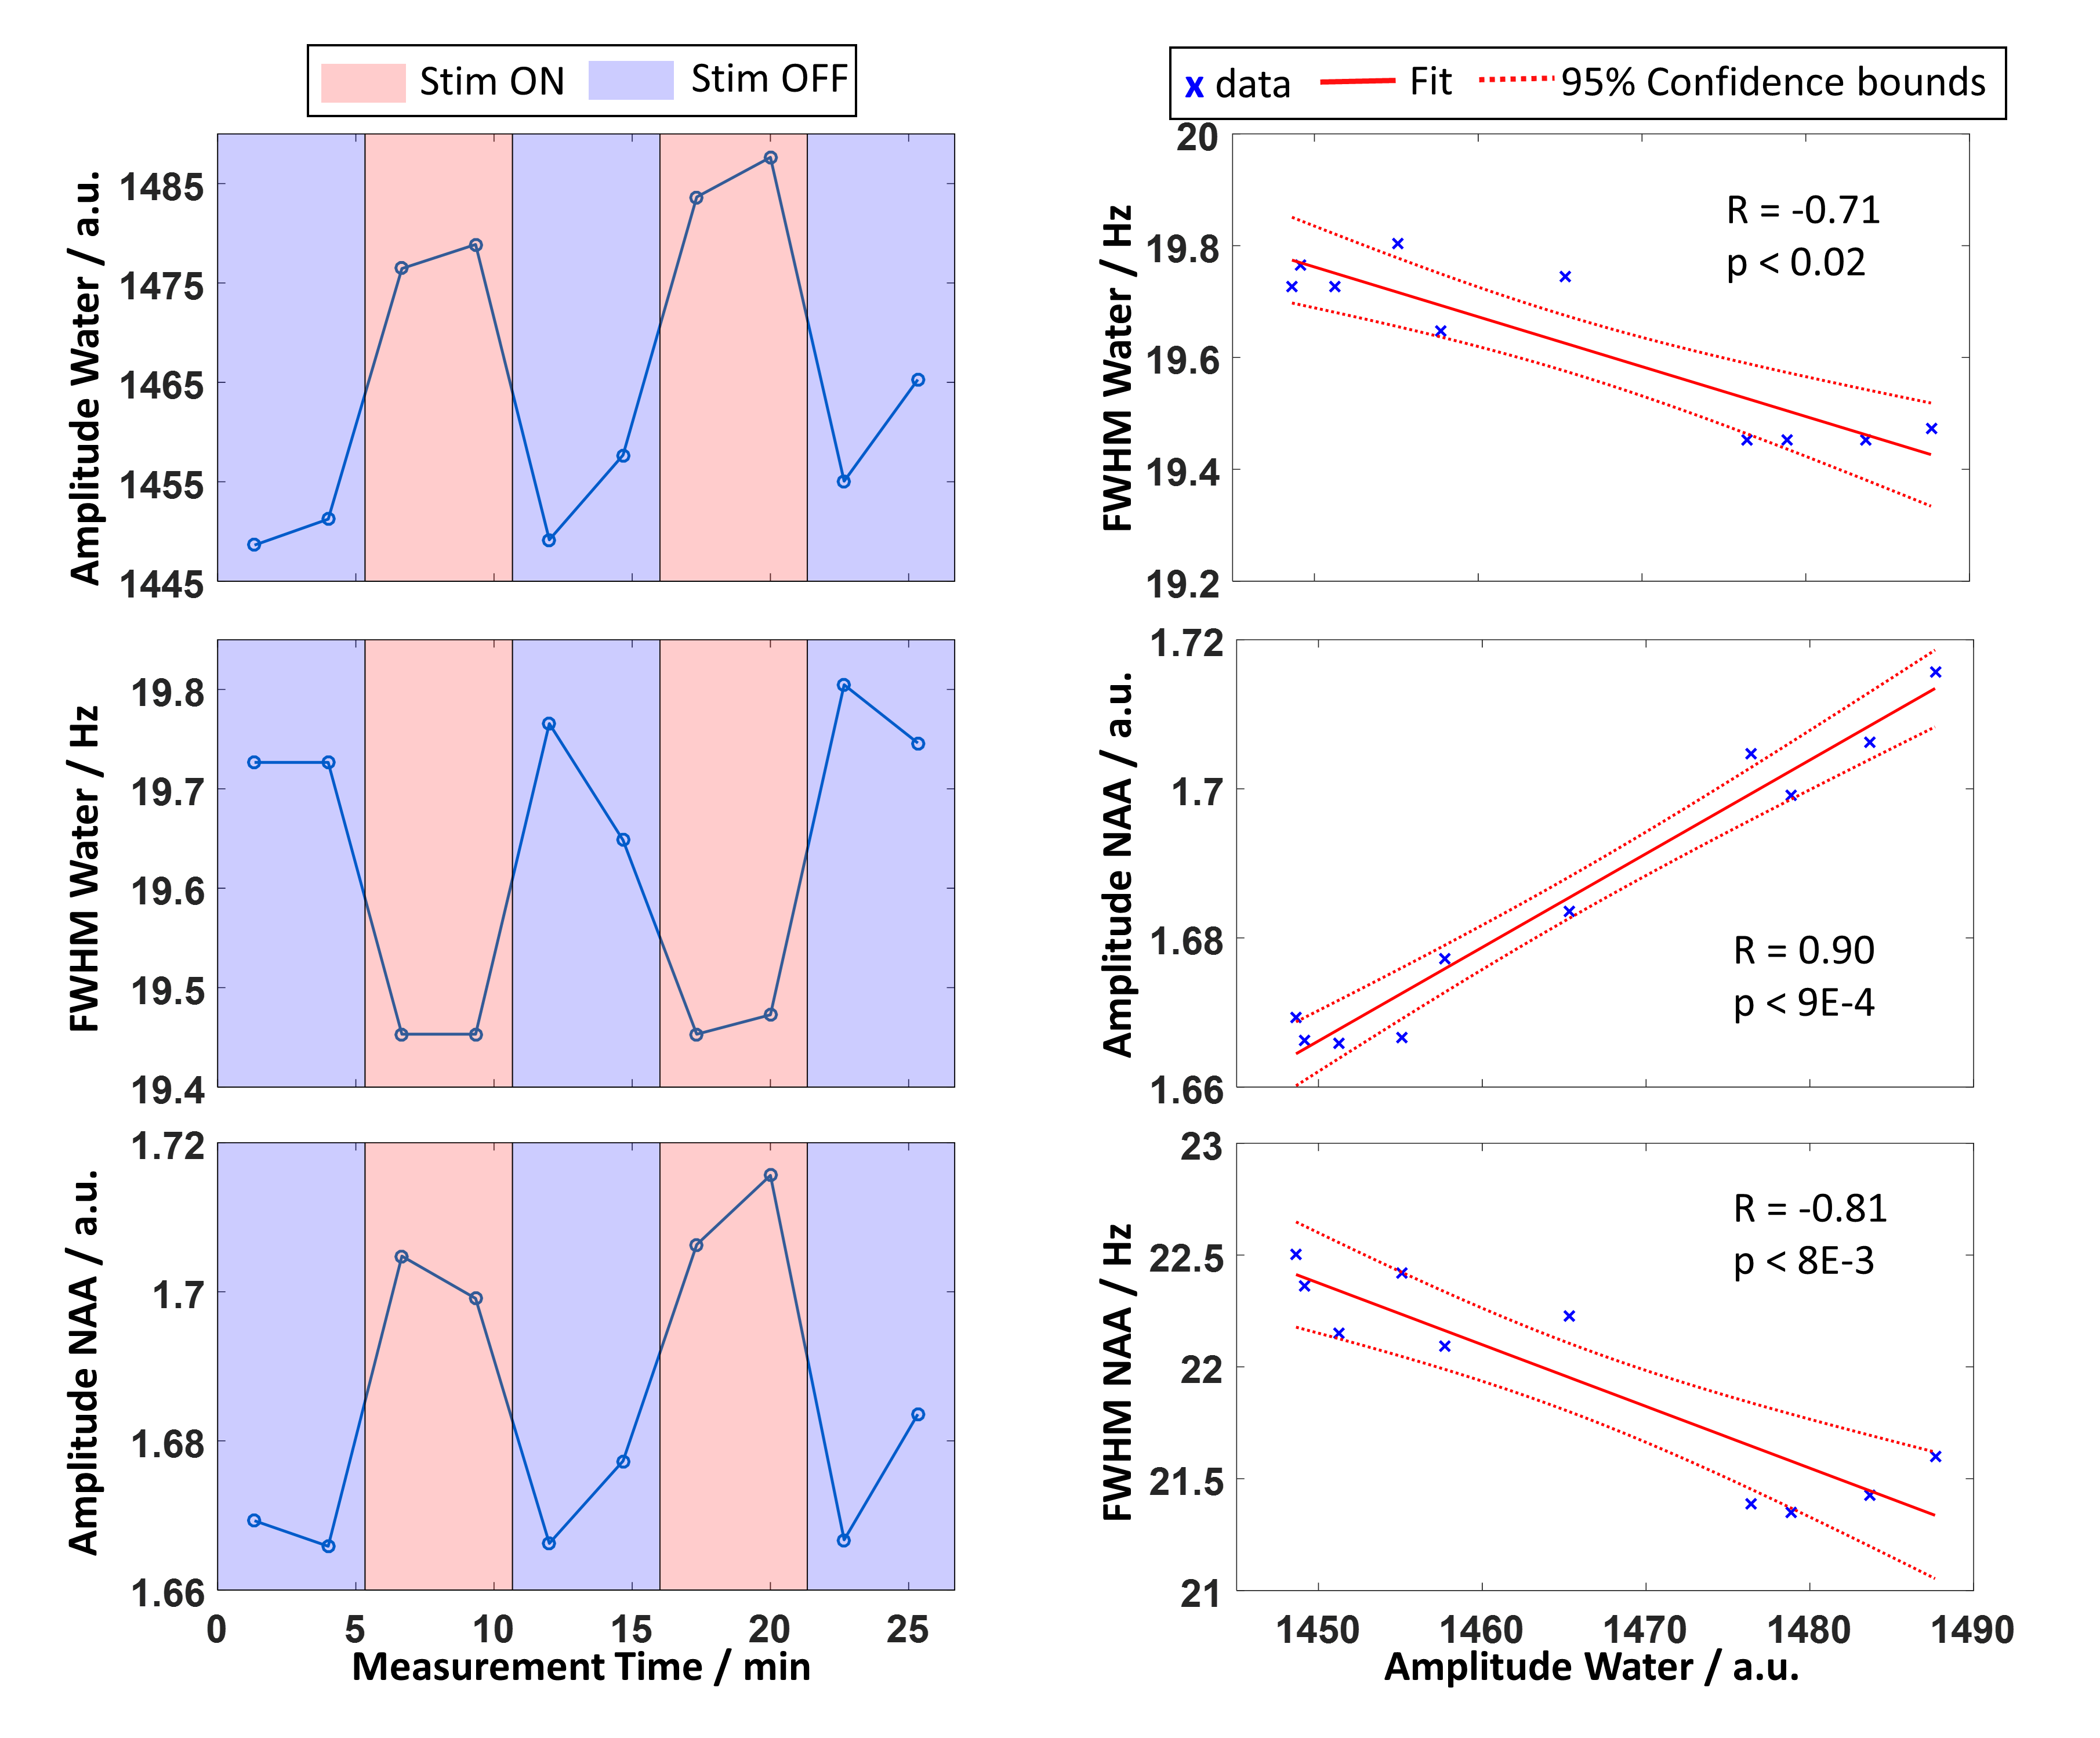
Figure 2: Left: Time courses of the linewidth and amplitude of MC water and NAA during the visual stimulation paradigm calculated from spectra summed across all subjects (time resolution 2:40 min).
Right: Correlation plots of the amplitude of MC water and the linewidth of MC water as well as the amplitude and linewidth of NAA, respectively, for the 10 time points (blue crosses). Solid red lines represent the linear fit, dotted red lines 95% confidence intervals. R and p values indicate the Spearman’s Rank Correlation Coefficient and significance level of the correlation, respectively.
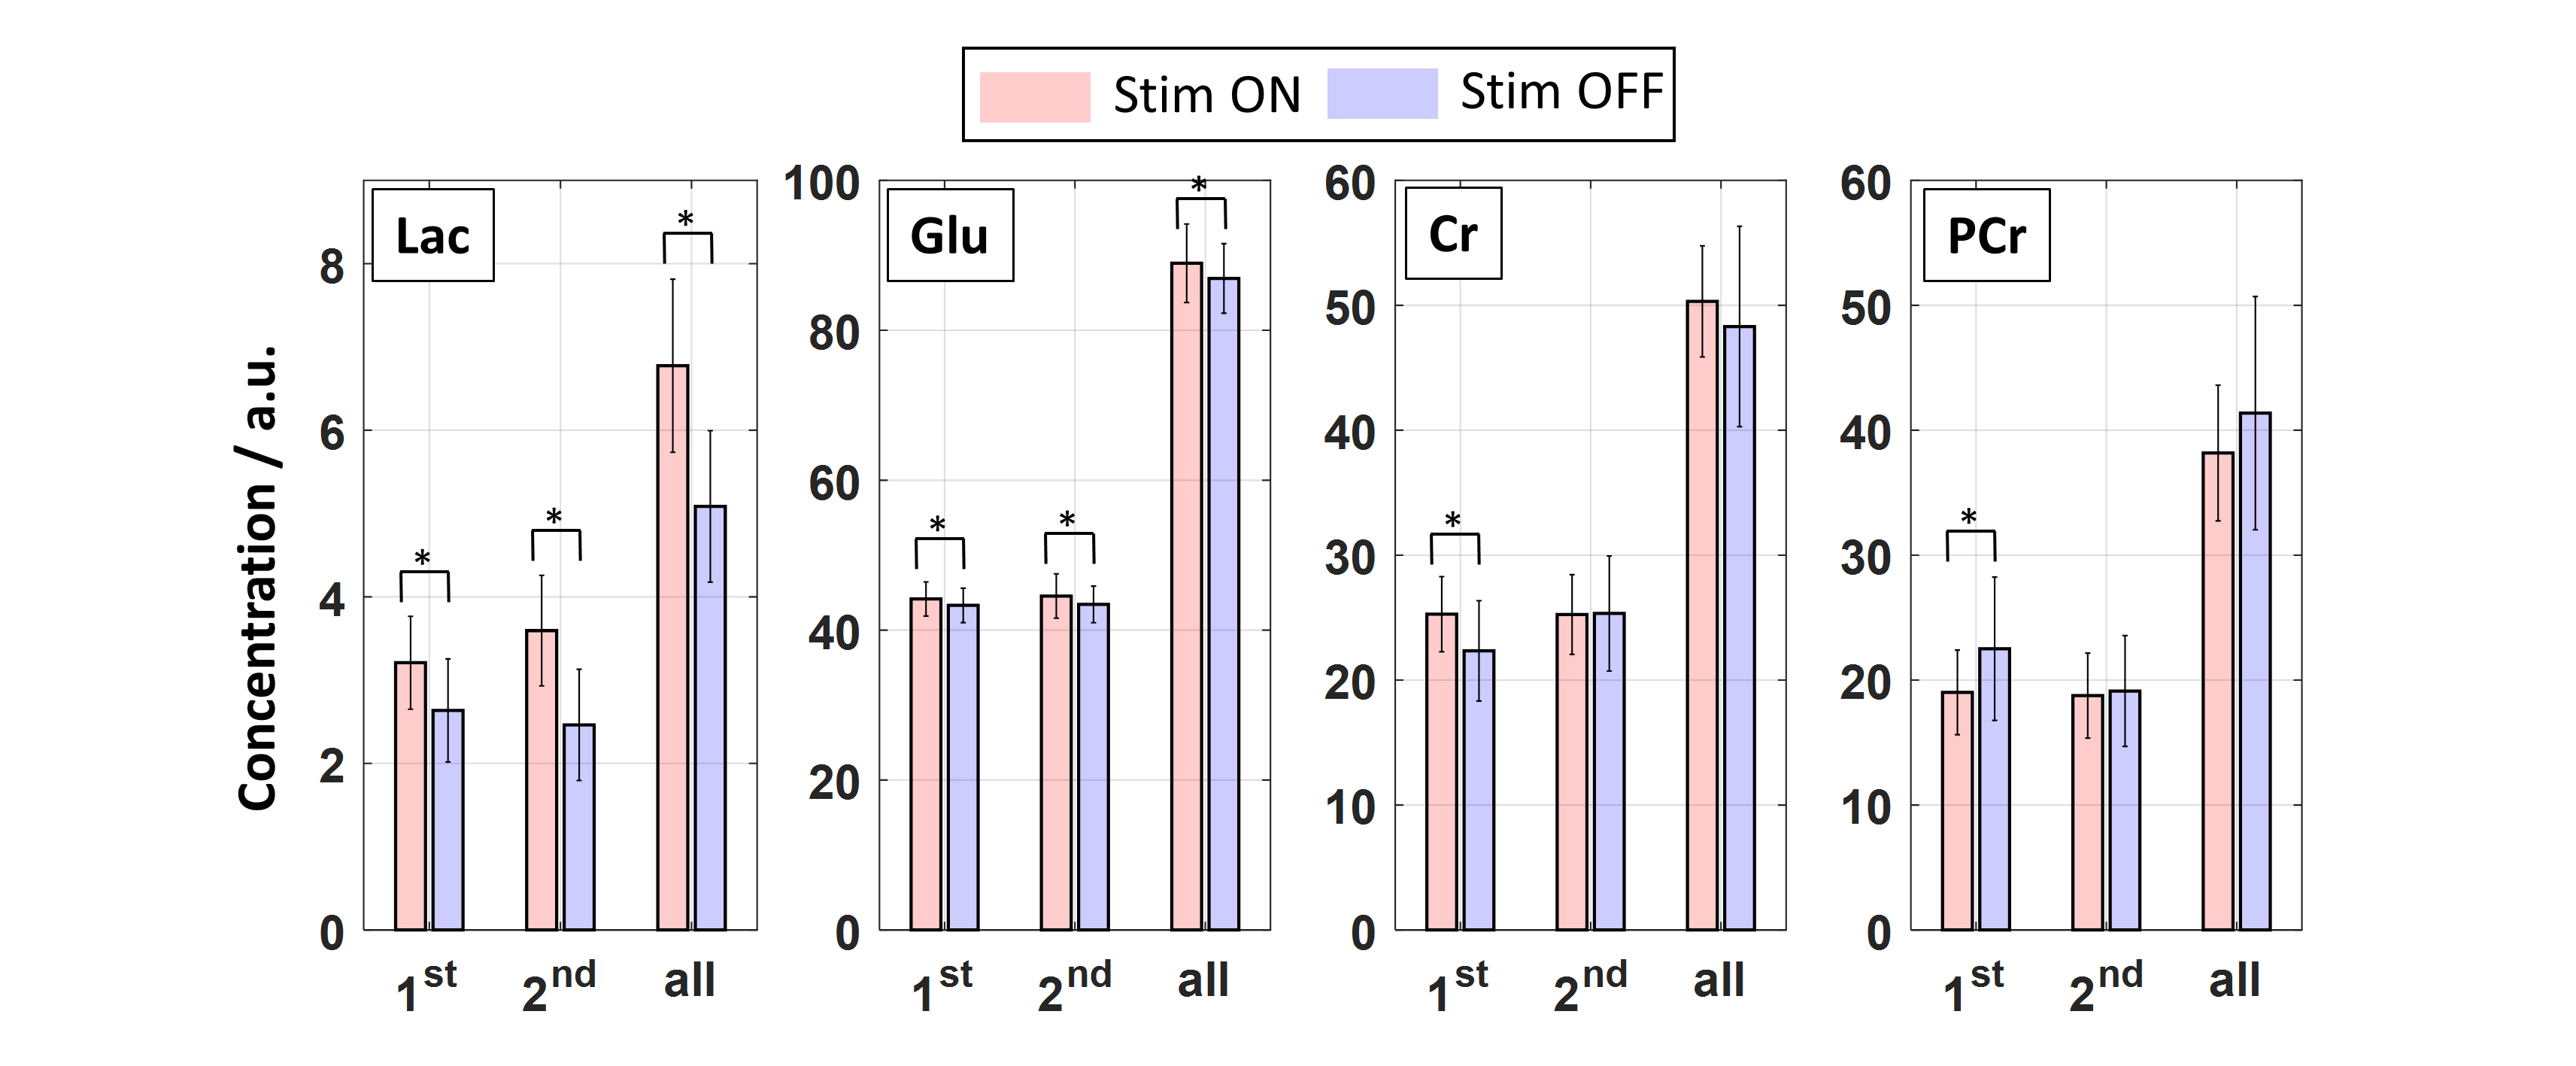

Figure 4: Left: Mean time courses of Lac and Glu concentration differences relative to a baseline concentration (R1.2) with a time resolution of 40 s. Error bars represent standard deviations of the mean over all volunteers.
Right: Correlation plots between the metabolite concentrations (from spectra summed across all volunteers) and the MC water amplitude (blue crosses). Solid red lines represent the linear fit, dotted red lines 95% confidence intervals. R and p values indicate the Spearman’s Rank Correlation Coefficient and significance level of the correlation, respectively.
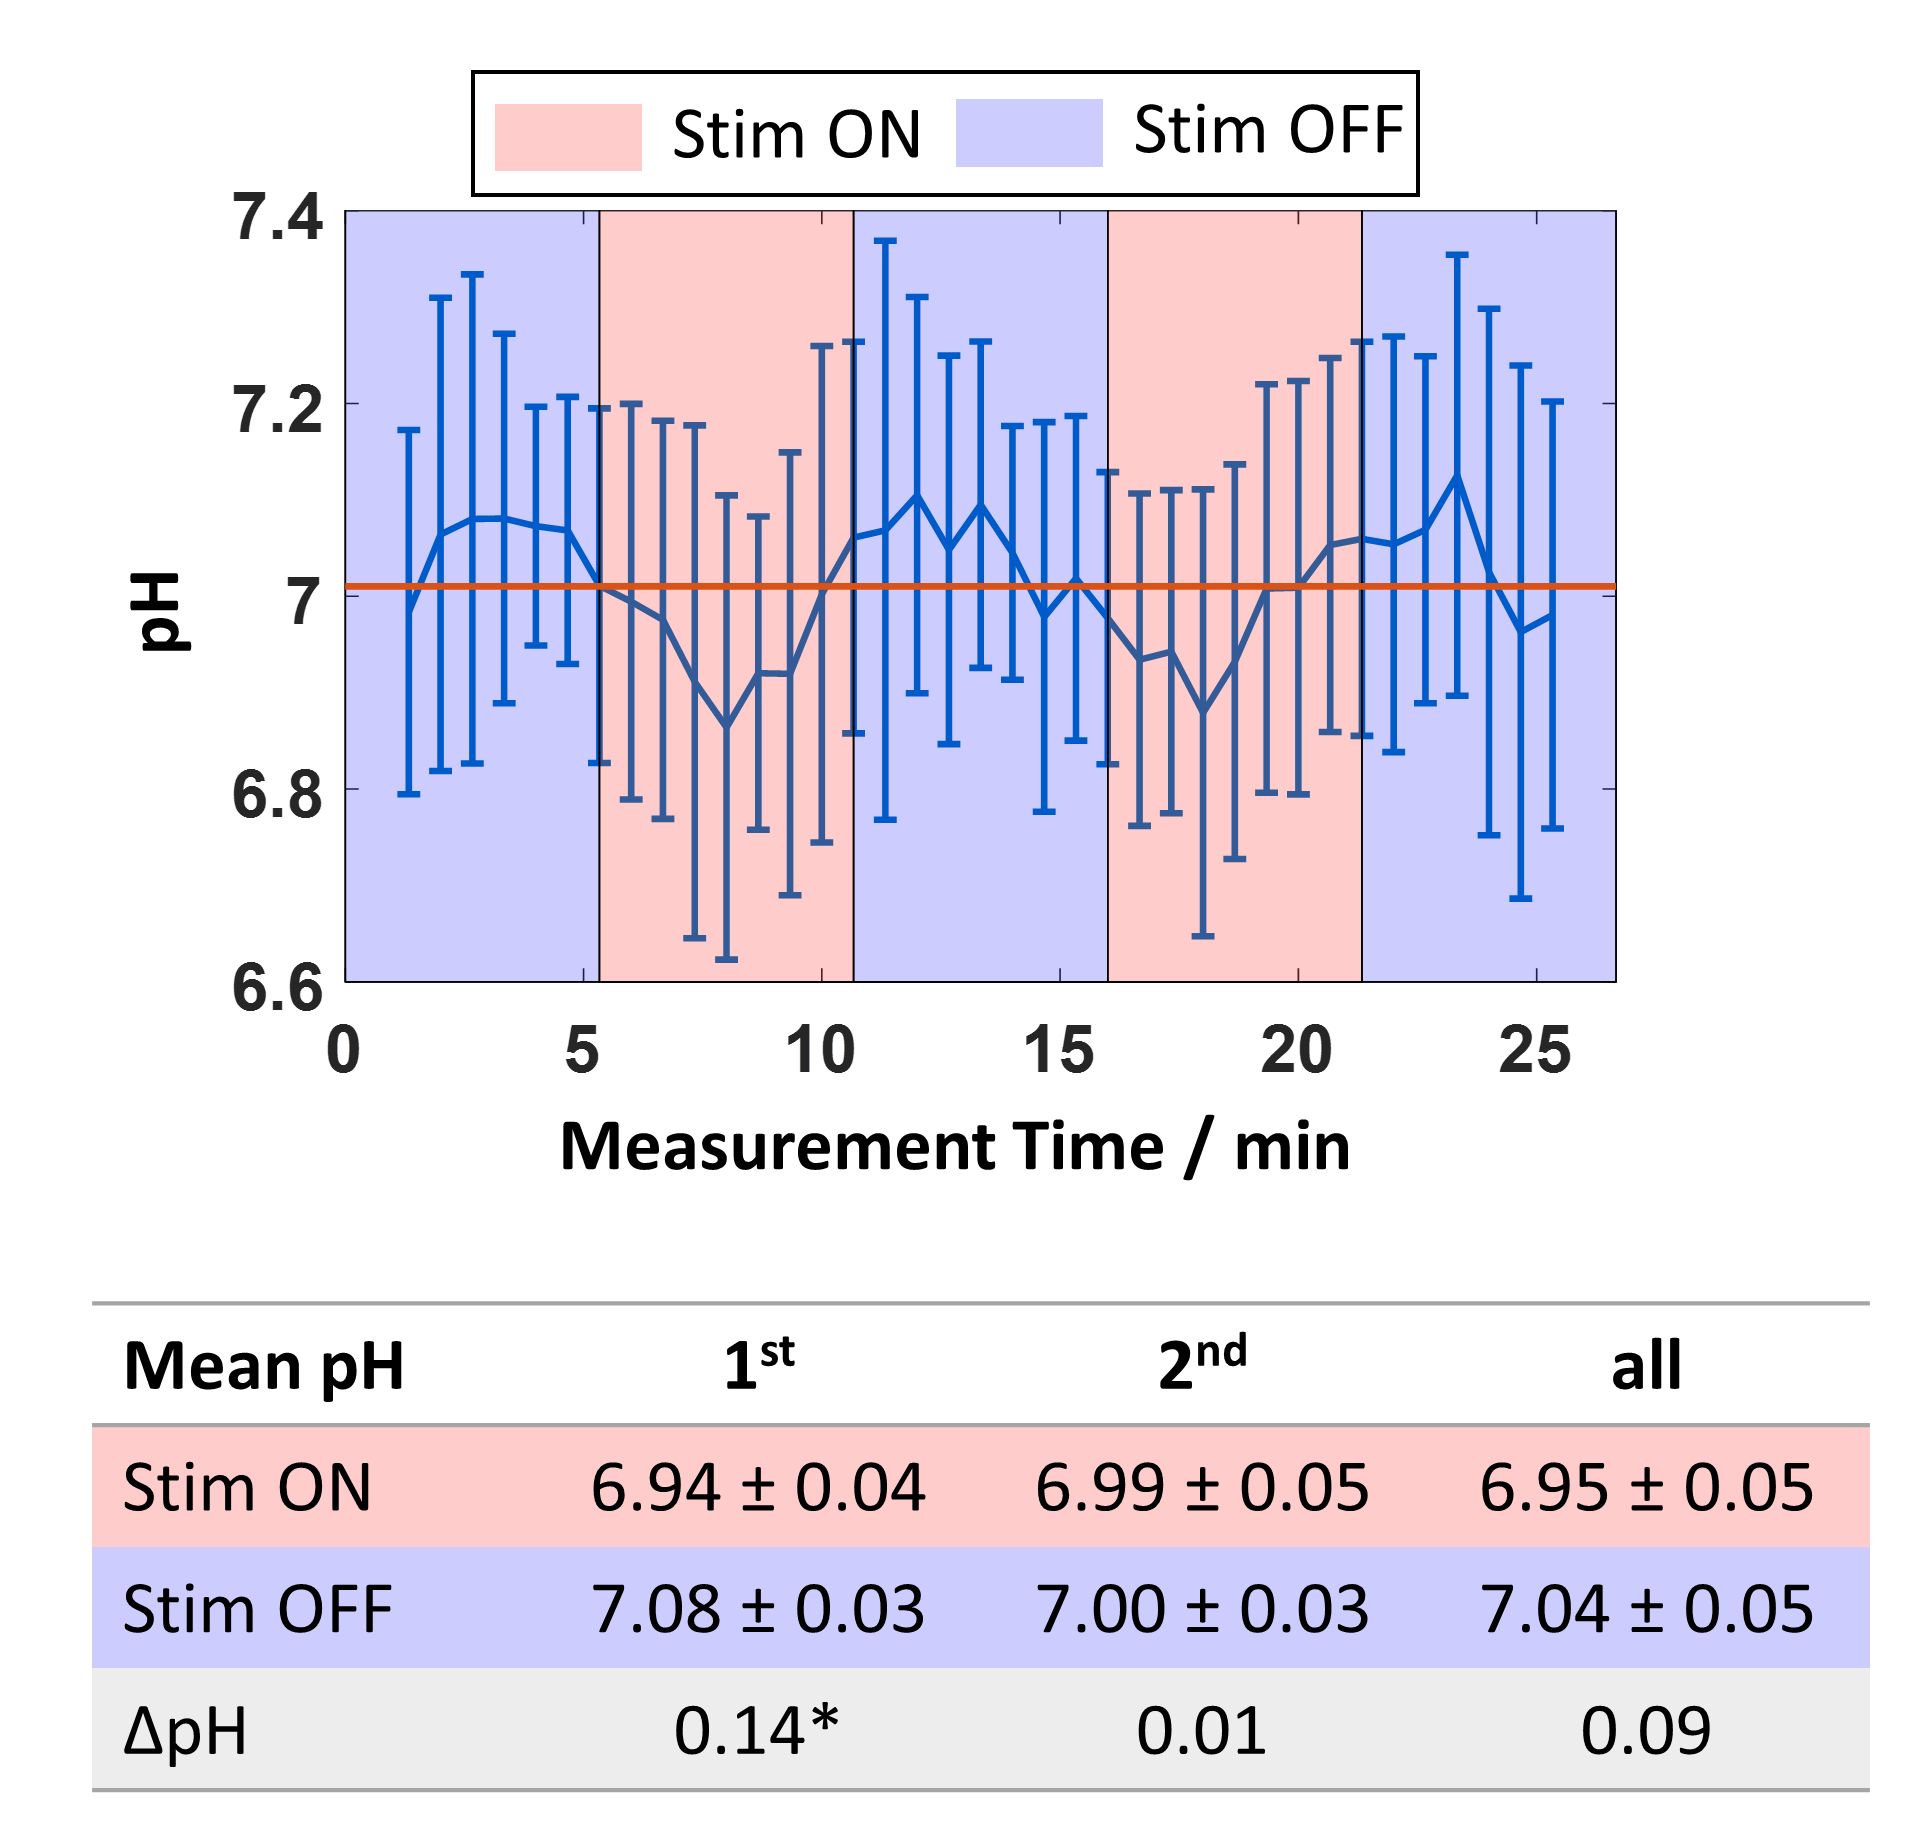
Figure 5: Top: Mean pH time course of all volunteers and the standard deviation during the visual stimulation paradigm.
Bottom: Mean pH difference between STIM and REST during different periods of the blocks (‘1st’: S1.1 / S2.1; R2.1 / R3.1; ‘2nd’: S1.2 / S2.2; R2.2 / R3.2; ‘all’: S1.1 / S1.2 / S2.1 / S2.2; R2.1 / R2.2 / R13.1 / R3.2). Statistically significant concentration differences (STIM−REST) assessed with a Wilcoxon signed-rank test (α=0.05) are marked with an asterisk.