0338
3D-CRT-FID-MRSI in the brain at 7T: Evaluation of regional concentration estimates1Department of Neurosurgery, Medical University of Vienna, Vienna, Austria, 2High Field MR Centre, Department of Biomedical Imaging and Image-guided Therapy, Medical University of Vienna, Vienna, Austria, 3Division of General Psychiatry, Department of Psychiatry and Psychotherapy, Medical University of Vienna, Vienna, Austria, 4High Field MR Centre, Centre for Medical Physics and Biomedical Engineering, Medical University of Vienna, Vienna, Austria, 5Christian Doppler Laboratory for Clinical Molecular MR Imaging, Vienna, Austria
Synopsis
Applying a 3D-MRSI sequence with ~3 mm isotropic resolution and 15 min measurement time at 7T to a cohort of 24 healthy subjects, we successfully estimated the concentrations of 13 brain metabolites in 44 regions using internal water referencing. We established inter-subject coefficients of variation in the range of 10-20%. The resulting concentration estimates corresponded well to previous research except for GSH.
Purpose
We have recently introduced a proton 3D-CRT-FID-MRSI (concentric ring trajectories; free induction decay, magnetic resonance spectroscopic imaging) sequence for fast and high-resolution metabolic imaging at 7 Tesla (7T) in healthy subjects [1] and glioma patients [2]. Reliable high-resolution mapping of metabolite distributions has a great potential for the research of healthy brains and pathologies, but the robustness and variability of our method requires more research. To this end, we evaluated FID-MRSI -based concentration estimates and their variability over 55 regions of interest (ROIs) in 24 healthy subjects.Methods
We obtained IRB-approval and informed consent of all 24 young and healthy subjects for this study (12 male, 12 female, mean age 27±6 years). Using a Siemens 7T Magnetom scanner, we acquired whole-brain 7T 3D-CRT-FID-MRSI in 15 min with 3.4 mm isometric resolution, a 64×64×39 matrix over a field of view of 220×220×133 mm³ with a 110 mm slab and acquisition delay of 1.3 ms [1,2]. A second MRSI scan, without water suppression was acquired in 3:18 min as internal water reference. For anatomical reference, MP2RAGE images with 0.8 mm isotropic resolution were acquired.For offline MRSI processing, we utilized our in-house-developed software pipeline including spatial Hamming filtering, lipid signal removal by L2-regularization [3] and LCModel quantification for 17 different compounds. For every MRSI voxel, FSL tissue segmentation was used to calculate T1 correction factors and local water concentrations used for concentration estimation [4]. Metabolite T1s were taken from literature or estimated based on known metabolite values [5]. We defined 55 ROIS based on a Freesurfer segmentation of the T1 reference. Mean metabolite concentrations within each region were calculated. Regions were then rated for the percentage of voxels with Cramér–Rao lower bounds (CRLBs) <40% for all of N-acetylaspartate, total creatine, total choline and myo-inositol (NAA/tCr/tCho/mIns). >80% were defined as good, 66-79% as acceptable, and <60% were rejected. For all passing ROIs, means per subject and inter-subject mean of means were calculated as well as inter-subject coefficients of variation (CVs).
Results
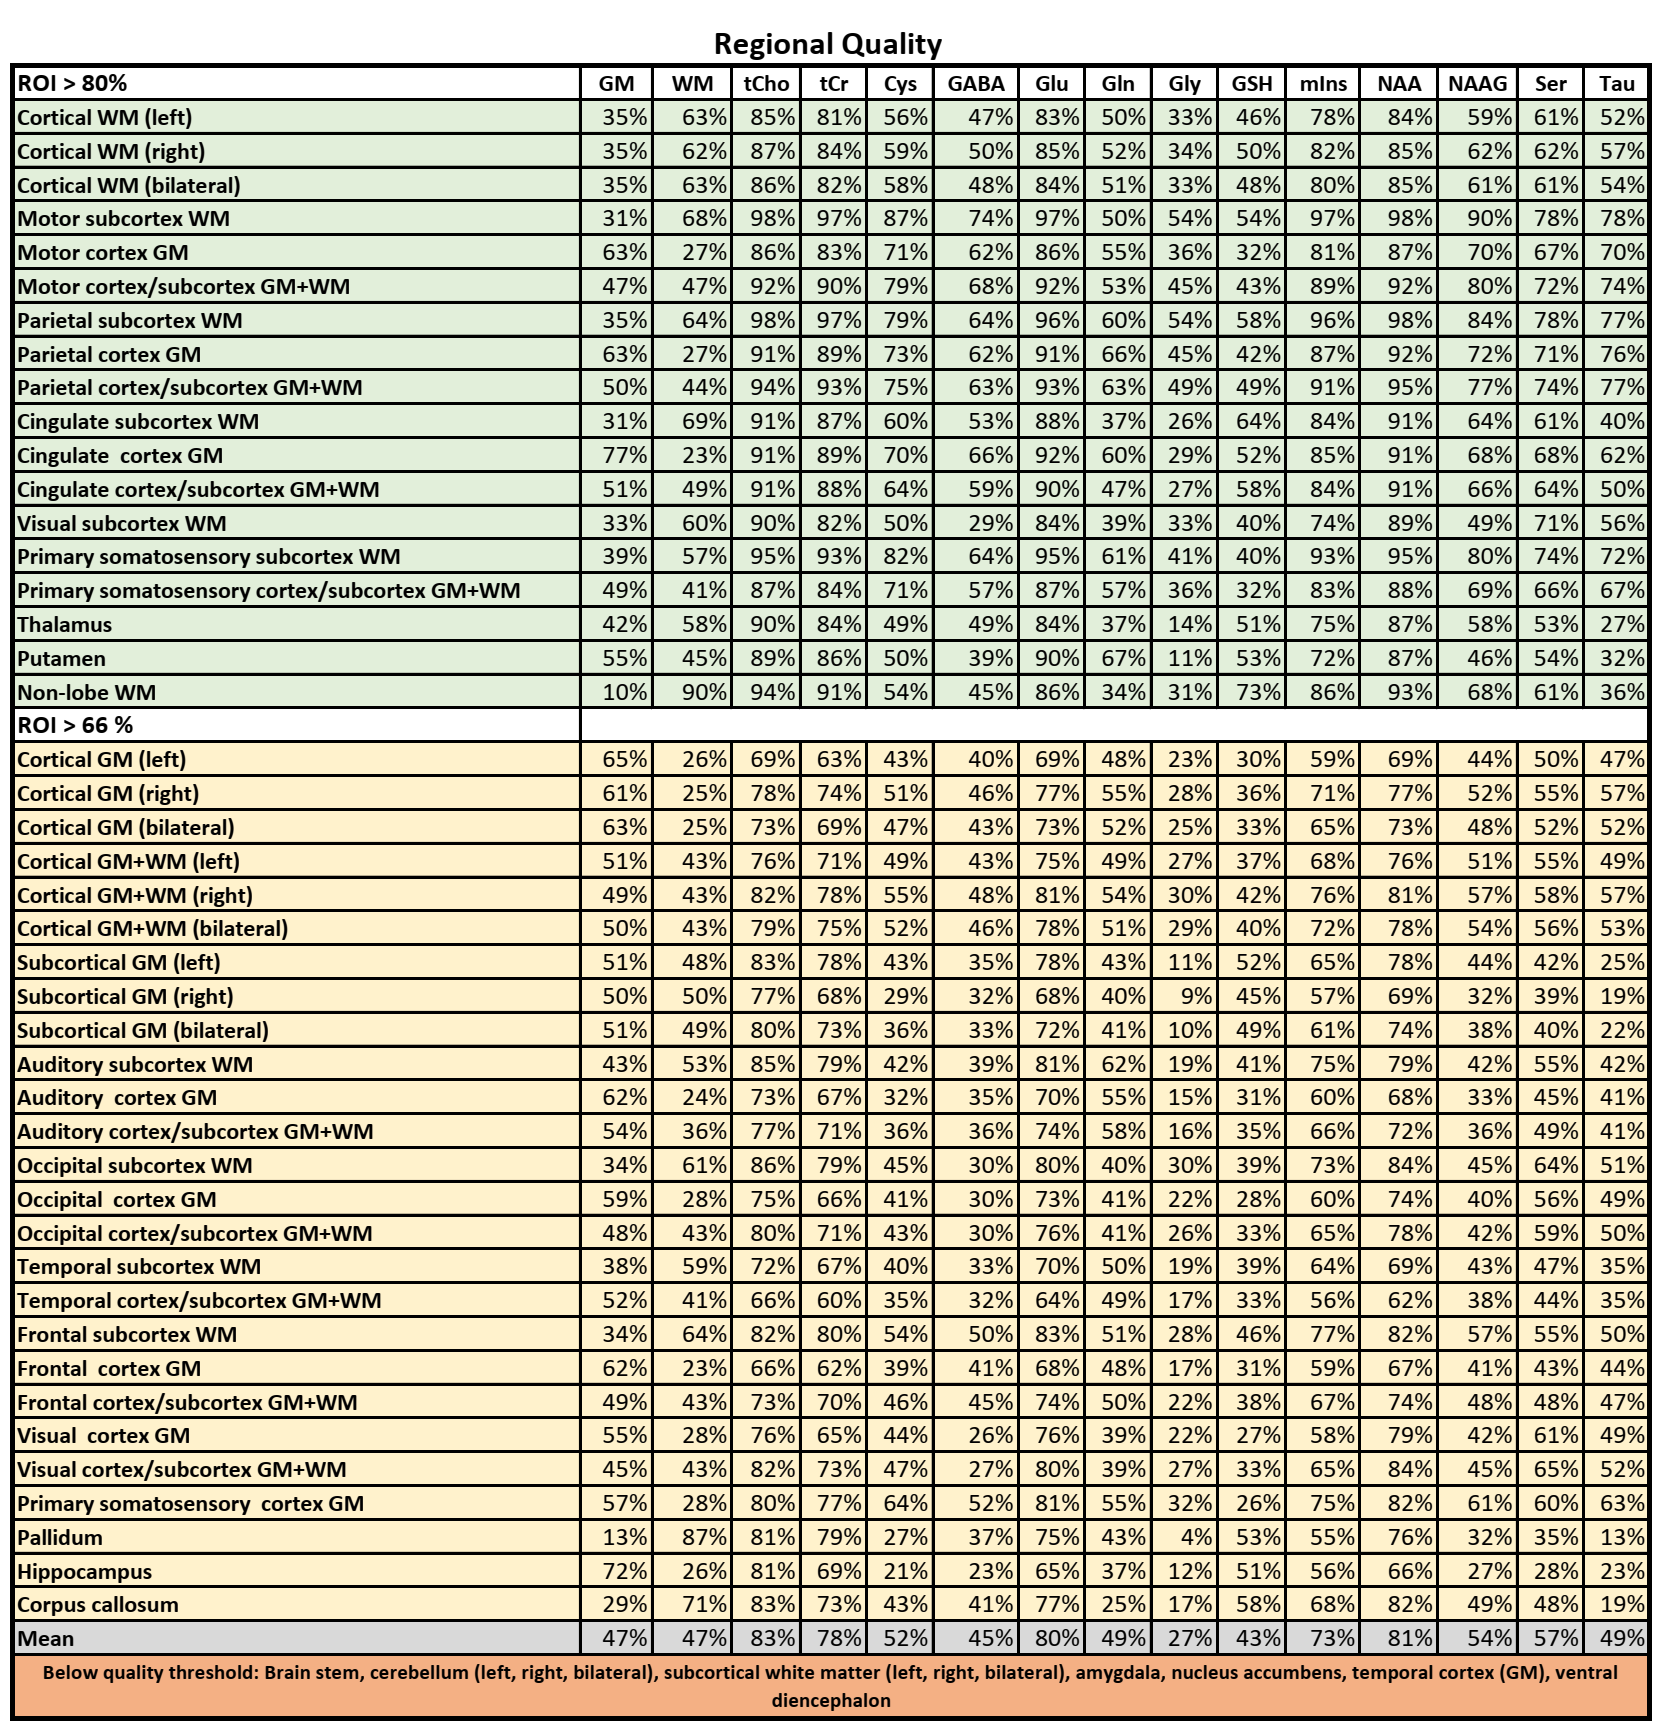
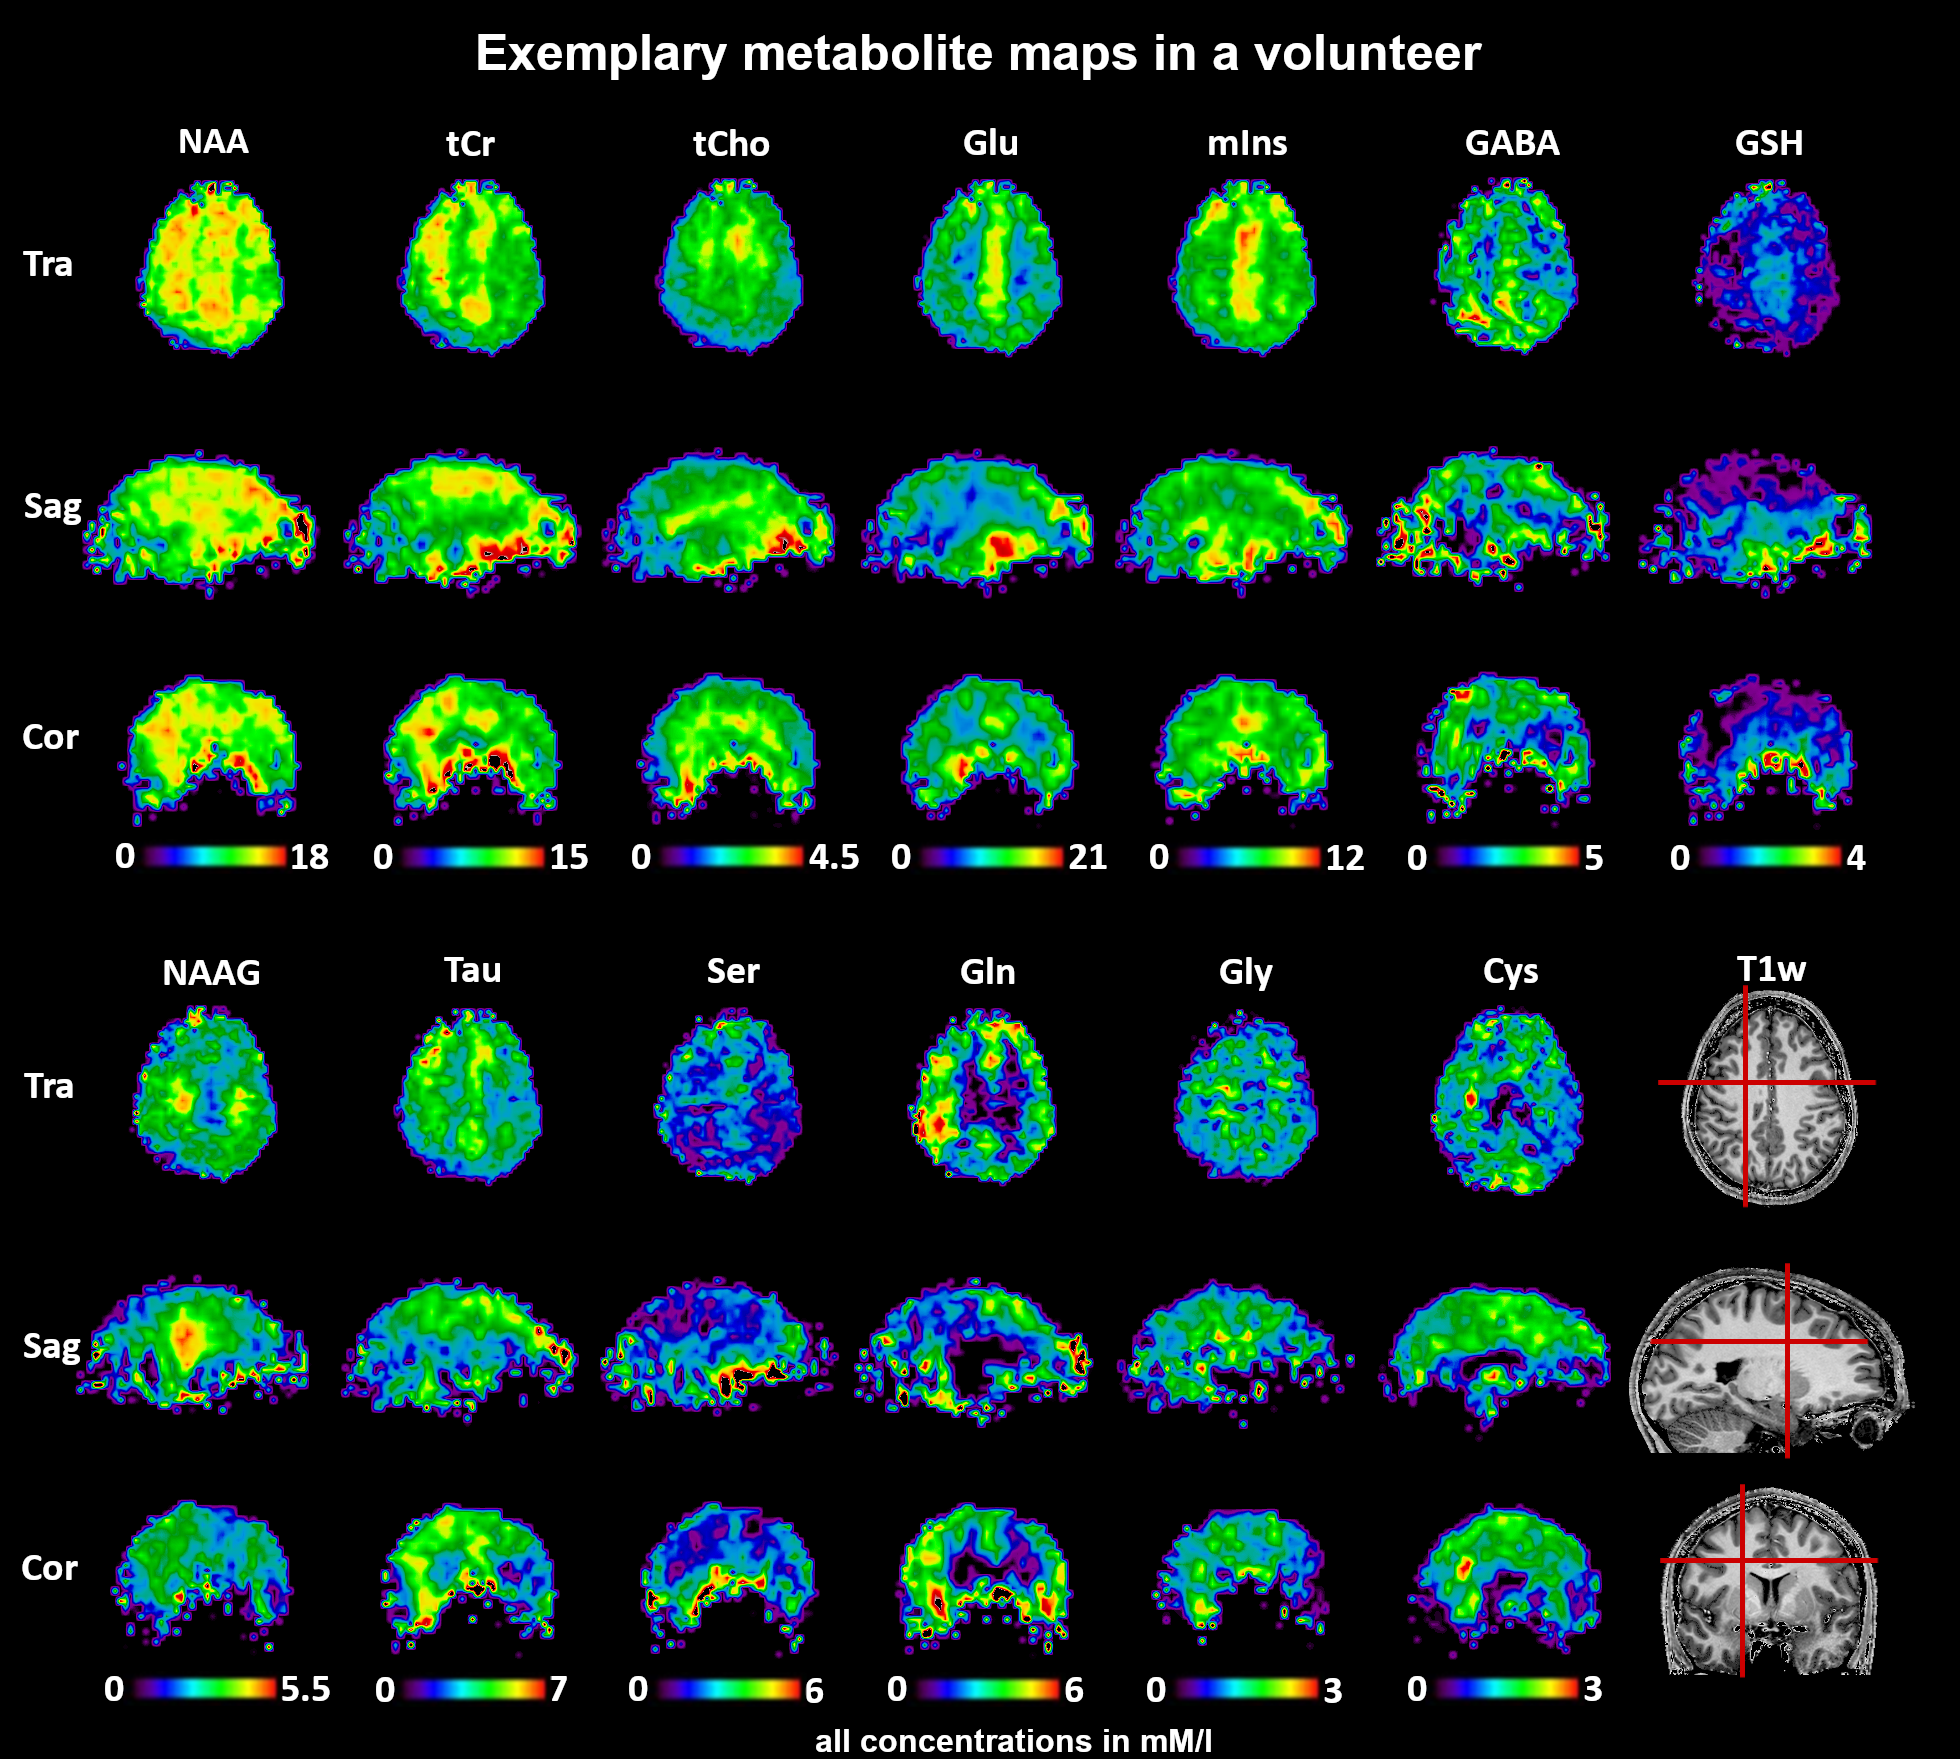
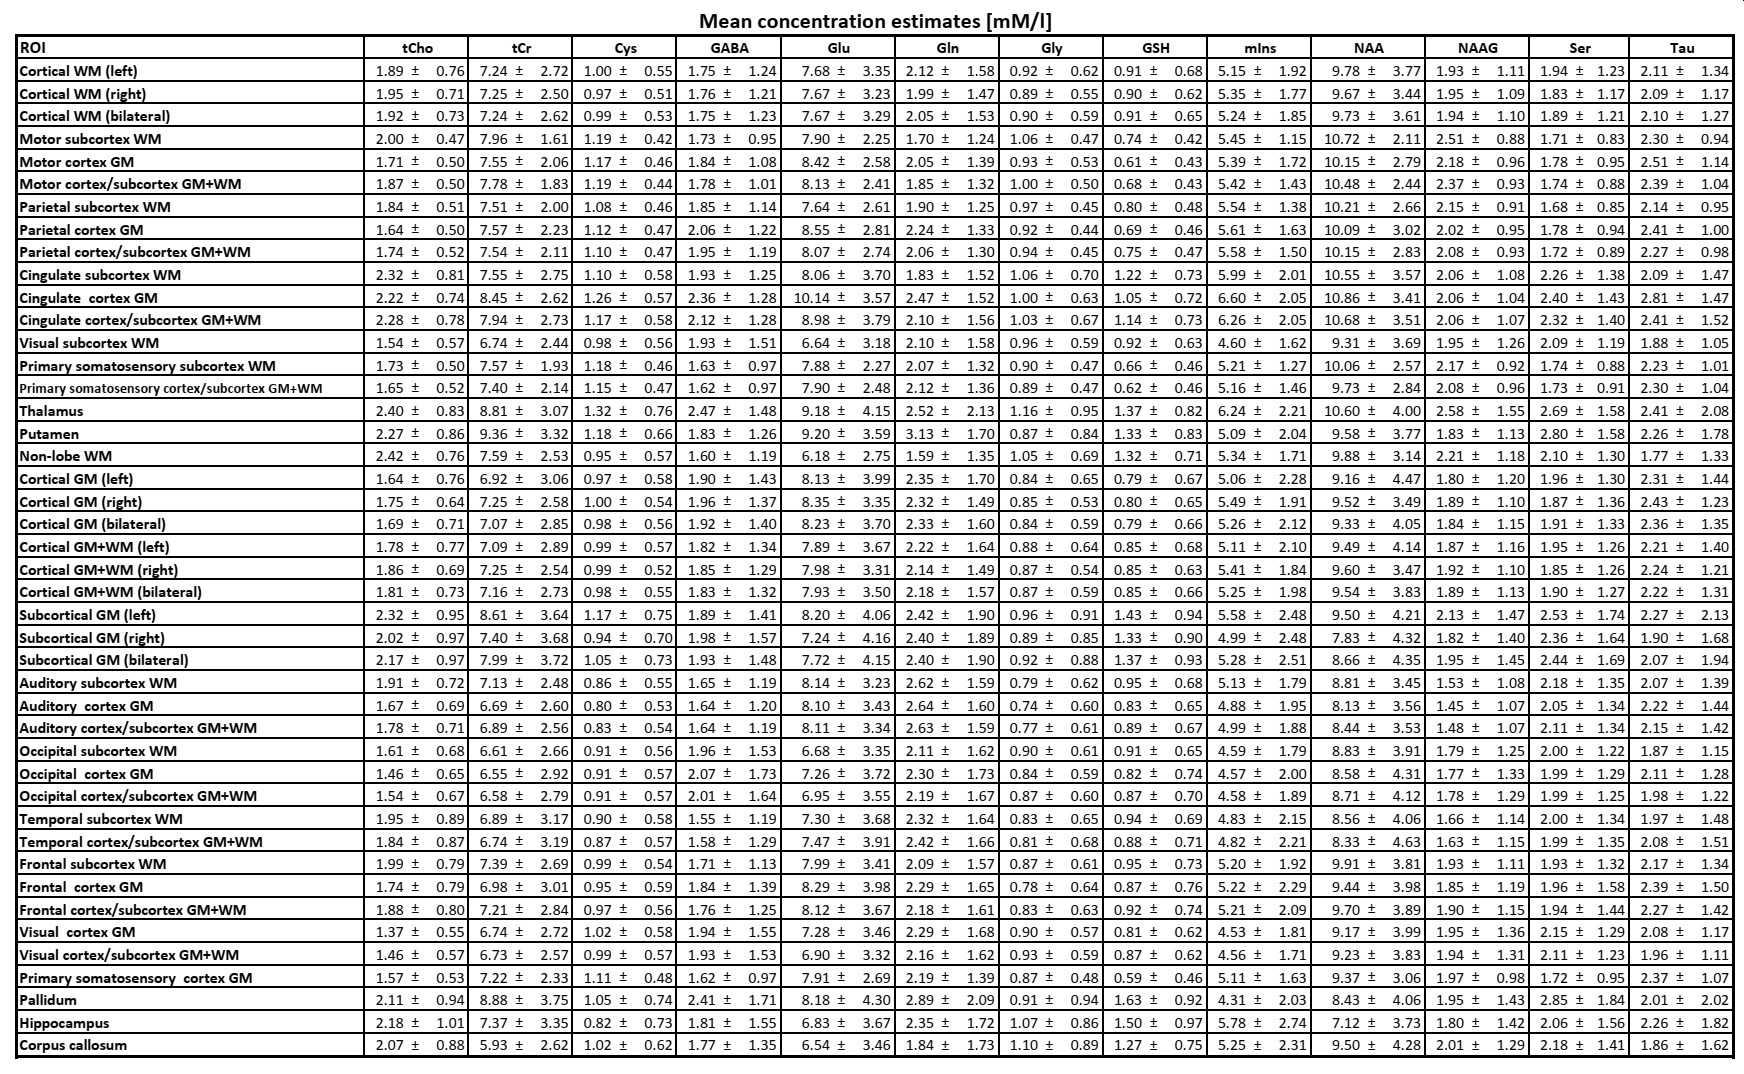
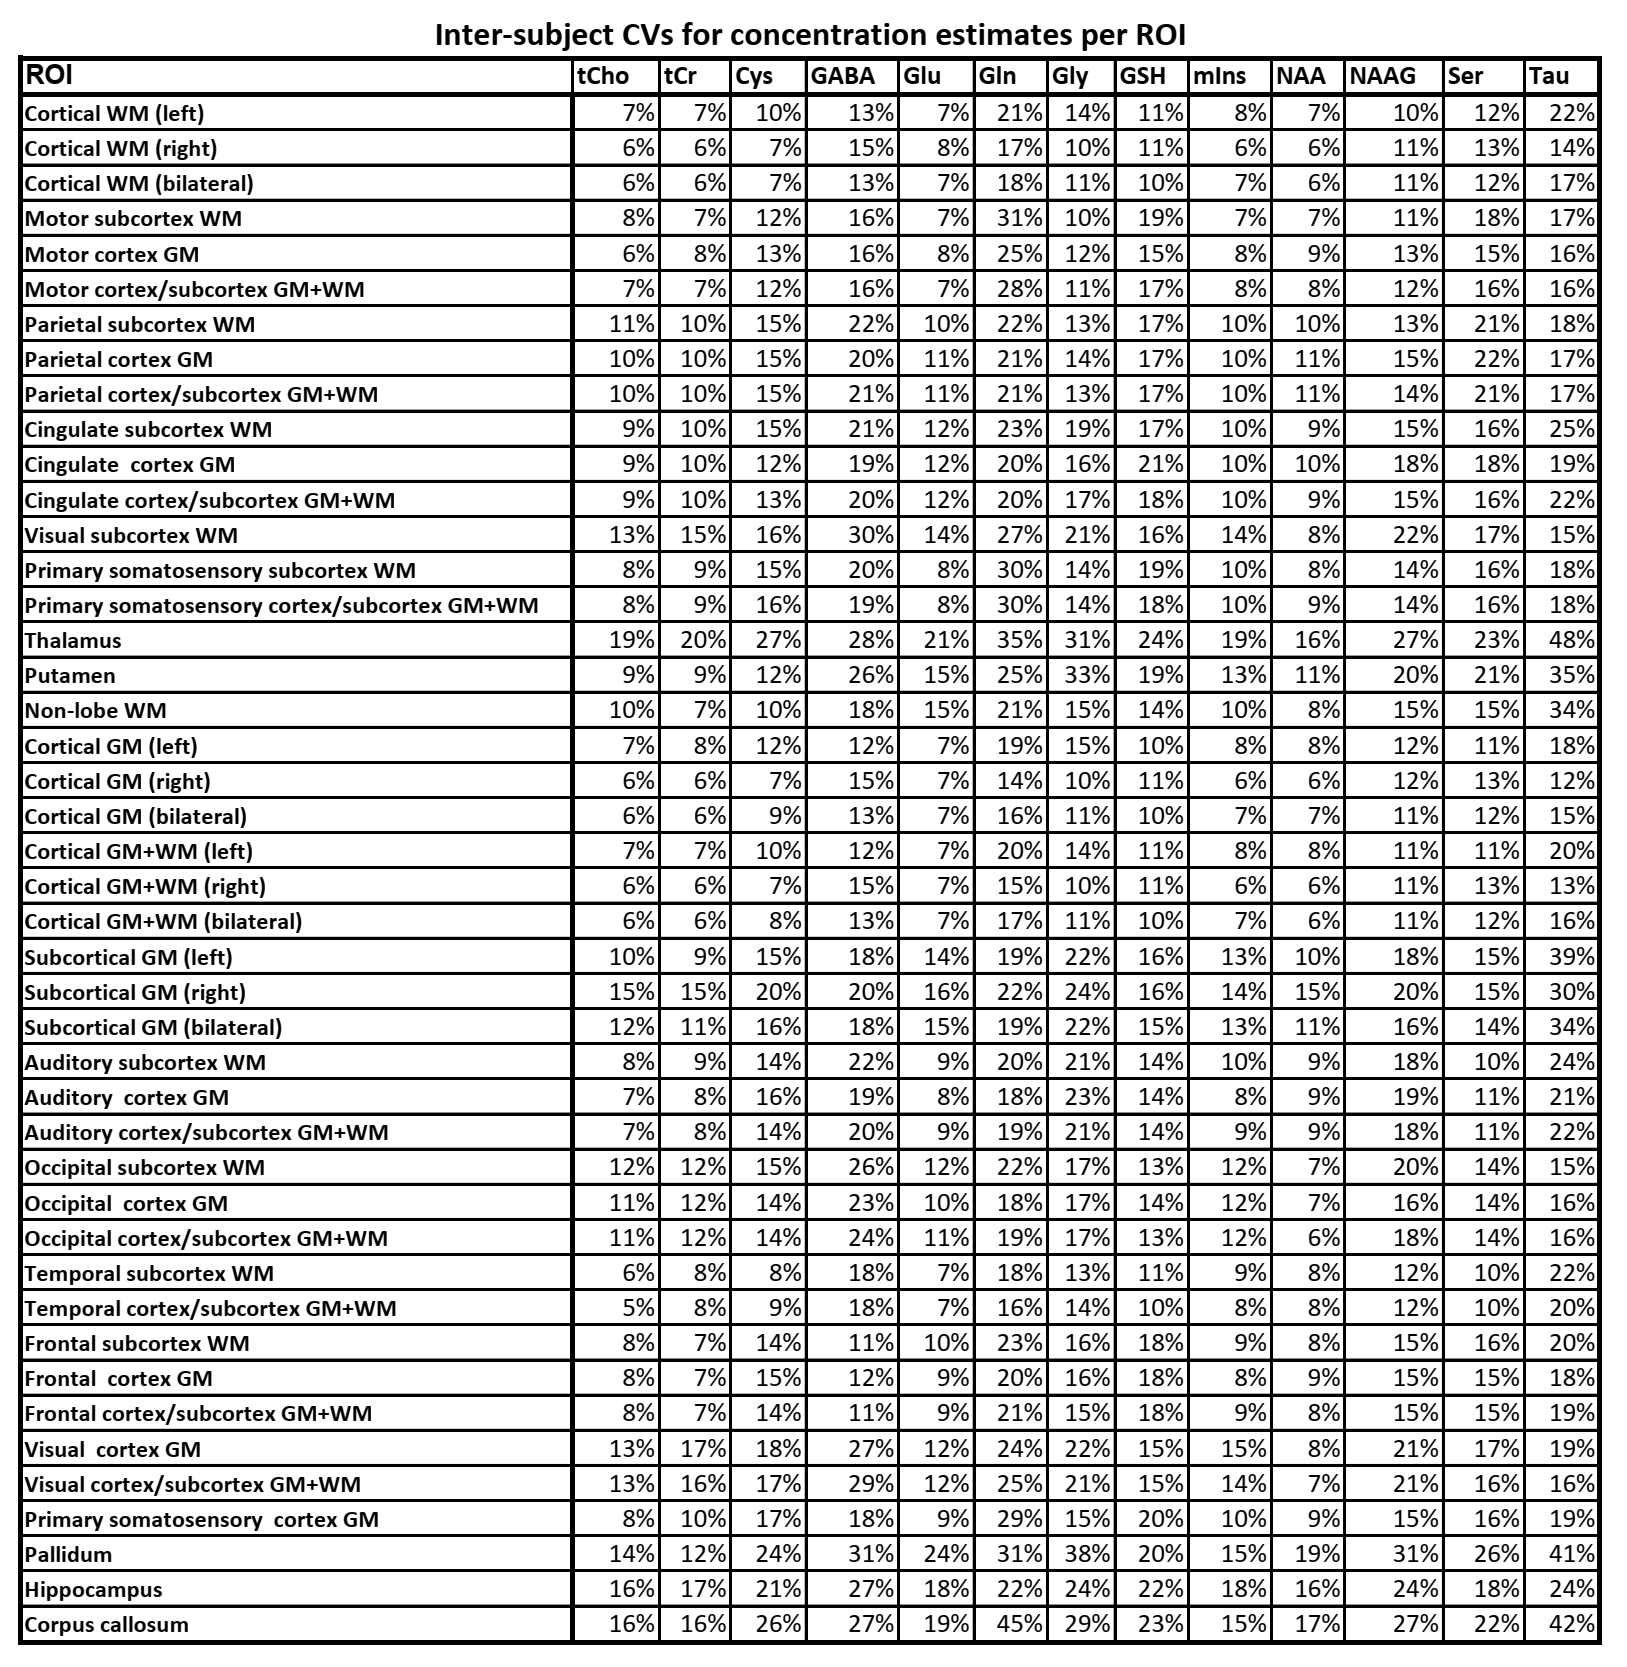
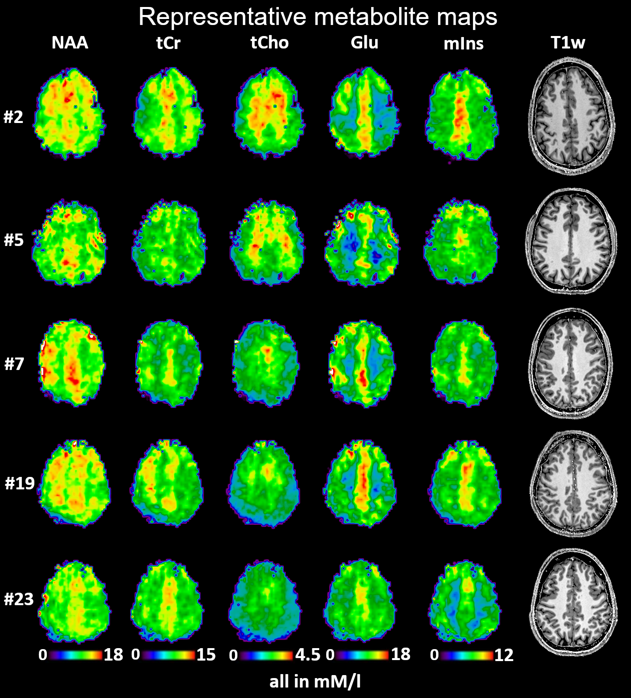
23 of 24 volunteer scans were rated usable, and we classified the concentrations of 13 metabolites in 44 regions as successfully estimated (Fig.1). 18 ROIs had >80% and 26 79-66% of accepted voxels. The voxel percentage passing the CRLB criteria was highest for tCho/tCr/Glu/mIns/NAA. The 11 rejected regions were lower in the brain, small, or close to the nasal cavities/eyes. Examples of all mapped metabolites are presented in Fig.2. The concentration estimates in 44 evaluated ROIs are presented in Fig.3. The minimum and maximum obtained mean concentration estimates in mM/l were 1.37-2.42 for tCho, 5.93-9.36 for tCr, 0.80-1.32 for Cysteine (Cys), 1.55-2.47 for γ-aminobutyric acid (GABA), 6.18-10.14 for glutamate (Glu), 1.59-3.13 for glutamine (Gln), 0.76-1.16 for glycine (Gly), 0.59-1.63 for glutathione (GSH), 4.31-6.60 for mIns, 7.12-10.86 for NAA, 1.45-2.58 for N-acetylaspartyl glutamate (NAAG), 1.68-2.85 for serine (Ser), and 1.77-2.81 for taurine (Tau). We found a high variability between ROIs. Inter-subject CVs as presented in Fig.4 show a good comparability of the regional analyses between subjects for most cases, generally being in the range of 10-20%, with tCho/tCr/Glu/mIns/NAA CVs often ≤10%. Exemplary maps of tCho/tCr/Glu/mIns/NAA in five volunteers further illustrate this in Fig.5.Discussion
We successfully improved the quantification pipeline and evaluation of MRSI results in order to better establish the reproducibility of our MRSI sequence. While not all ROIs could be quantified sufficiently due to inherent 7T limitations, we obtained data on 13 metabolites in 44 ROIs. Compared to human in vivo MRS(I) literature (e.g. [6-9]), with reported concentrations [in mM/l] of 0.5-4 for tCho, 1.8-14 for tCr, 1.3-3.5 for GABA, 5-12 for Glu, 1-5 for Gln, 1 for Gly, 1.2-2.2 for GSH, 3-9 for mIns, 5-17 for NAA, 0.5-3 for NAAG, and 1.5-2.3 for Tau, our results are generally within the expected range, except for lower GSH. For Ser and Cys, we could not find published human brain MRS concentrations. Regional concentration differences were found, as to be expected. Considering diurnal effects, sex differences, remaining partial volume effects and the assumption of uniform metabolite T1s over the whole brain, our CV results are convincing, with tCho/tCr/Glu/mIns/NAA CVs mostly ≤10%.Future mitigation of B0/B1-field inhomogeneities will be necessary to measure more brain regions reliably. Motion correction techniques could further improve CVs. Expanding to analysis of inter-subject variations would further define the limits of our methods for research and clinical applications. In summary, our research only begins to show the benefits of modern ultra-high-field MRSI for the metabolic imaging of the brain.
Acknowledgements
This study was supported by the Austrian Science Fund (FWF) grants KLI-646, P 30701 and P 34198.References
[1] Hingerl et al., Invest. Rad. 2020, https://doi.org/10.1097/RLI.0000000000000626
[2] Hangel et al., NeuroImage:Clinical 2020, https://doi.org/10.1016/j.nicl.2020.102433
[3] Bilgic et al., MRM 2013, https://doi.org/10.1002/mrm.24399
[4] Near et al., NMR Biomed 2020, https://doi.org/10.1002/nbm.4257
[5] Xin et al, MRM 2013, https://doi.org/10.1002/mrm.24352
[6] Lecocq et al., MRM 2015, https://doi.org/10.1002/jmri.24809
[7] Kreis et al., JMR 1993, https://doi.org/10.1006/jmrb.1993.1056
[8] Dhamala et al., NMR Biomed 2019, https://doi.org/10.1002/nbm.4058
[9] Volk et al., HBM 2018, https://doi.org/10.1002/hbm.24225
Figures