0337
High Resolution Volumetric Diffusion-Weighted MRSI Using A Subspace Approach1Department of Bioengineering, University of Illinois Urbana-Champaign, Urbana, IL, United States, 2Beckman Institute for Advanced Science and Technology, Urbana, IL, United States
Synopsis
Diffusion-weighted MRSI (DW-MRSI) promises to significantly expand the capability of in vivo tissue microstructural imaging by simultaneously measuring the diffusion properties of several molecules other than water. However, the applications of DW-MRSI have been mostly limited to either single voxels or 2D experiments with very low resolutions due to several fundamental technical challenges. We describe here a novel method to achieve 3D DW-MRSI with an unprecedented combination of speed, resolution and SNR, by synergizing a special fast sequence and subspace-based processing. We successfully demonstrated high-SNR DW-MRSI of the brain and metabolite-specific ADC maps with the highest ever resolution (3.4×3.4×5.3 mm3).
Introduction
Diffusion-weighted MRSI (DW-MRSI) promises to significantly enhance in vivo tissue microstructural imaging by simultaneously measuring the diffusion properties of several molecules localized in specific tissue components1-4. This unique capability provides rich compartment-specific5 and cell-specific microstructural information and potentially new disease biomarkers6-7. However, DW-MRSI studies have been largely limited to single voxels or very low resolutions in basic science and clinical applications8-10. This is because of the low sensitivity of MRSI and the extra SNR loss induced by diffusion encoding (DE), the high-dimensional imaging problem involving spatial, spectral, and diffusion dimensions, and the susceptibilities to system instability and physiological motions3-4. While several fast acquisition methods have been proposed to accelerate DW-MRSI9-10, the performance remains limited (e.g., >1cm3 resolution, single slices, and long imaging time)8-10. We propose a novel method to enable high-resolution 3D DW-MRSI in a clinically relevant time, by synergizing a fast sequence with interleaved navigators and subspace-based processing11. We have evaluated the proposed method using in vivo experiments and demonstrated high-SNR DW-MRSI of the brain and metabolite-specific ADC maps with the highest ever resolution (3.4×3.4×5.3 mm3).Methods
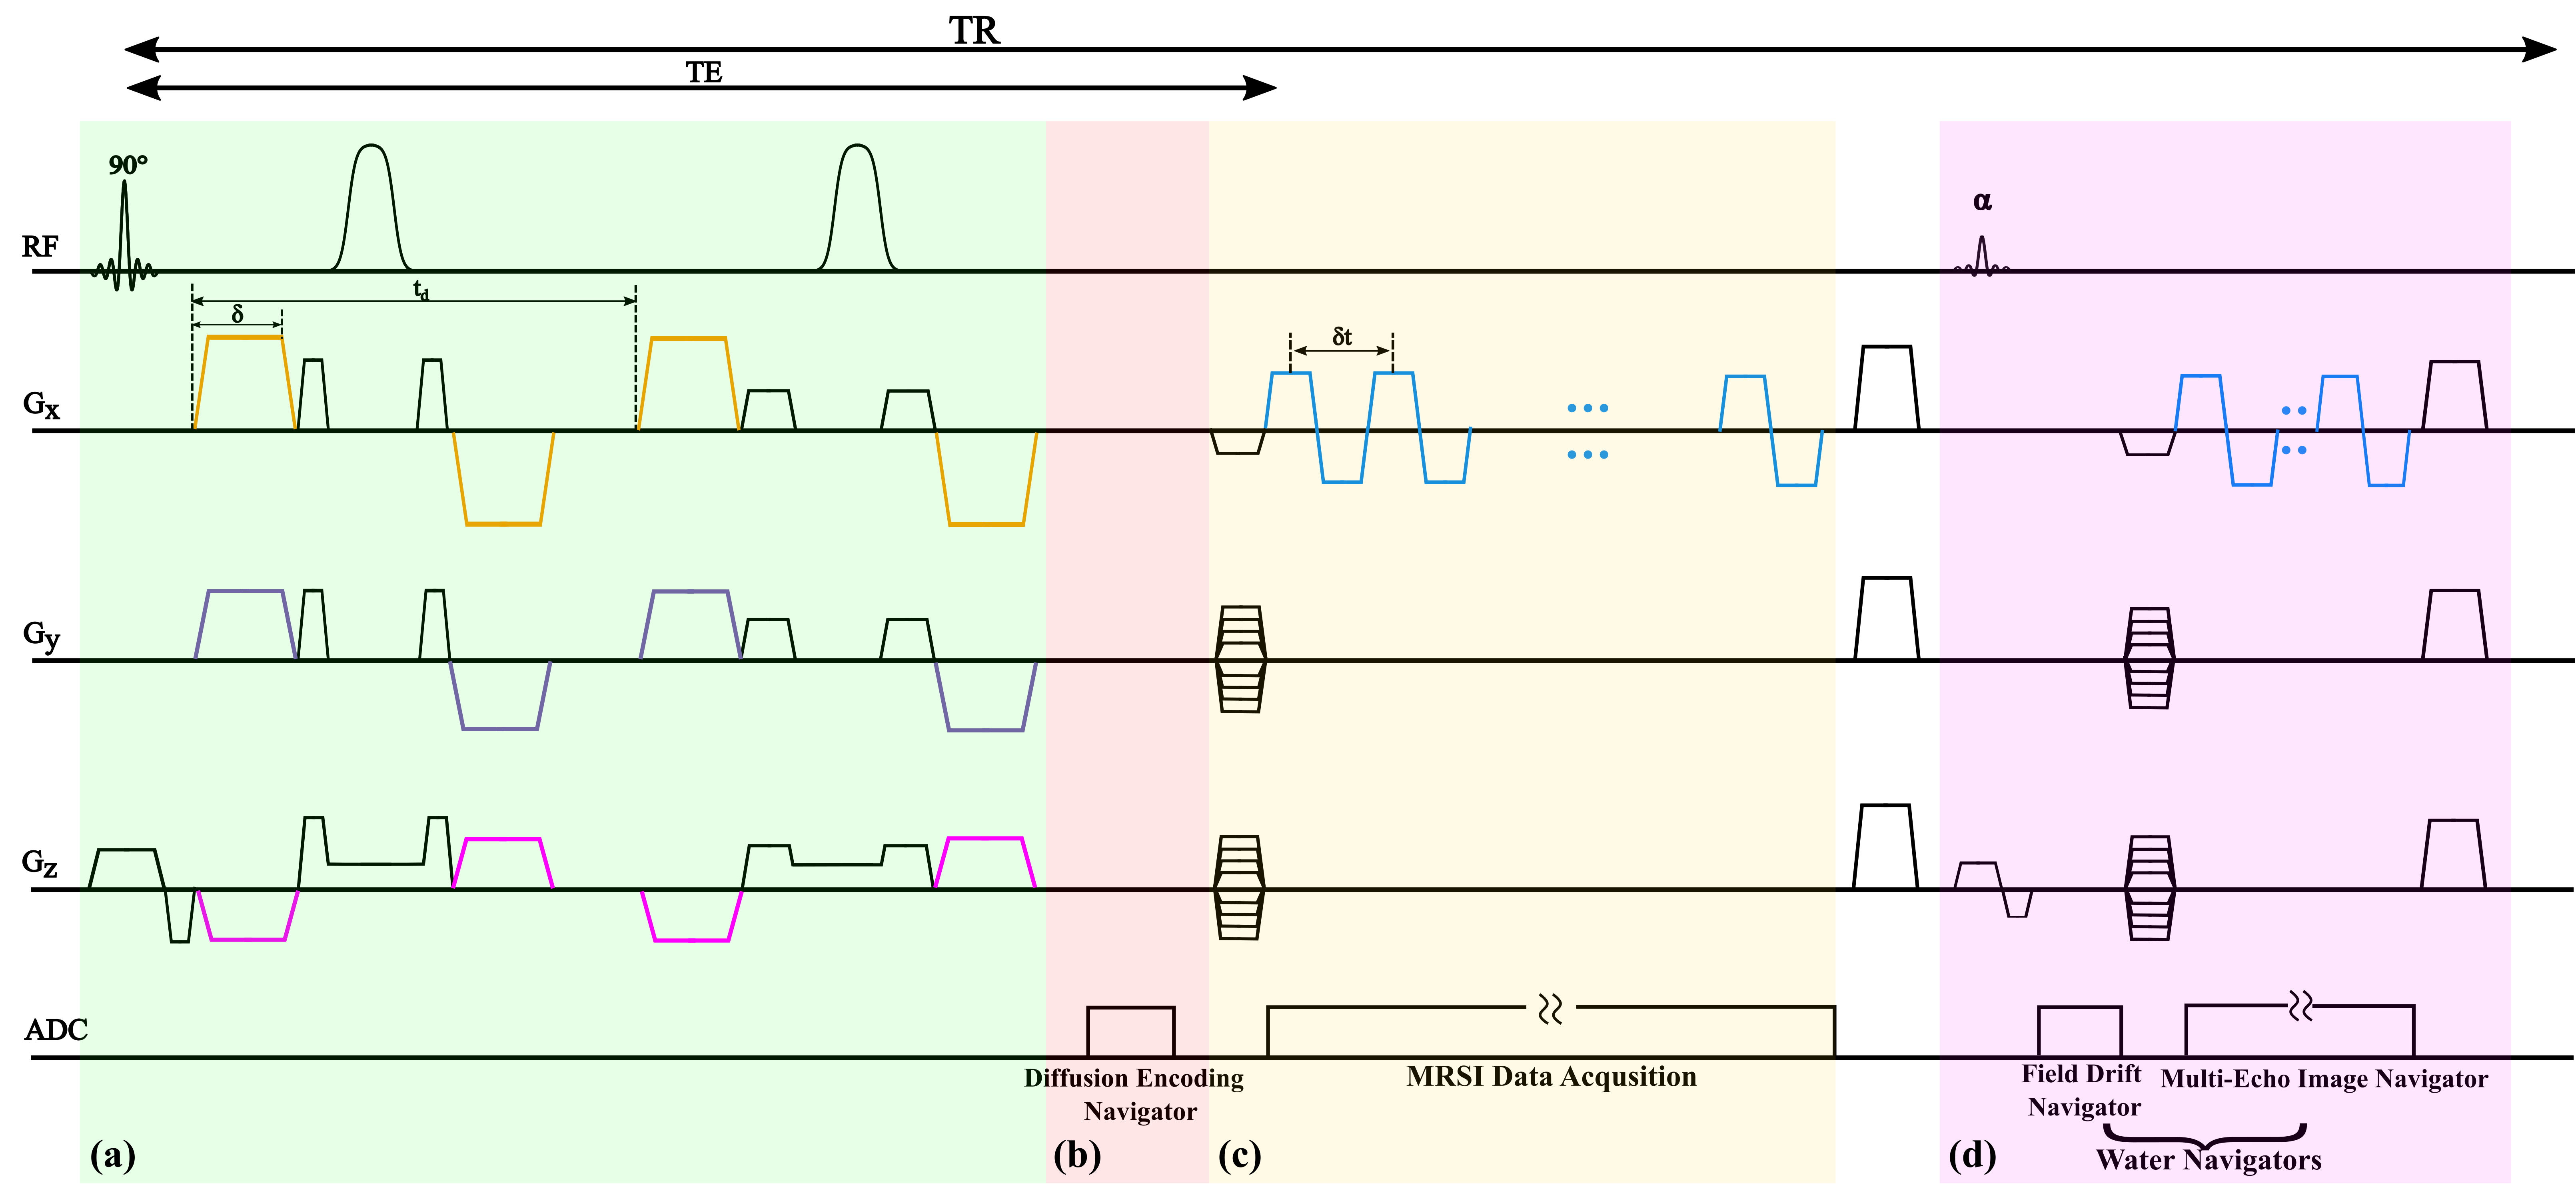
Data Acquisition: Acquiring high-resolution 3D DW-MRSI data in a clinically relevant time is rather challenging because of the additional encoding dimension, SNR consideration, the requirement of stronger DE gradients, and susceptibility to system instabilities and subject motions. Our proposed acquisition strategy addresses these issues by integrating a set of special features (illustrated in Fig.1). First, we adapted a recently proposed SPICE-based fast spatial-spectral encoding design with sparse (k,t)-space sampling capability to achieve rapid data collection with extended k-space coverage11-12. Second, we used a combination of slab-selective excitation and an adiabatic refocusing pulse pair to minimize chemical-shift displacement errors (CSDEs) for spin-echoes while achieving excellent cortical coverage. Third, bipolar DE gradients were integrated into the refocusing scheme to realize large b-values without dramatically lengthening TEs13. Finally, several navigators were interleaved to allow for tracking and correcting phase inconsistencies induced by system instabilities and microscopic physiological motions while maximizing acquisition efficiency in each TR.Data Processing: The proposed acquisition poses unique challenges for data processing, specifically, the problems of nuisance signal removal (NSRM) (compared to localized single voxels) and reconstruction from the high-resolution, noisy data. To this end, we proposed to use a union-of-subspaces (UoSS) model14-16 to represent the high-dimensional DW-MRSI function of interest $$$\rho(\textbf{r},t,\textbf{b})$$$ as :
$$
\rho(\textbf{r},t,\textbf{b}) = \sum_{\textit{lw}=1}^{L_w}u_{lw}(\textbf{r},\textbf{b})\phi_{lw}(t) + \sum_{\textit{lf}=1}^{L_f}u_{lf}(\textbf{r},\textbf{b})\phi_{lf}(t) + \sum_{\textit{lm}=1}^{L_m}u_{lm}(\textbf{r})\phi_{lm}(t,\textbf{b}),[1]
$$
where $$$\phi_{lw}(t)$$$,$$$\phi_{lf}(t)$$$ are the water and lipid subspaces, respectively. $$$\phi_{lm}(t,\textbf{b})$$$ is the multi-b-value metabolite subspace($$$\textbf{b}$$$ denoting the DE space) and $$$u_x(\cdot)$$$ the corresponding spatial coefficients. Note that we proposed to use b-value independent water/lipid subspaces due to the nature of these signals. The multi-b-value metabolite subspace maximizes the representation power while maintaining the low dimensionality for the spatial coefficients15-16. This model significantly reduces the dimensionality of the imaging problem and effectively exploits the correlations in the spectral-diffusion dimensions to enable better signal separation as well as resolution and SNR tradeoffs. Accordingly, we can fit water/lipid signals using these subspace constraints and remove their contributions from the data. The metabolite reconstruction can then be done by solving
$$
\left\{\hat{\textbf{U}},\hat{\textbf{V}}\right\} = \arg\underset{\textbf{U},\textbf{V}}{\min}\left\Vert\textbf{d}-\textbf{F}_{\Omega}\left\{\textbf{B}\odot\textbf{U}\textbf{V}\right\}\right\Vert_{2}^{2} + \lambda \mathcal{R}(\textbf{U}\textbf{V}),[2]
$$
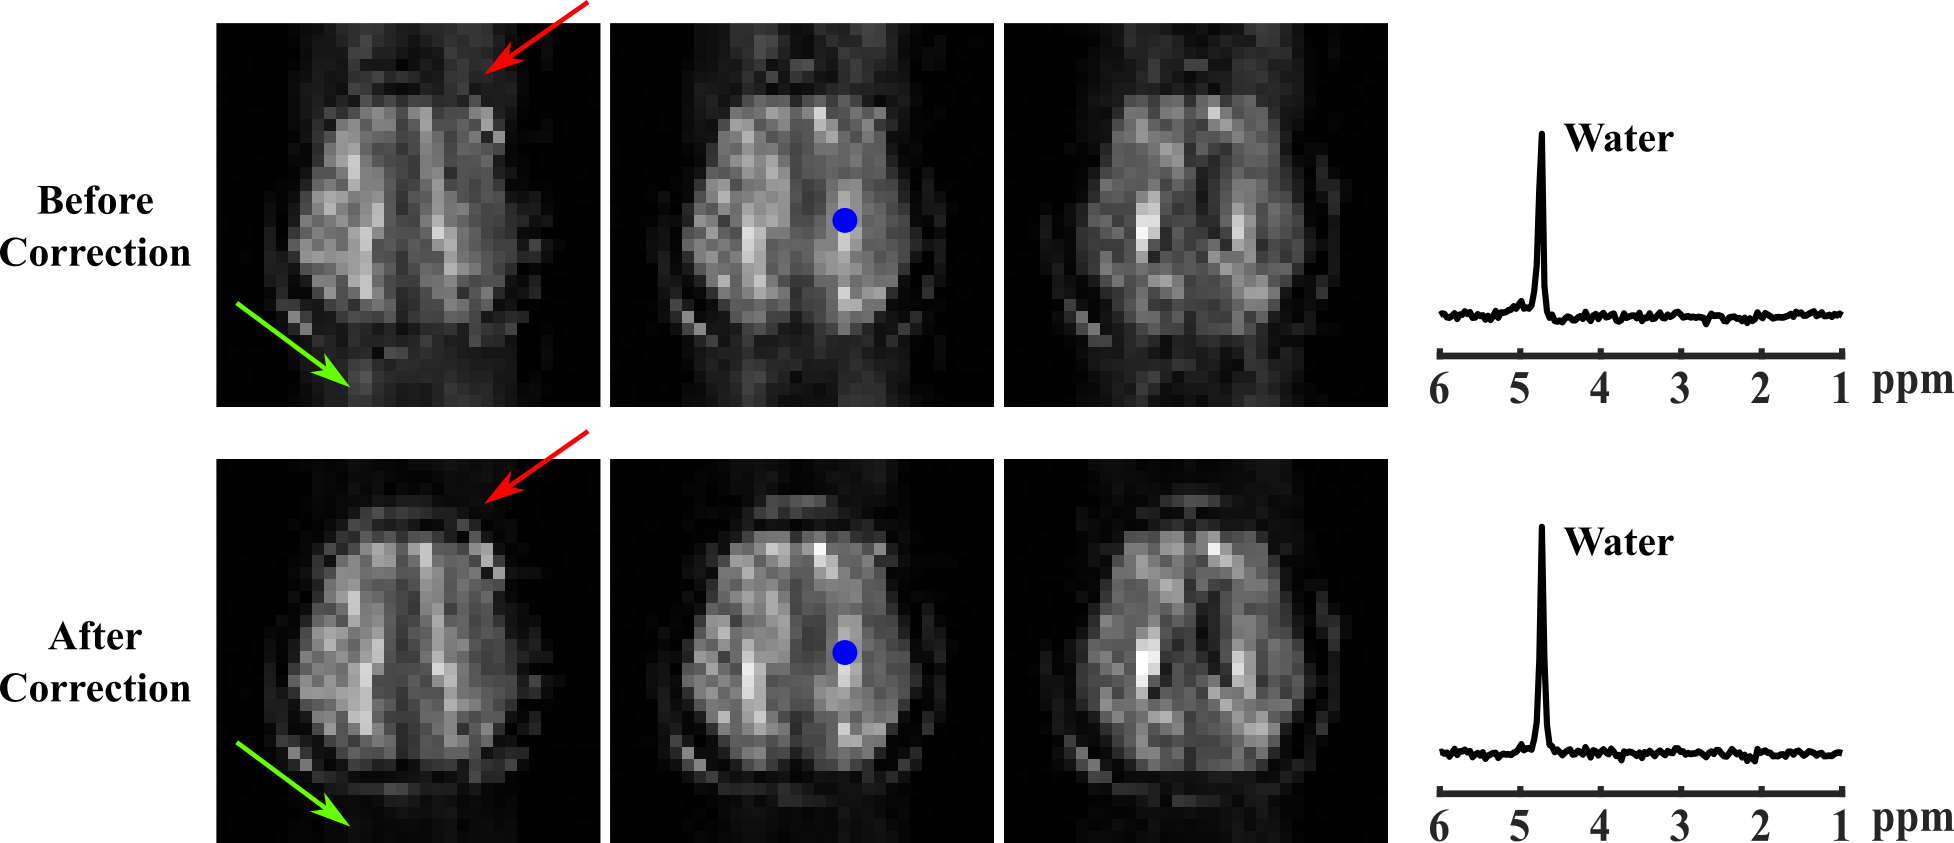
where $$$\textbf{d}$$$ represents the data after NSRM, $$$\textbf{U}$$$ and $$$\textbf{V}$$$ are matrix forms of the spatial coefficients and multi-b-value subspace. $$$\textbf{B}$$$ models the B0 inhomogeneity induced phases and $$$\textbf{F}$$$ the encoding operator with (k,t) sampling pattern $$$\Omega$$$ . $$$\mathcal{R(\cdot)}$$$ is a spatial-spectral regularization function with parameter $$$\lambda$$$ (e.g., joint sparsity)16. We predetermined $$$\textbf{V}$$$ from lower-resolution/higher-SNR data for reconstructing higher-resolution data with spatial-temporal undersampling11-12. Phase discrepancies were extracted from both the DE and field drift navigators (Fig. 1) and corrected before NSRM. Figure 2 illustrates the correction effects (details omitted due to space constraint).
Results
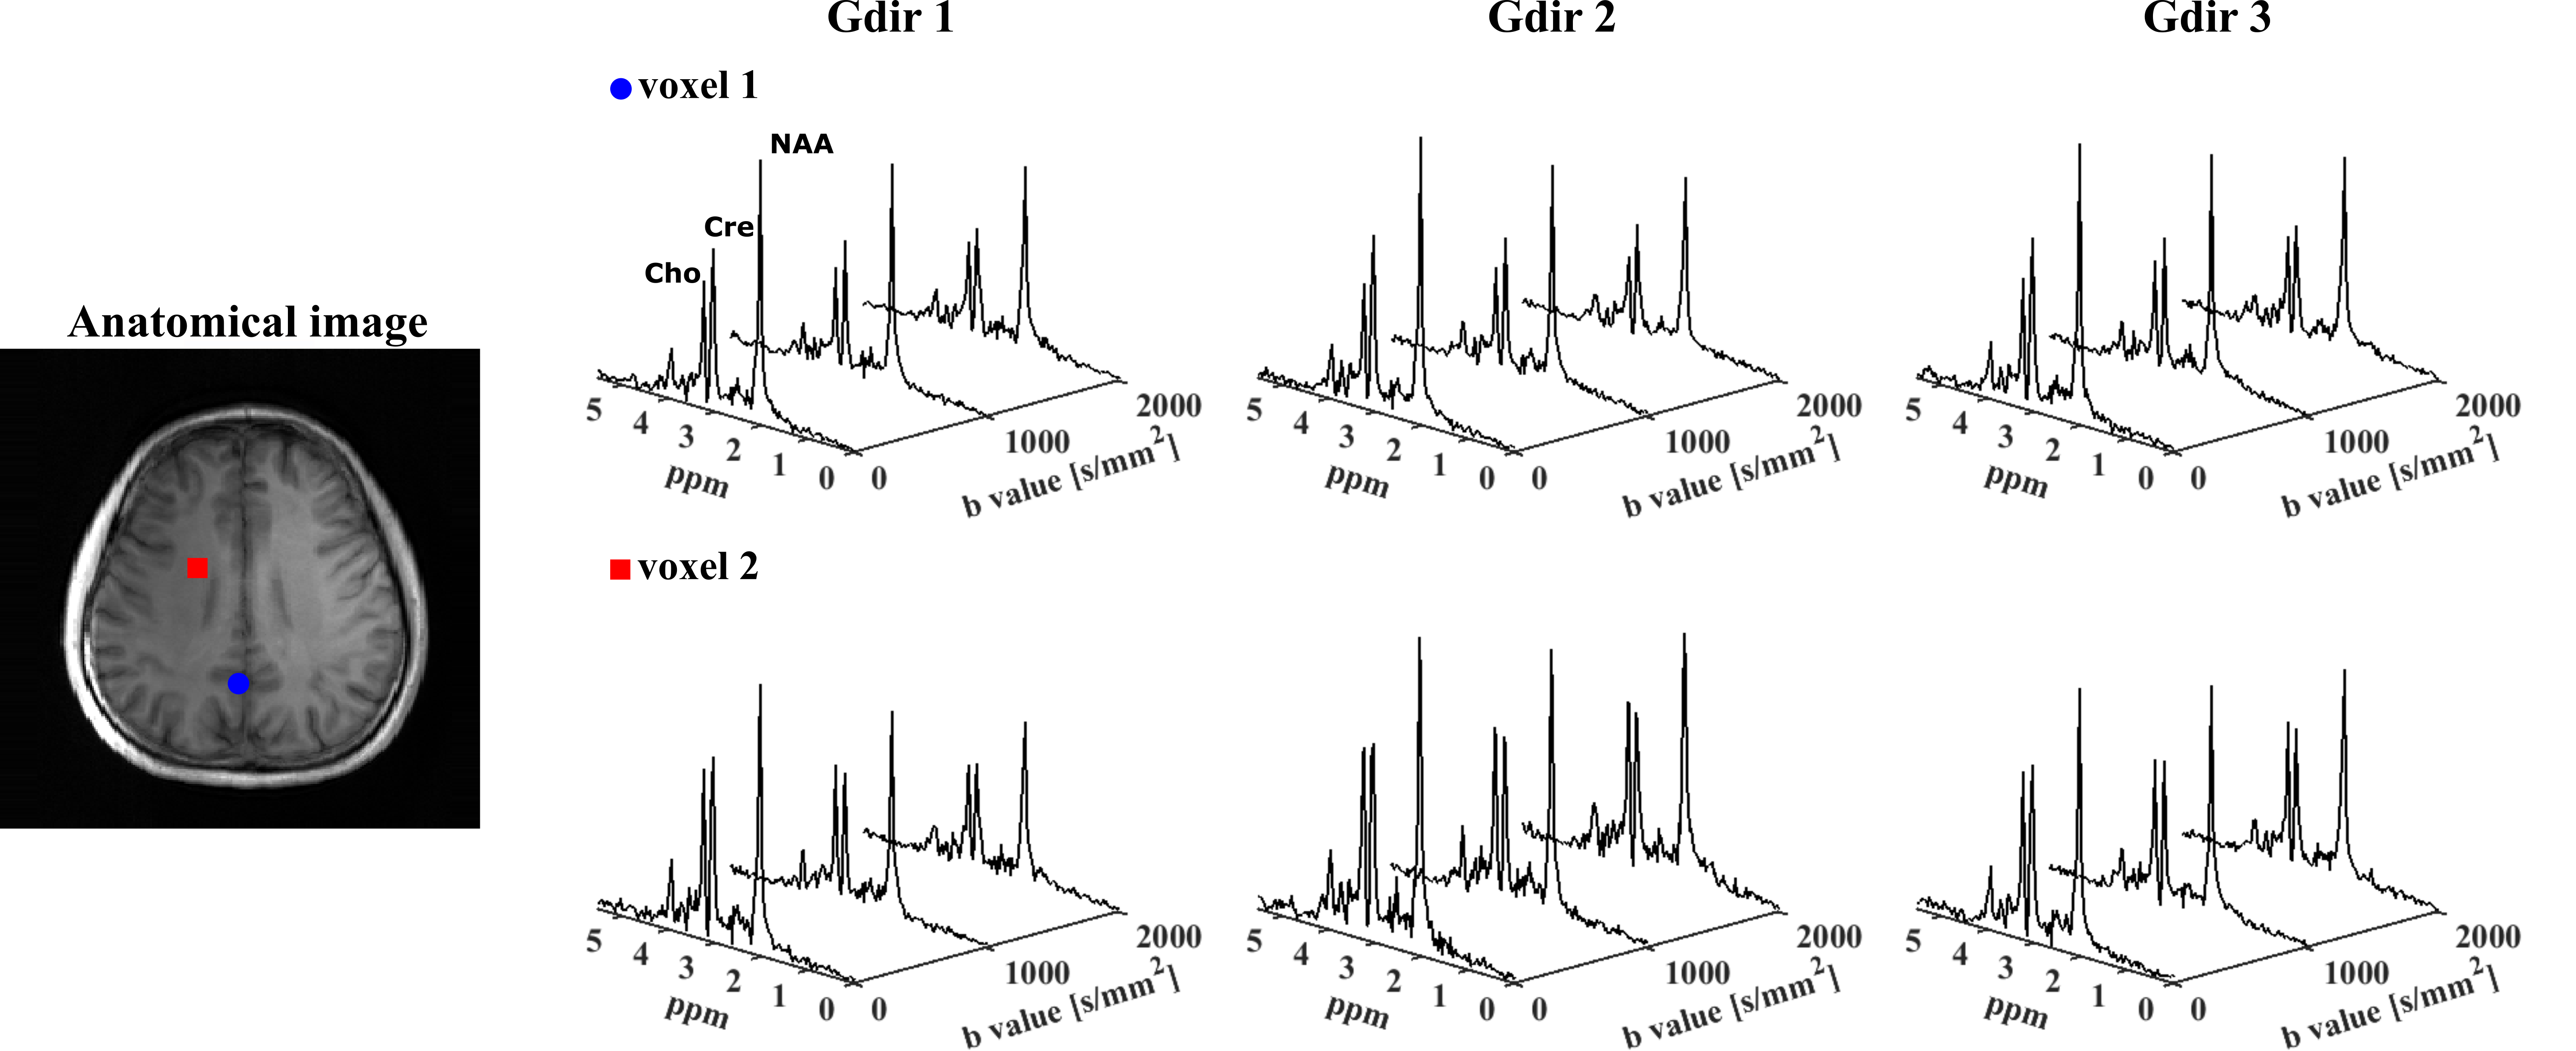
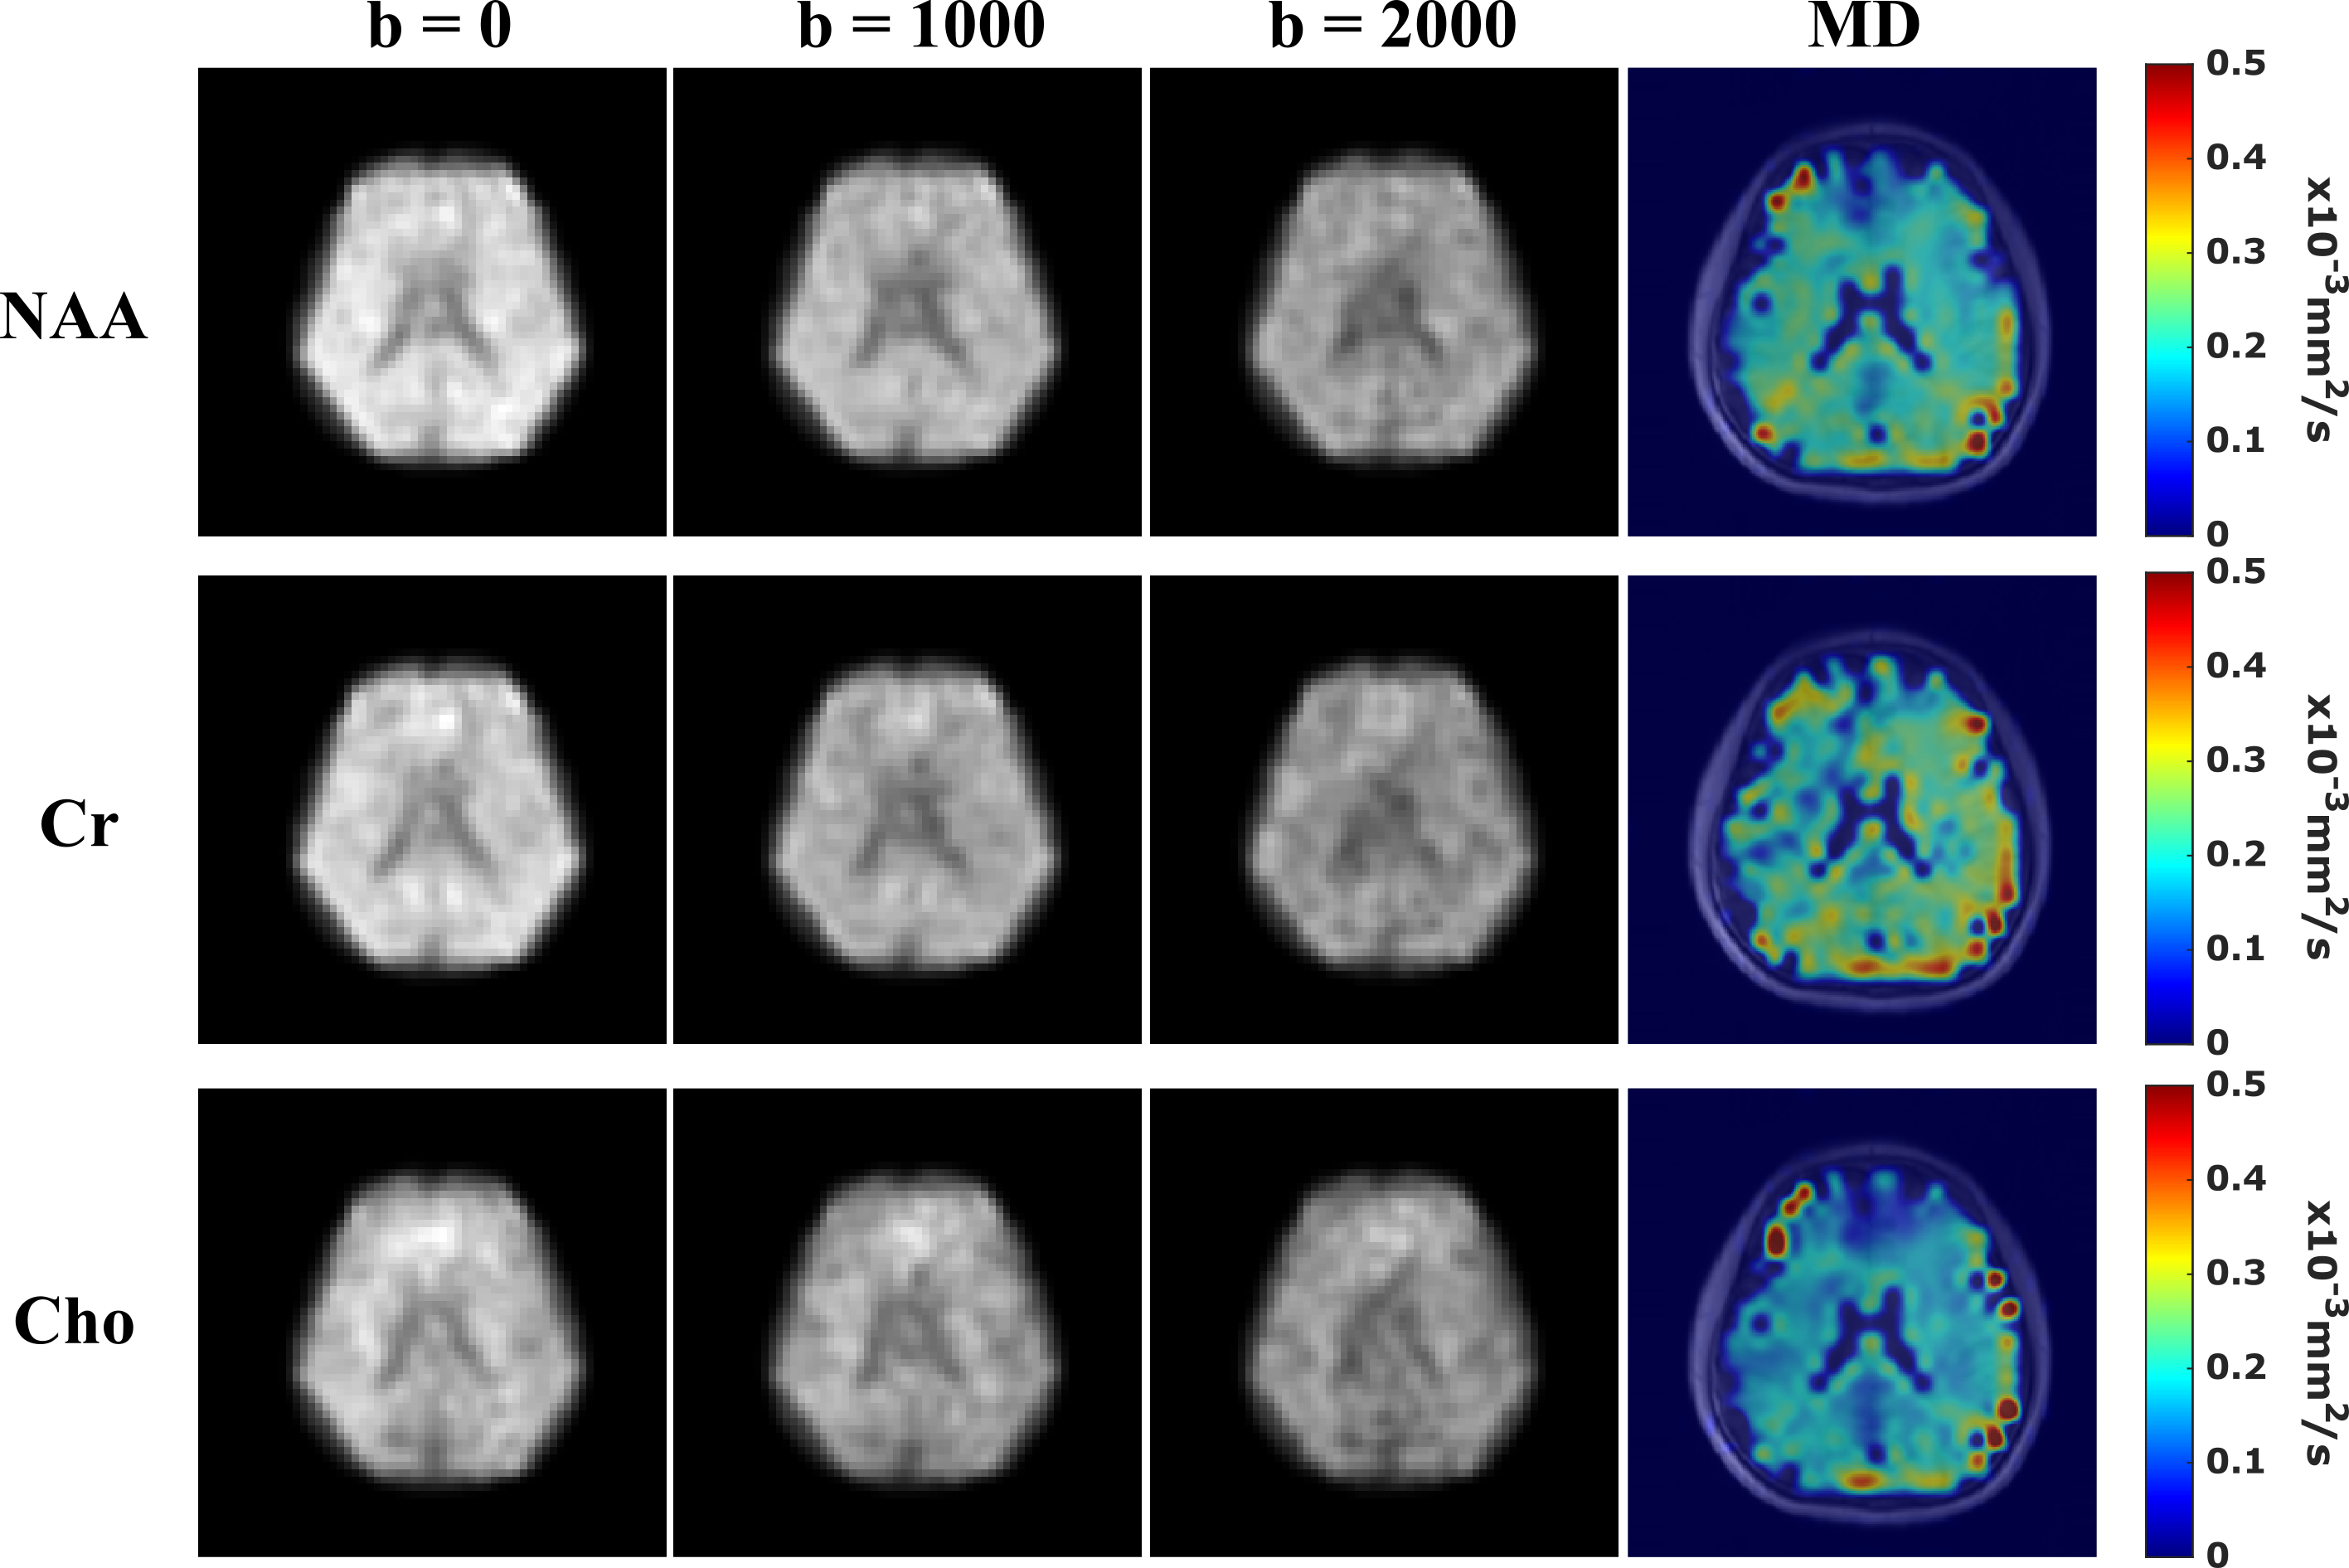
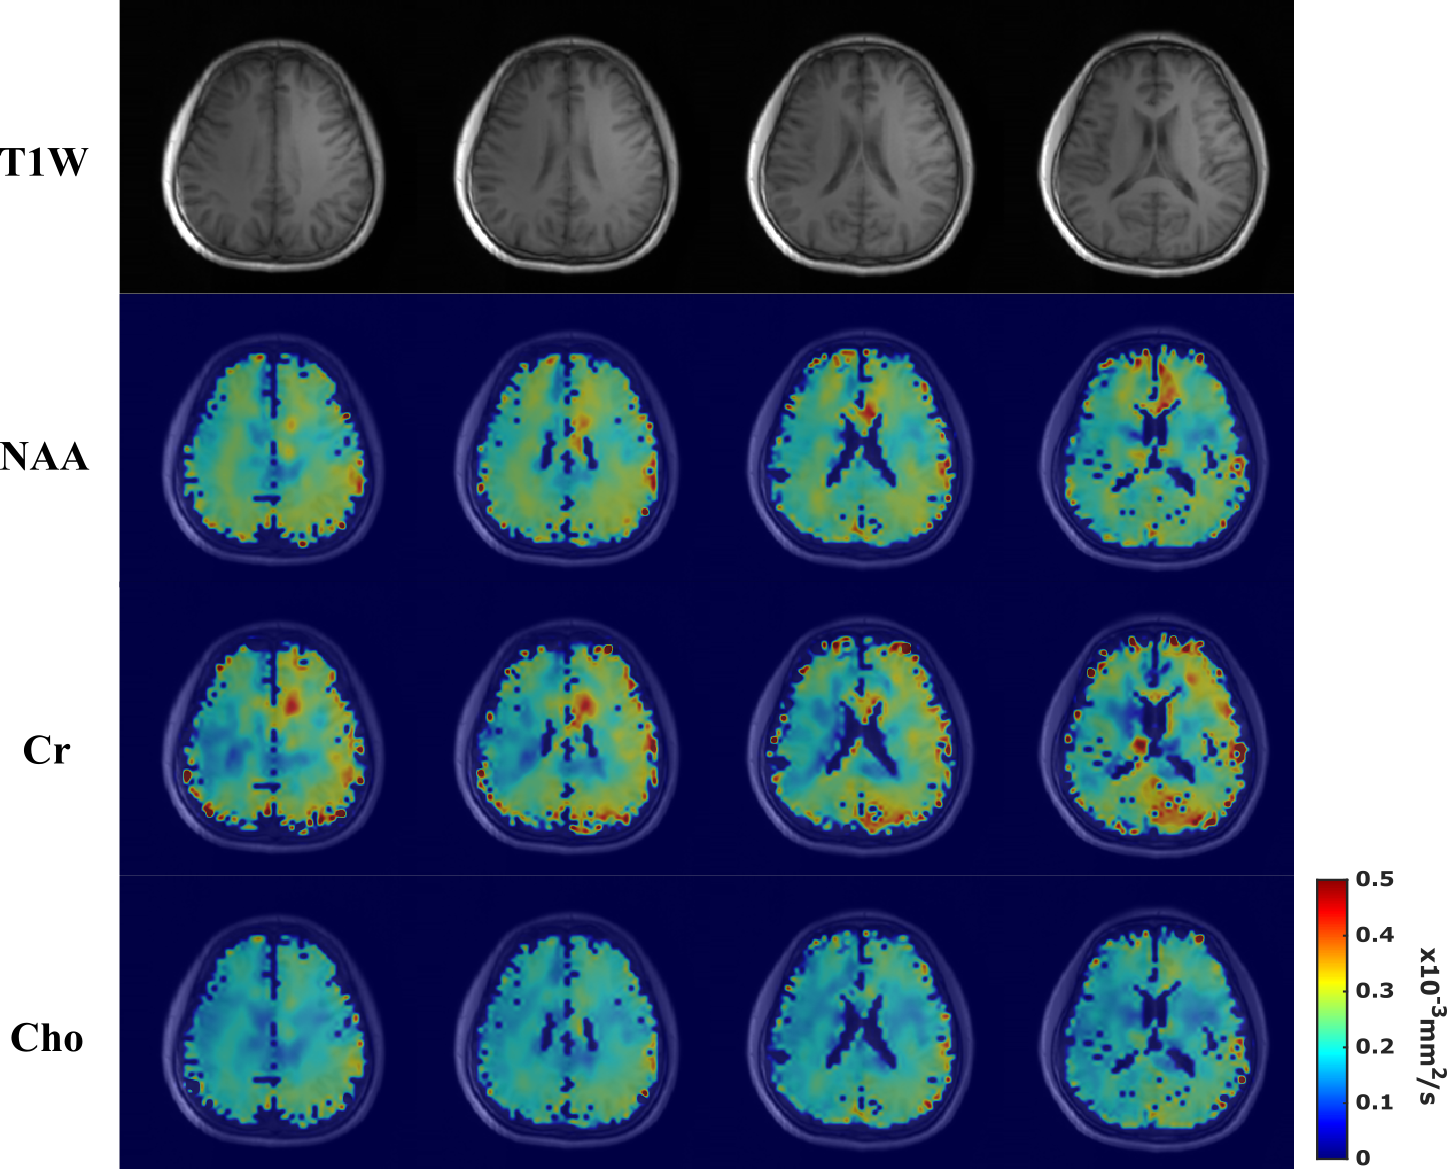
In vivo data were acquired from healthy volunteers on a Siemens Prisma 3T scanner using a 20-channel head coil. Cardiac gating was used to minimize the effects of microscopic tissue displacements due to pulsations (trigger delay = 200ms). Data at different resolutions were acquired with 220×220×64 mm3 FOV, 850/80 ms TR/TE, 167 kHz readout bandwidth, matrix sizes of 32x32x8 (6.9×6.9×8mm3 voxels) or 64x64x12 (3.4×3.4×5.3 mm3 voxels) and 0.8/1.18 ms echo spacing. The DE parameters are b-values = [0,1000,2000] s/mm2, DW gradient duration $$$\delta$$$ = 10 ms, diffusion time $$$t_{d}$$$ = 38.8 ms. For the 32x32x8 data, we acquired 3 orthogonal diffusion directions, i.e.,[Gx,Gy,Gz] = [1,1,-0.5](Gdir1)/ [1,-0.5,1](Gdir2)/ [-0.5,1,1](Gdir3), with ~5mins per b-value. For the 64x64x12 data, only Gdir1 was acquired for the results shown here, taking around 16.5mins(retrospective undersampling, 25mins full acquisition). Figure 3 shows high-quality spatially-resolved DW spectra produced by the proposed method from 6.9×6.9×8mm3 voxels. The DW metabolite maps along with mean diffusivity (MD) maps are shown in Figure 4. High-SNR metabolite ADC maps produced from the 64x64x12 data are shown in Figure 5, demonstrating the capability of the proposed method in mapping microstructural information with unprecedented resolutions.Conclusion
We presented a novel method to achieve high-resolution, 3D DW-MRSI that synergizes fast spatial-spectral encoding and subspace-based processing. High-quality reconstruction and metabolite-specific ADC maps of the human brain were successfully produced. These promising results demonstrate the potential of the proposed method to enable molecule-specific tissue microstructural imaging for various neuroscience and clinical applications.Acknowledgements
No acknowledgement found.References
[1] Le Bihan D, Mangin JF, Poupon C, et al., Diffusion tensor imaging: concepts and applications. J. Magn. Reson. Imaging. 2001;13:534-46.
[2] Basser PJ. Inferring microstructural features and the physiological state of tissues from diffusion‐weighted images. NMR Biomed. 1995;8:333-44.
[3] Ronen I, Valette J. Diffusion‐weighted magnetic resonance spectroscopy. EMagRes. 2007;15:733-50.
[4] Palombo M, Shemesh N, Ronen I, Valette J. Insights into brain microstructure from in vivo DW-MRS. NeuroImage. 2018;182:97-116.
[5] Xiao L and Wu, EX, Diffusion‐weighted magnetic resonance spectroscopy: A novel approach to investigate intramyocellular lipids. Magn. Reson. Med., 2011;66:937-944.
[6] Posse S, Cuenod CA, Le Bihan D. Human brain: proton diffusion MR spectroscopy. Radiology. 1993;188:719-25.
[7] Shemesh N, Rosenberg JT, Dumez JN, et al., Metabolic properties in stroked rats revealed by relaxation-enhanced magnetic resonance spectroscopy at ultrahigh fields. Nature Comm. 2014;5:1-8.
[8] Ercan AE, Techawiboonwong A, Versluis MJ, Webb AG, Ronen I., Diffusion‐weighted chemical shift imaging of human brain metabolites at 7T. Magn. Reson. Med., 2015;73:2053-61.
[9] Fotso K, Dager SR, Landow A, et al., Diffusion tensor spectroscopic imaging of the human brain in children and adults. Magn. Reson. Med., 2017;78:1246-56.
[10] Boer VO, Ronen I, Pedersen J, Petersen ET, Lundell H., Metabolite diffusion weighted imaging with golden angle radial echo planar spectroscopic imaging. ISMRM 2019, p. 6534
[11] Lam F, Ma C, Clifford B, et al., High‐resolution 1H‐MRSI of the brain using SPICE: data acquisition and image reconstruction. Magn. Reson. Med., 2016;76:1059-70.
[12] Peng X, Lam F, Li Y, Clifford B, Liang ZP., Simultaneous QSM and metabolic imaging of the brain using SPICE. Magn. Reson. Med., 2018 Jan;79(1):13-21.
[13] Valette J, Giraudeau C, Marchadour C, et al., A new sequence for single‐shot diffusion‐weighted NMR spectroscopy by the trace of the diffusion tensor. Magn. Reson. Med., 2012;68:1705-12.
[14] Ma C, Lam F, Johnson CL, Liang ZP. Removal of nuisance signals from limited and sparse 1H MRSI data using a union‐of‐subspaces model. Magn. Reson. Med., 2016;75:488-97.
[15] Wang Z, Lam F. B0 inhomogeneity corrected reconstruction for low-resolution J-resolved MRSI using low-rank and spatial constraints, ISMRM 2020, p. 2911.
[16] Lam F, Cheng B, Liang ZP. Accelerated J-resolved MRSI using joint subspace and sparsity constraints, ISMRM 2017, p. 1202.
[17] Deelchand DK, Auerbach EJ, Marjańska M. Apparent diffusion coefficients of the five major metabolites measured in the human brain in vivo at 3T. Magn. Reson. Med., 2018;79:2896-901.
Figures