0331
MoG-QSM: A Model-based Generative Adversarial Deep Learning Network for Quantitative Susceptibility Mapping1School of Biomedical Engineering, Shanghai Jiao Tong University, Shanghai, China, 2School of Information Science and Technology, ShanghaiTech University, Shanghai, China
Synopsis
We proposed a model-based generative adversarial network for quantitative susceptibility mapping. Total 30 scans from six healthy subjects, acquired at five different head orientations, were employed for network training. The trained network provided superior image quality and accuracy quantification compared to recently developed QSM reconstruction methods. The proposed method showed excellent tissue susceptibility contrast and artifact suppression on the QSM images of patients with hemorrhage and multiple sclerosis, demonstrating potential clinical application in the future.
Introduction
Quantitative susceptibility mapping (QSM) has been demonstrated great potential in quantifying tissue susceptibility in various brain diseases. However, the intrinsic ill-posed inverse problem relating the tissue phase to the underlying susceptibility distribution affects the accurate quantification of tissue susceptibility. The existing deep learning based methods use neural networks to learn necessary features of QSM maps via data-driven. They lack interpretability and the generalization capability for learning the underlying physical relationship has not been proven yet. To address these challenges, we propose a model-based generative adversarial deep learning network for QSM reconstruction, referred to as MoG-QSM. MoG-QSM combines the strengths of QSM physical model and GAN to implicitly learn a powerful regularization term. It generates high quality and accurate QSM maps from single orientation phase maps and outperforms recently developed deep-learning-based QSM methods.Methods
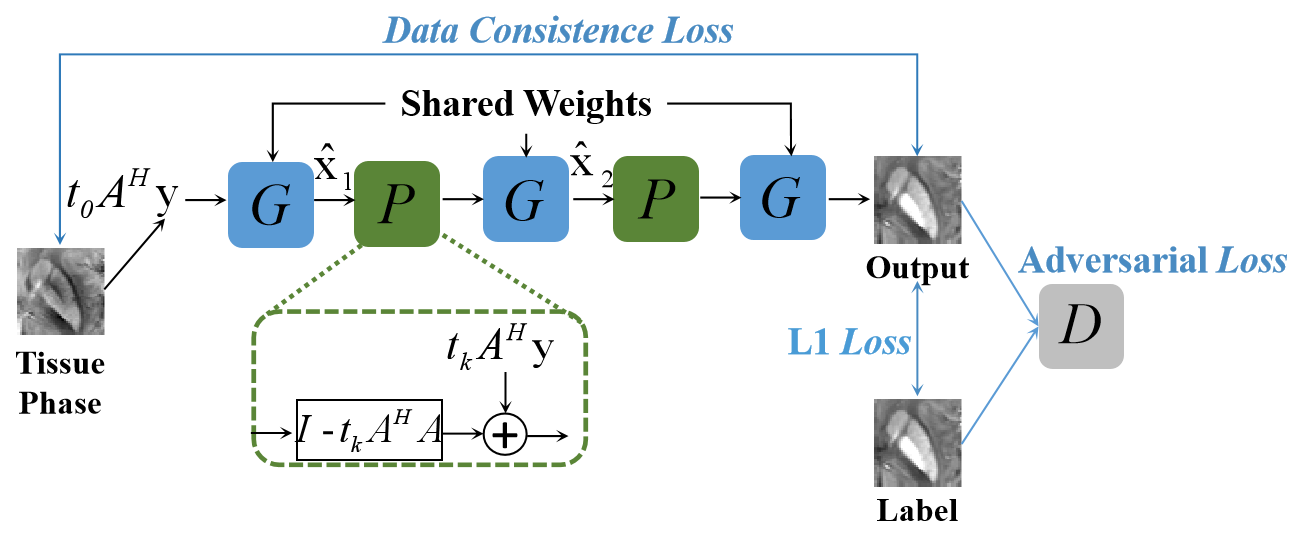
QSM reconstruction can be converted into a minimum optimization problem:$$\hat{x}=\mathop{\arg\min}_{x}\frac{1}{2} \ \ \| Ax-y\|^2_2+R(x) \tag{1}$$
Where $$$x$$$ is the desired susceptibility map, $$$y$$$ denotes tissue phase after background phase removal, $$$A=F^{-1}DF$$$ denotes the forward model from susceptibility to tissue phase, $$$F$$$ and $$$F^{-1}$$$ are discrete Fourier and inverse Fourier transform matrix and $$$D$$$ is the dipole kernel. $$$R(x)$$$ denotes the regularization term. To solve Eq. (1), we can use proximal gradient descent algorithm [1]. So the susceptibility map $$$x$$$ in the $$$k^{th}$$$ iteration can be expressed as:
$$\hat{x}^k=Prox_{t_k,R(x)}(t_kA^Hy+(I-t_kA^HA)\hat{x}^{k-1}) \tag{2}$$
Where $$$Prox_{t_k,R(x)}$$$ is the proximity operator associated with $$$R(x)$$$, $$$t_k$$$ is the step size of gradient descent, $$$A^H$$$ is the conjugate transpose of $$$A$$$, $$$I$$$ is the identity matrix. In our work, we unrolled Eq. (2) into three iterations and adopted generative adversarial network (GAN) to replace the proximity operator. GANs have a strong ability to automatically learn the underlying real sample distribution. The GAN in our work was trained to implicitly learn a powerful regularization term for high perceptual quality QSM reconstruction. The scheme of MoG-QSM was shown in Fig 1. To train the network, 30 scans from 6 healthy volunteers (5 head orientations per subject) were included for training. The tissue phase images were used as the input and the average STAR-QSM [2] images from the same subject were used as the label. The proposed network structure was implemented using Python 3.6.2 and Keras v2.2.5 with Tensorflow as the backend and trained on NVIDIA 1080TI GPU. To test the network’s ability to reconstruct QSM, the trained network was tested both on healthy subjects and patients with hematoma and Multiple Sclerosis (MS).
Results
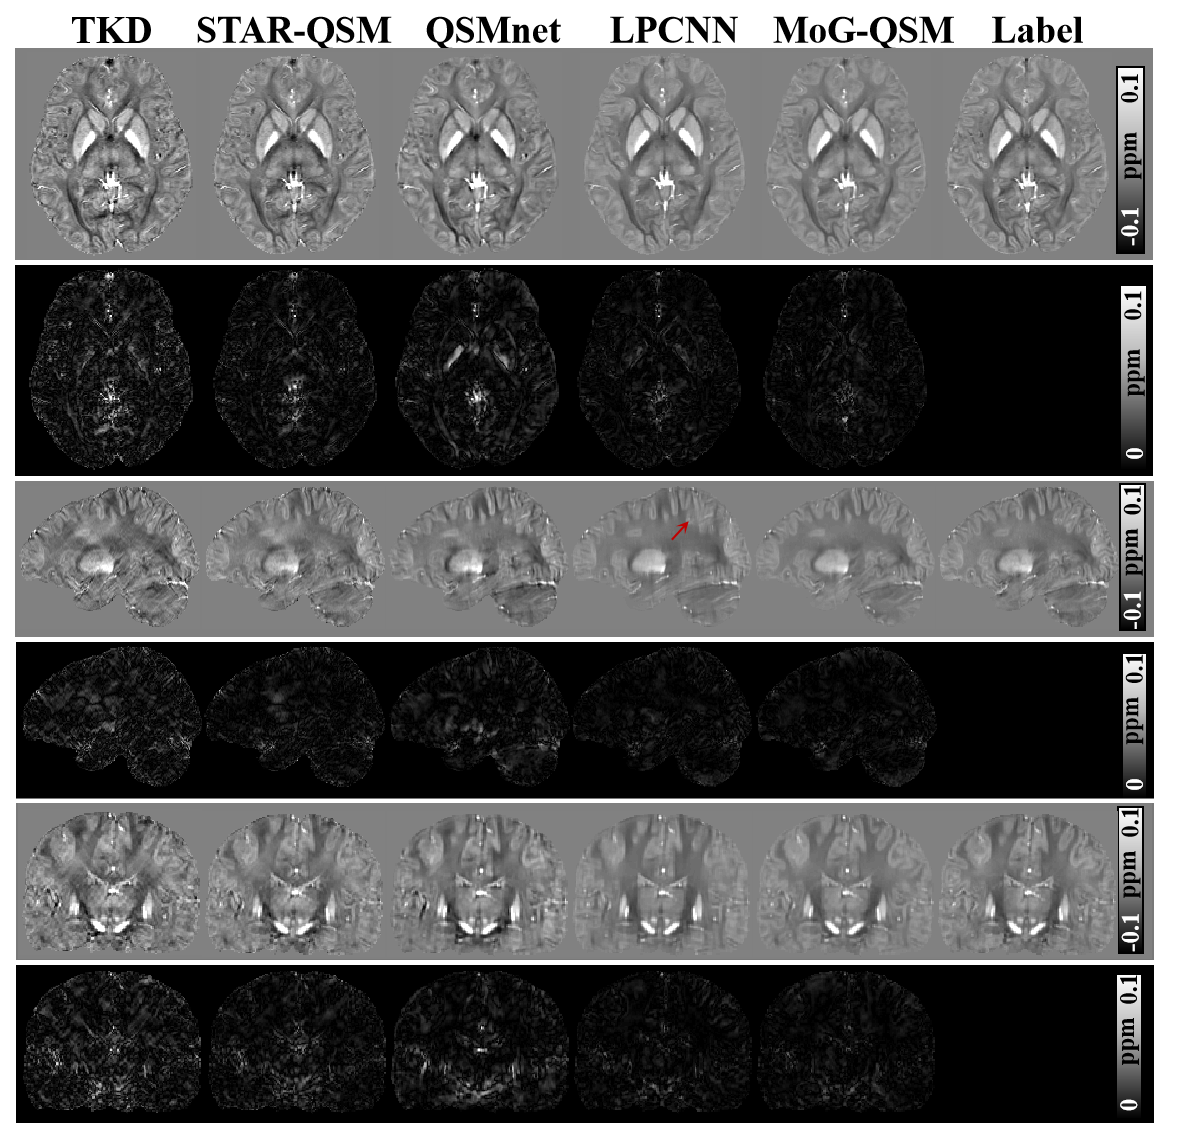
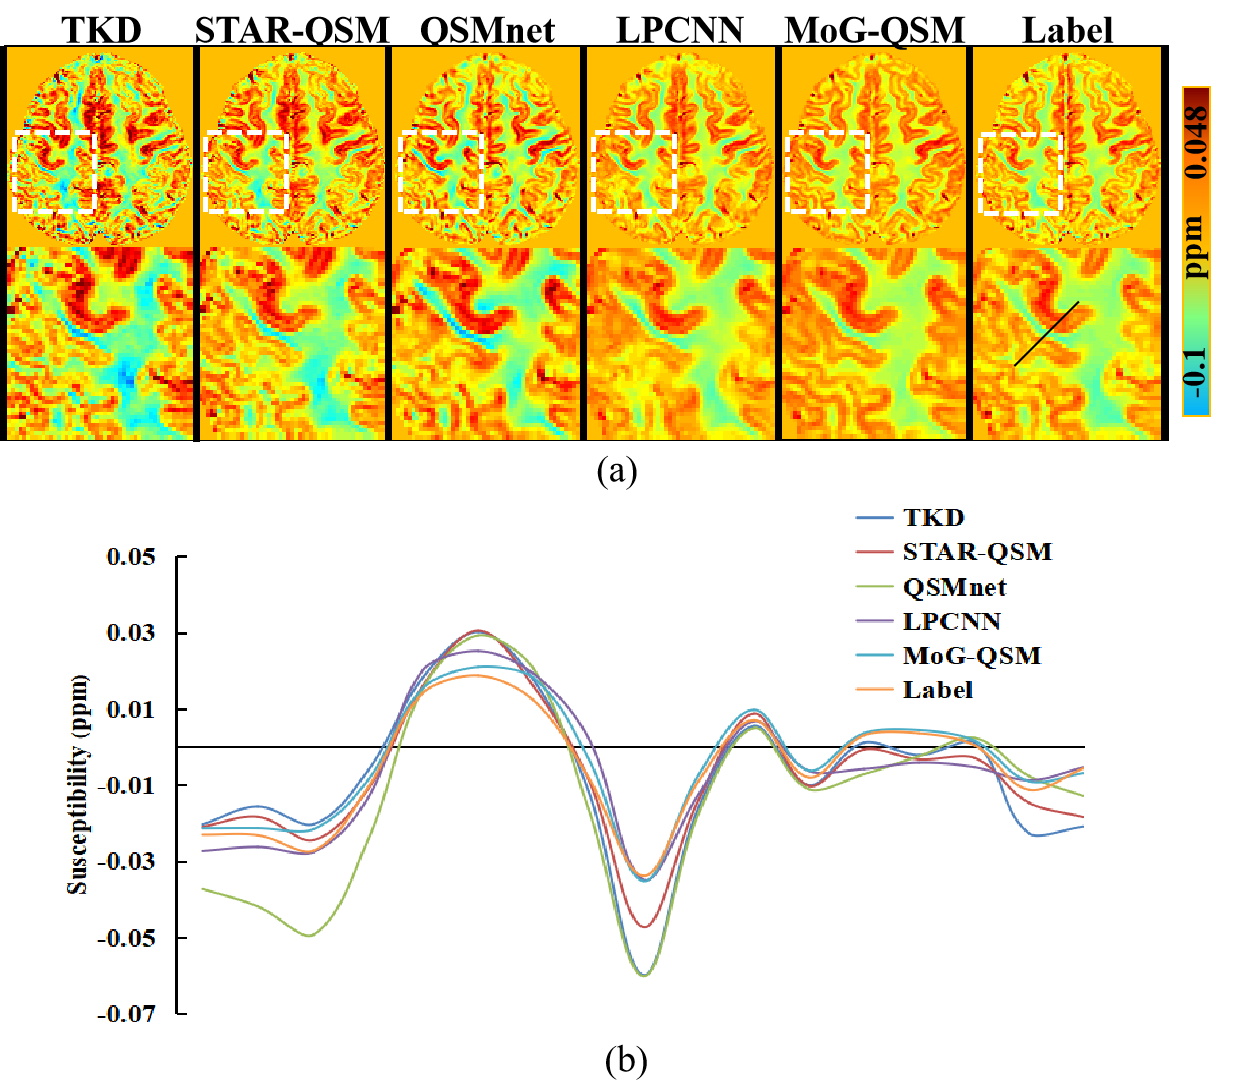
Fig. 2 shows three orthogonal views of QSM images and difference maps relative to the label on one healthy subject using five QSM reconstruction methods. TKD [3], STAR-QSM and QSMnet [4] exhibit residual artifacts that degrade the quality of reconstructed images. The streaking is hardly visible on the susceptibility maps reconstructed by LPCNN [5] and MoG-QSM. Moreover, when compared to the label, LPCNN exhibits blurred in the areas, e.g., the cortex as pointed by the red arrow, where the clear delineation between cortical gray and white matters was observed on MoG-QSM and the label images. The difference maps between LPCNN and the label images also demonstrated that susceptibility in the globus pallidus was underestimated compared to that of MoG-QSM.Fig.3(a) shows QSM reconstruction results in cortical areas. Visually, cortical susceptibility contrast provided by MoG-QSM is more similar to the label than other methods. In contrast, TKD, STAR-QSM and QSMnet show artifacts as colored by dark blue around the boundary between the cortex and the white matter. Additionally, LPCNN shows ambiguous cortical reconstructed QSM results. Quantitatively, the line profiles in Fig.3(b) showed that the susceptibility values in the cortex on MoG-QSM are more consistent with the label, demonstrating that quantification error is minor compared to other methods.
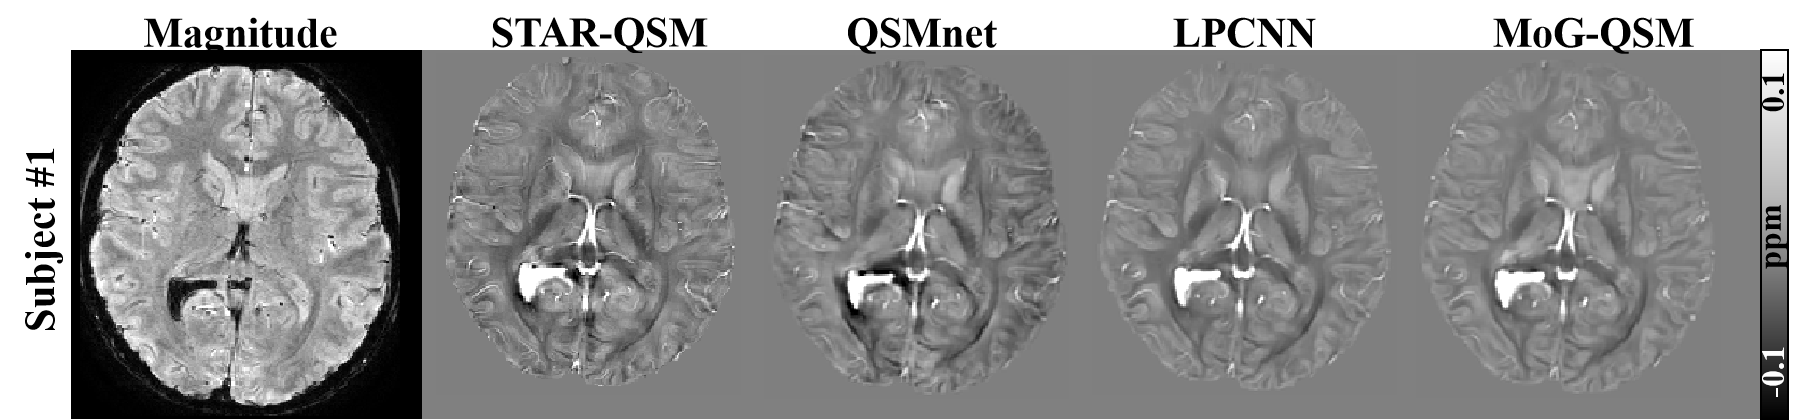
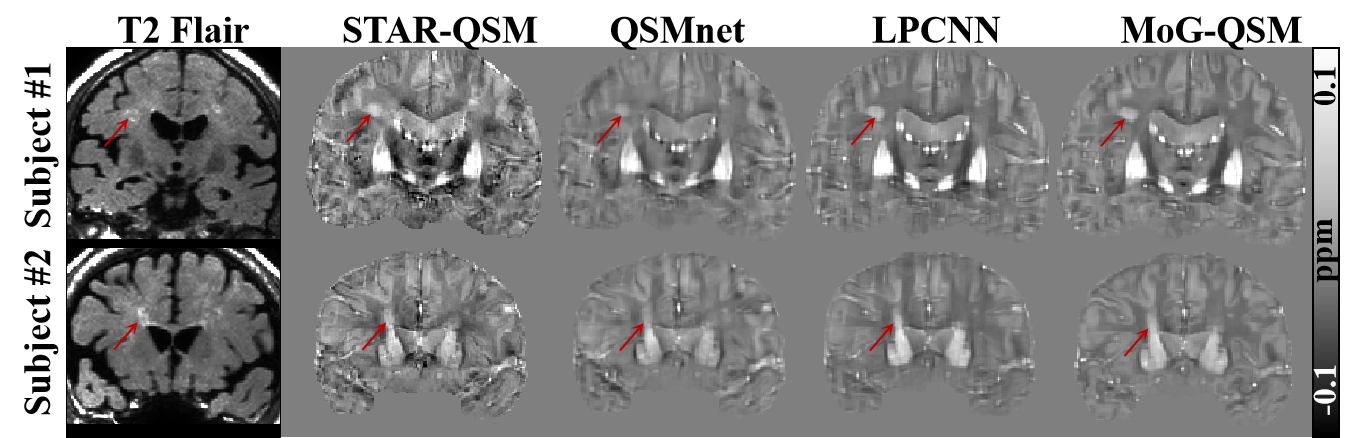
The MoG-QSM was also applied to patients with hematoma and MS. The QSM images of STAR-QSM and QSMnet exhibited blooming artifacts around the bleeding area, while LPCNN and MoG-QSM can well suppress the artifacts (Fig.4). Similarly, the QSM images of STAR-QSM and QSMnet did not provide a clear delineation between MS lesions and surroundings on the MS data (Fig.5). In contrast, the lesions’ boundaries can be well visible on the QSM images reconstructed by LPCNN and MoG-QSM.
Discussion
In this study, we constructed a model-based generative adversarial network for QSM reconstruction. This network introduced GAN to learn a regularization term in QSM physical model implicitly. Compared to other QSM reconstruction methods, our results show better QSM image quality and more accurate susceptibility quantification. The preliminary results tested on patients with hematoma and MS suggest that MoG-QSM can be applied to brain data dissimilar to the training data, which reveals that GAN has learned a powerful regularization for QSM inversion.Conclusion
Our results demonstrate a new paradigm for QSM reconstruction which combines the strengths of physical model and GAN. Our results demonstrate that MoG-QSM has superior image quality for accurately tissue susceptibility quantification.Acknowledgements
References
1. Parikh, N. and S. Boyd, Proximal algorithms. Foundations and Trends in optimization, 2014. 1(3): p. 127-239.
2. Wei, H., et al., Streaking artifact reduction for quantitative susceptibility mapping of sources with large dynamic range. NMR in Biomedicine, 2015. 28(10): p. 1294-1303.
3. Shmueli, K., et al., Magnetic Susceptibility Mapping of Brain Tissue In Vivo Using MRI Phase Data. Magnetic Resonance in Medicine, 2009. 62(6): p. 1510-1522.
4. Yoon, J., et al., Quantitative susceptibility mapping using deep neural network: QSMnet. Neuroimage, 2018. 179: p. 199-206.
5. Lai, K.-W., et al. Learned Proximal Networks for Quantitative Susceptibility Mapping. 2020. Cham: Springer International Publishing.
Figures