0326
Associations in Alzheimer’s disease between Intracranial Vascular Metrics from 4D-Flow MRI and β-Amyloid and Tau PET
Leonardo A Rivera-Rivera1,2, Karly A Cody1, Tobey Betthauser1, Robert V Cadman1, Thomas Reher3, Howard A Rowley3, Cynthia M Carlsson1, Laura Eisenmenger3, Sterling C Johnson1, and Kevin M Johnson2,3
1Department of Medicine, University of Wisconsin-Madison, Madison, WI, United States, 2Department of Medical Physics, University of Wisconsin-Madison, Madison, WI, United States, 3Department of Radiology, University of Wisconsin-Madison, Madison, WI, United States
1Department of Medicine, University of Wisconsin-Madison, Madison, WI, United States, 2Department of Medical Physics, University of Wisconsin-Madison, Madison, WI, United States, 3Department of Radiology, University of Wisconsin-Madison, Madison, WI, United States
Synopsis
Cerebrovascular disease (CVD), has been linked with mild cognitive impairment and dementia stages of Alzheimer’s disease (AD); however, the question of whether CVD is associated with underlying AD pathophysiology remains unresolved. There remain many questions regarding CVD/AD pathophysiology interactions and whether related clinical AD dementia is enhanced by CVD. In this study, we investigated the relationship between cardiac and low frequency flow oscillations from 4D-Flow, white matter hyperintensities (WMHs) from T2 FLAIR MRI, and AD pathology assessed using β-amyloid (Aβ) and tau PET imaging data.
Introduction:
Recent data suggests a potential compounding influence of cerebrovascular disease (CVD) on the pathologic trajectory of Alzheimer’s disease (AD).1 For example, animal studies have shown cardiac pulsations and vasomotion play a key role in brain clearance of AD related metabolites.2,3,4,5 A barrier to understanding AD and concomitant CV pathology is the lack of precise methods to measure vascular degeneration. MRI is currently used to aid in the characterization of CVD in AD typically based on the quantification of white matter hyperintensities (WMHs) seen on T2-FLAIR and cerebral perfusion from arterial spin labeling; however, WMHs and hypo-perfusion occur in other diseases and in normal aging. Intracranial 4D-Flow MRI is a technique with the ability to provide complementary vessel information to these measures. Using newly developed acquisition and reconstruction strategies, 4D-Flow MRI hemodynamic alterations have been observed in subjects diagnosed with AD clinical syndrome6; however, a syndrome is not an etiology.7 Clinical AD diagnoses often differ significantly (>35%) from final neuropathological diagnoses.8 Therefore, to study the relationship between CVD and AD, AD biomarker data are necessary. In this study we investigated the relationship between 4D-Flow and T2-FLAIR vascular markers including high frequency cardiac pulsations and low frequency oscillations (LFOs) and WMHs with AD biomarkers of β-amyloid deposition and neurofibrillary tau tangles using 11C-PiB and 18F-MK-6240 PET in both preclinical and clinical AD.Methods:
Subjects: A total of 115 subjects participated in this study (fig1). Subjects were clinically cognitively normal, except those in the impaired group A+/T+/IM (IM; impaired, n=9 MCI, n=5 AD). MRI: Whole brain 4D-Flow data were acquired on a 3.0T system (MR750, GE Healthcare) using a 32-channel head coil with a 3D radially undersampled sequence and the following imaging parameters Venc=80cm/s, imaging volume=22x22x16cm3, TR/TE=7.7/2.5ms, scantime~6.35min.9 To characterize LFOs 4D-Flow data were retrospectively reconstructed to absolute time using GPU accelerated (SigPy)10 iterative SENSE with JSENSE11 sensitivity maps and a local-low rank temporal constraint12. Reconstructions were performed with block shifting of a 16x16x16 block and an empirically tuned regularization parameter (λ=0.0001). Velocity data time series were reconstructed into 100 frames (temporal res ~3.8s, spatial res ~1.72mm3) and rigidly registered. In addition, 4D-Flow MRI data were also reconstructed with gating to the cardiac cycle (temporal res ~50ms, spatial res ~0.7mm3). This was done to characterize high frequency cardiac pulsations. Background phase and velocity aliasing corrections were performed.13 Intracranial arteries including internal carotid arteries (ICAs) and veins (superior sagittal sinus (SSS)) were segmented automatically in MATLAB (Mathworks, Natick, MA).14 Quantified flow parameters included: total cerebral blood flow, trans-capillary pulse wave delay, low frequency flow range and standard deviations, and LFOs from power spectral analysis. Trans-capillary pulse wave delay was defined as the time shift between arterial and venous cardiac waveforms measured from time-to-upstroke (maximum acceleration).15 Intracranial volumes (ICVs), CSF and hippocampal volume were segmented using T1-weighted data, SPM1216 and FSL FIRST17. WMHs lesion volumes were segmented from 3D T2-FLAIR images using a lesion segmentation tool for SPM12.18 PET: Amyloid and tau burden were assessed using 11C-PiB and 18F-MK-6240 PET, respectively.19 Three biomarker groups were established (A-T-, A+T-, A+T+) based on PET biomarker positivity, where amyloid positivity was determined using a previously established global PiB distribution volume ratio (DVR) threshold >1.19 and tau positivity was determined using a previously established entorhinal cortex MK-6240 standard uptake value ratio (SUVR) threshold >1.27.19,20 Pairwise statistical differences were assessed using ANOVA followed by post hoc analysis using the Tukey‐Kramer method (P<0.05 significance).Results:
Demographics, cardiovascular and AD biomarkers are summarized in figure 1. No significant AT biomarker group differences were observed across traditional cardiovascular and cerebrovascular metrics, including WMH lesion volumes. Cerebral blood flow was similar between AT groups (fig2 a); however, ICA trans-capillary pulse wave delay was significantly longer in controls when compared with AD biomarker confirmed groups (fig2 b) including cognitively normal and impaired amyloid and tau positive groups (P<0.001, P<0.001, P<0.001). Low frequency flow range and standard deviations in the ICA were significantly lower in AT positive groups both cognitively normal and impaired (fig3 a, b) (P=0.024, P=0.034). ICA and SSS LFOs were diminished in groups both amyloid and tau positive when compared to controls and amyloid positive only groups (fig 4). Overall, linear regression analysis showed a relatively weak correlation between ICA trans-capillary pulse wave delay and PiB and MK-6240 (R2=0.12, R2=0.03), and low frequency blood flow standard deviation and PiB and MK-6240 (R2=0.06, R2=0.04) (fig5.).Discussion and Conclusions:
Although more traditional measures of CVD were not related to biomarker groups, high frequency cardiac-resolved MRI suggests alterations in the cerebrovasculature are occurring in AD biomarker positive subjects during preclinical stage (e.g. A+/T-/CN, A+/T+/CN). The significantly shorter trans-capillary pulse wave delay might be an indicator of underlying AD pathology related artery and capillary stiffening and diminished caliber changes.21 In addition, low frequency time-resolved MRI showed decreased LFO content in amyloid+tau positive subjects, but not in A+ only. This result suggests compounding cerebrovascular modifications in amyloid+tau positive subjects related to changes in vessel smooth muscle cell, vasomotion and decreased autoregulation.22 4D-Flow measures were noisy and thus require acquisition and reconstruction improvements. Studies investigating interactions between vascular measures and AD biomarkers on cognitive trajectories are ongoing.Acknowledgements
We gratefully acknowledge research support from GE Healthcare, and funding support from the Alzheimer's Association (AARFD-20-678095) and from NIH grants R01NS066982, P50-AG033514, and R01AG021155.References
- Sweeney MD, Montagne A, Sagare AP, et al. Vascular dysfunction-the disregarded partner of Alzheimer's disease. Alzheimer's Dementia 2019,15 (1), 158–167.
- Hawkes CA, Jayakody N, Johnston DA, et al. Failure of Perivascular Drainage of β-amyloid in Cerebral Amyloid Angiopathy: Failure of Perivascular Drainage of β-amyloid. Brain Pathology 2014; 24: 396–403.
- Carare RO, Aldea R, Bulters D, et al. Vasomotion Drives Periarterial Drainage of Aβ from the Brain. Neuron 2020; 105: 400–401.
- van Veluw SJ, Hou SS, Calvo-Rodriguez M, et al. Vasomotion as a Driving Force for Paravascular Clearance in the Awake Mouse Brain. Neuron 2020; 105: 549-561.e5.
- Mestre H, Tithof J, Du T, et al. Flow of cerebrospinal fluid is driven by arterial pulsations and is reduced in hypertension. Nature Communications; 9. Epub ahead of print December 2018. DOI: 10.1038/s41467-018-07318-3.
- Rivera-Rivera LA, Cody KA, Rutkowski D, et al. Intracranial vascular flow oscillations in Alzheimer’s disease from 4D flow MRI. NeuroImage: Clinical 2020; 28: 102379.
- Jack Jr CR, Bennett DA, Blennow K et al. NIA-AA Research Framework: Toward a biological definition of Alzheimer's disease. Alzheimers Dement. 2018 Apr; 14(4):535-562. doi: 10.1016/j.jalz.2018.02.018.
- Selvackadunco S, Langford K, Shah Z, et al. Comparison of clinical and neuropathological diagnoses of neurodegenerative diseases in two centres from the Brains for Dementia Research (BDR) cohort. J Neural Transm (Vienna). 2019; 126(3): 327–337.
- Johnson KM, Lum DP, Turski PA, et al. Improved 3D Phase Contrast MRI with Off-resonance Corrected Dual Echo VIPR. Magn Reson Med. 2008 Dec; 60(6): 1329–1336.
- Ong F, Lustig M. SigPy: A Python Package for High Performance Iterative Reconstruction. 27th Annual ISMRM Meeting, Montreal, Canada, p. 4819.
- Ying L, Sheng J. Joint image reconstruction and sensitivity estimation in SENSE (JSENSE). Magn Reson Med. 2007 Jun;57(6):1196-202.
- Jimenez JE, Strigel RM, Johnson KM, et al. Feasibility of high spatiotemporal resolution for an abbreviated 3D radial breast MRI protocol. Magn Reson Med. 2018 Oct;80(4):1452-1466.
- Loecher M, Schrauben E, Johnson KM, et al. Phase unwrapping in 4D MR flow with a 4D single-step laplacian algorithm. J Magn Reson Imaging 2016; 43: 833–842.
- Schrauben E, Wåhlin A, Ambarki K, et al. Fast 4D flow MRI intracranial segmentation and quantification in tortuous arteries. J Magn Reson Imaging. 2015 Nov;42(5):1458-64.
- Rivera-Rivera LA, Schubert T, Turski P, et al. Changes in intracranial venous blood flow and pulsatility in Alzheimer's disease: A 4D flow MRI study. J Cereb Blood Flow Metab. 2017 Jun;37(6):2149-2158.
- Allison, S.L., Koscik, R.L., Cary, R.P., et al. Comparison of different MRI-based morphometric estimates for defining neurodegeneration across the Alzheimer's disease continuum. NeuroImage: Clin. 2019 23, 101895.
- Patenaude, B., Smith, S.M., Kennedy, D., and Jenkinson M. A Bayesian Model of Shape and Appearance for Subcortical Brain NeuroImage, 56(3):907-922, 2011.
- Schmidt P., Gaser C., Arsic M., et al. An automated tool for detection of FLAIR-hyperintense white-matter lesions in multiple sclerosis. Neuroimage. 2012;59:3774–3783.
- Betthauser TJ, Koscik RL, Jonaitis EM, et al. Amyloid and tau imaging biomarkers explain cognitive decline from late middle-age. Brain 2020; 143: 320–335.
- Racine AM, Clark LR, Berman SE, et al. Associations between Performance on an Abbreviated CogState Battery, Other Measures of Cognitive Function, and Biomarkers in People at Risk for Alzheimer’s Disease. J Alzheimers Dis 2016; 54: 1395–1408.
- Iliff JJ, Wang M, Zeppenfeld DM, et al. Cerebral arterial pulsation drives paravascular CSF‐interstitial fluid exchange in the murine brain. J Neurosci. 2013;33(46):18190‐9.
- Aldea R, Roy O Weller RO, Donna M Wilcock DM, et al. Cerebrovascular Smooth Muscle Cells as the Drivers of Intramural Periarterial Drainage of the Brain. Front Aging Neurosci. 2019 Jan 23;11:1
Figures
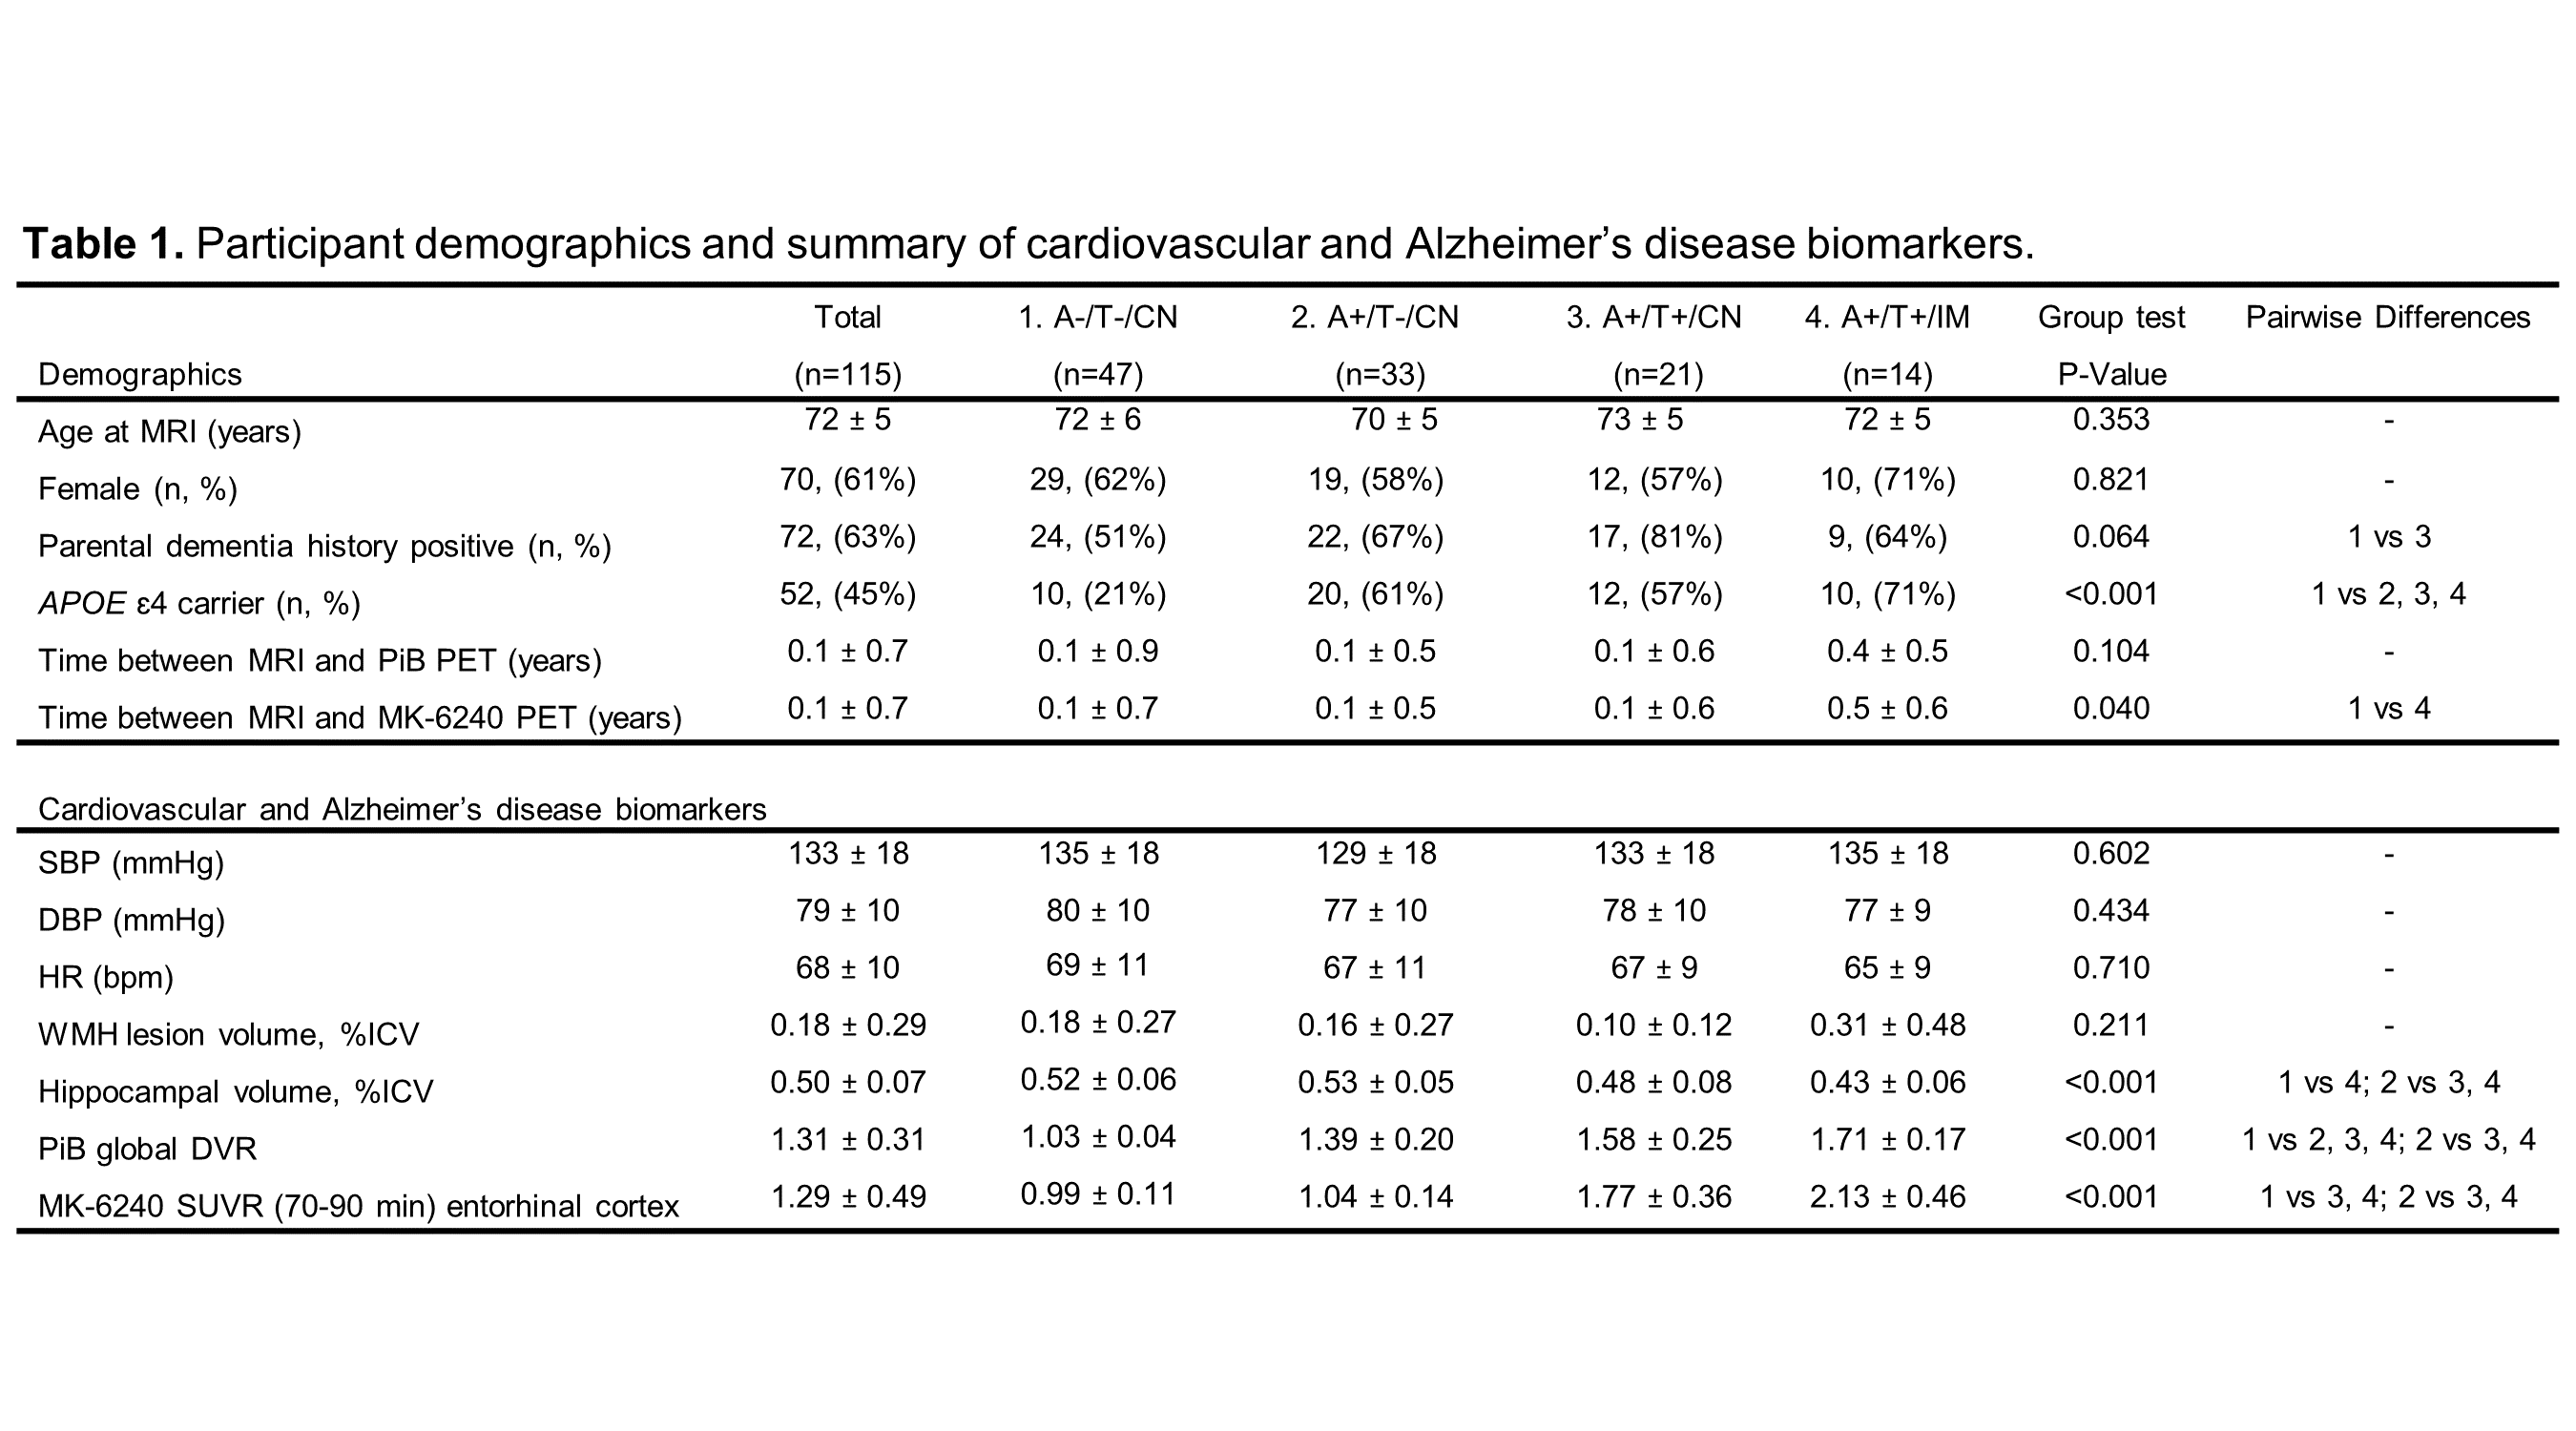
Figure 1. A+/− and T+/− represent
amyloid-β and tau tangle positivity groups determined by 11C-PiB and
18F-MK-6240 PET respectively. Pairwise differences were assessed using ANOVA
followed by post hoc analysis using the Tukey‐Kramer method (P<0.05 significance). Abbreviations:
CN, cognitively normal; IM, impaired; APOE, apolipoprotein E; WMH, white matter
hyperintensity; SBP, systolic blood pressure; DBP, diastolic blood pressure;
HR, heart rate; ICV, intracranial volume; PiB, 11C-Pittsburgh
compound B; DVR, distribution volume ratio; SUVR, standard uptake value ratio.
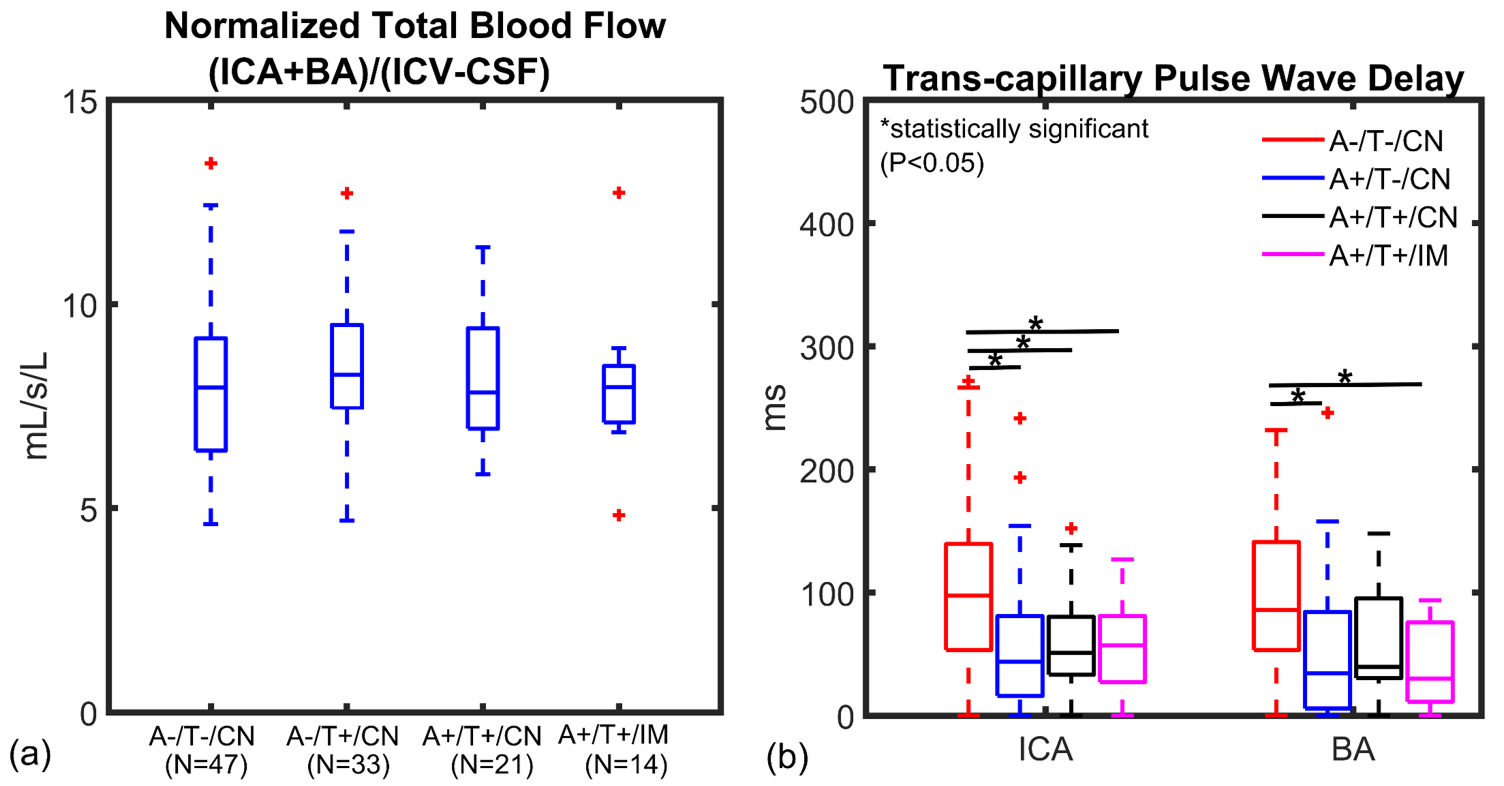
Figure 2. Cardiac-resolved
4D-Flow MRI data are summarized for controls and AD biomarker confirmed groups
(amyloid positive (A+), tau positive (T+), cognitively normal (CN), cognitively
impaired (IM)). (a) Cerebral blood flow (basilar (BA) + internal carotid artery
(ICA)) was normalized to brain volume and was similar between groups. (b) ICA
trans-capillary pulse wave delay time was significantly longer in the control
group (A-/T-/CN) when compared to A+/T-/CN (P<0.001), A+/T+/CN (P<0.001)
and (A+/T+/IM) (P<0.001). AD biomarker confirmed subjects showed similar
delay times.
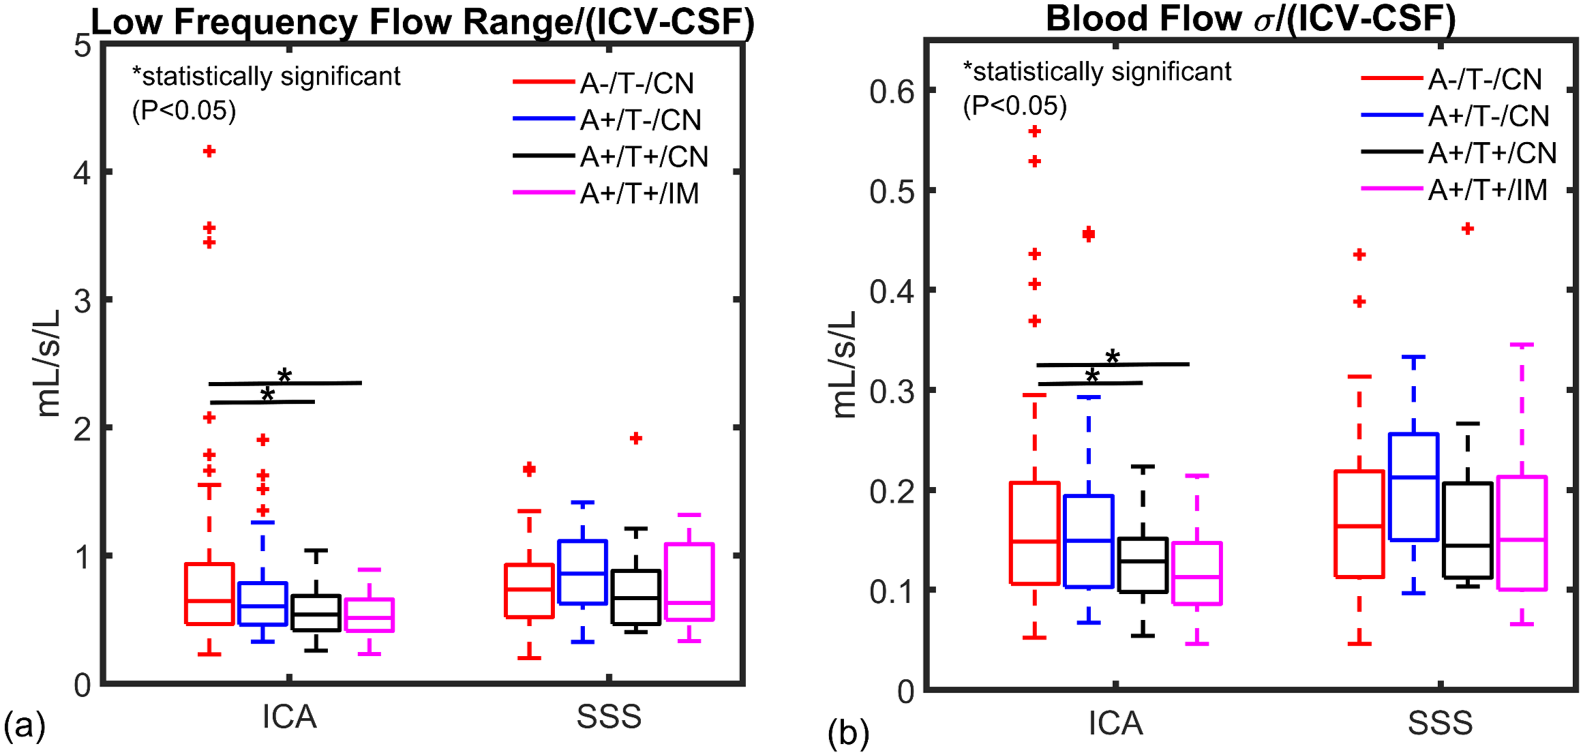
Figure
3. Low frequency
time-resolved 4D-Flow MRI data are summarized for controls and AD biomarker
confirmed groups (amyloid positive (A+), tau positive (T+), cognitively normal
(CN), cognitively impaired (IM)). Brain volume normalized low frequency flow
range and standard deviation (σ) were significantly lower in the arterial
circulation (internal carotid artery (ICA)) in amyloid and tau positive
cognitively normal and impaired groups (A+/T+/CN, A+/T+/IM) when compared to
controls (A-/T-/CN) (P=0.024, P=0.034). Relationships were not observed
in the venous circulation.
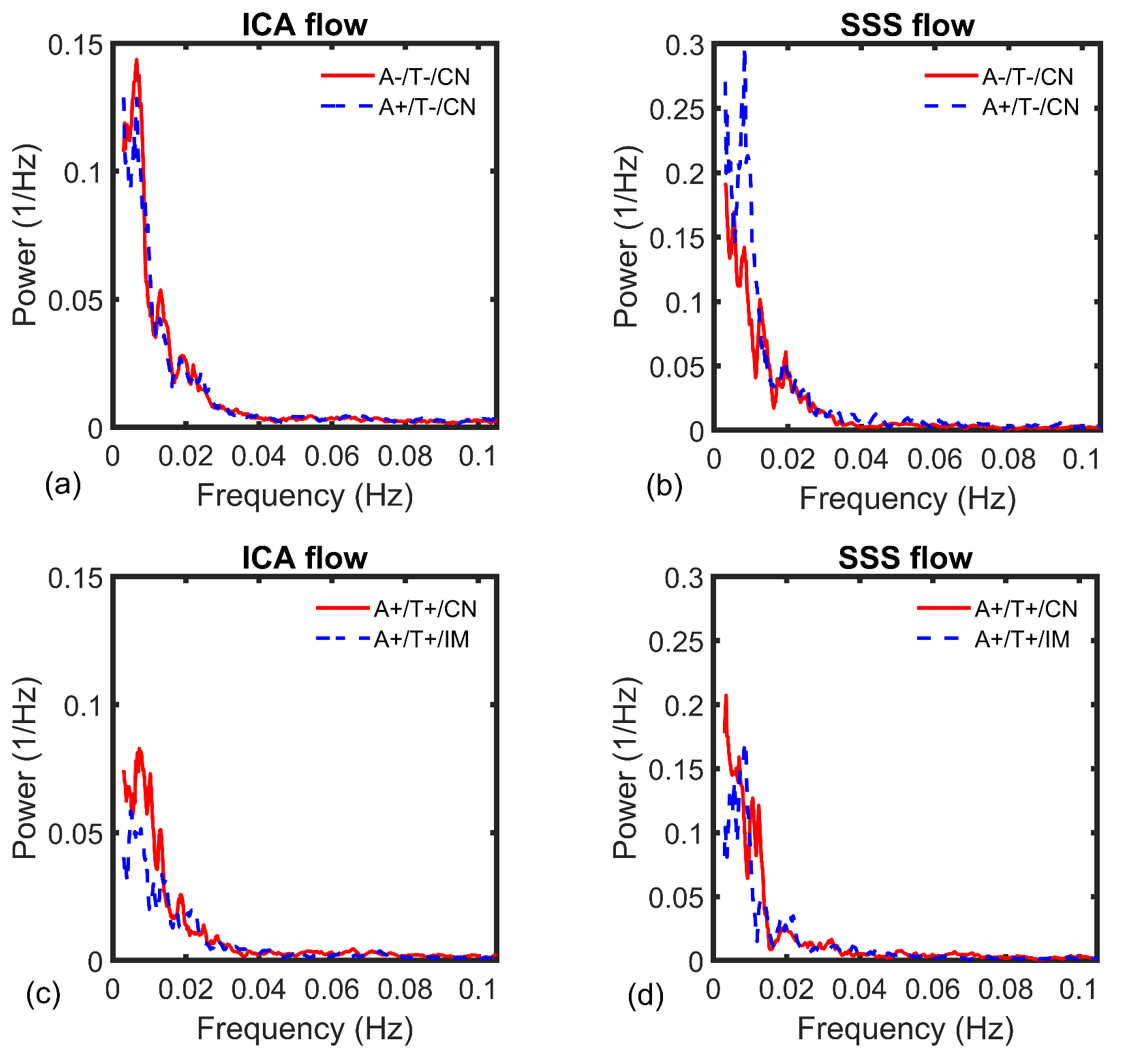
Figure
4. Power spectrum
density shows average low frequency content derived from time-resolved 4D-Flow data
in the internal carotid artery (ICA) (a, c) and superior sagittal sinus (SSS)
(b, d) for tau negative (A-/T-/CN, A+/T-/CN) (a, b) and tau positive groups (A+/T+/CN,
A+/T+/IM) (cognitively normal (CN), cognitively impaired (IM)) (c, d). Diminished
frequency content was measured in both A+/T+/CN and A+/T+/IM groups when
compared to tau negative groups. ICA frequency content was significantly
diminished in A+/T+/CN vs A-/T-/CN
(P=0.049) (A+/T+/IM vs A-/T-/CN, P=0.063).
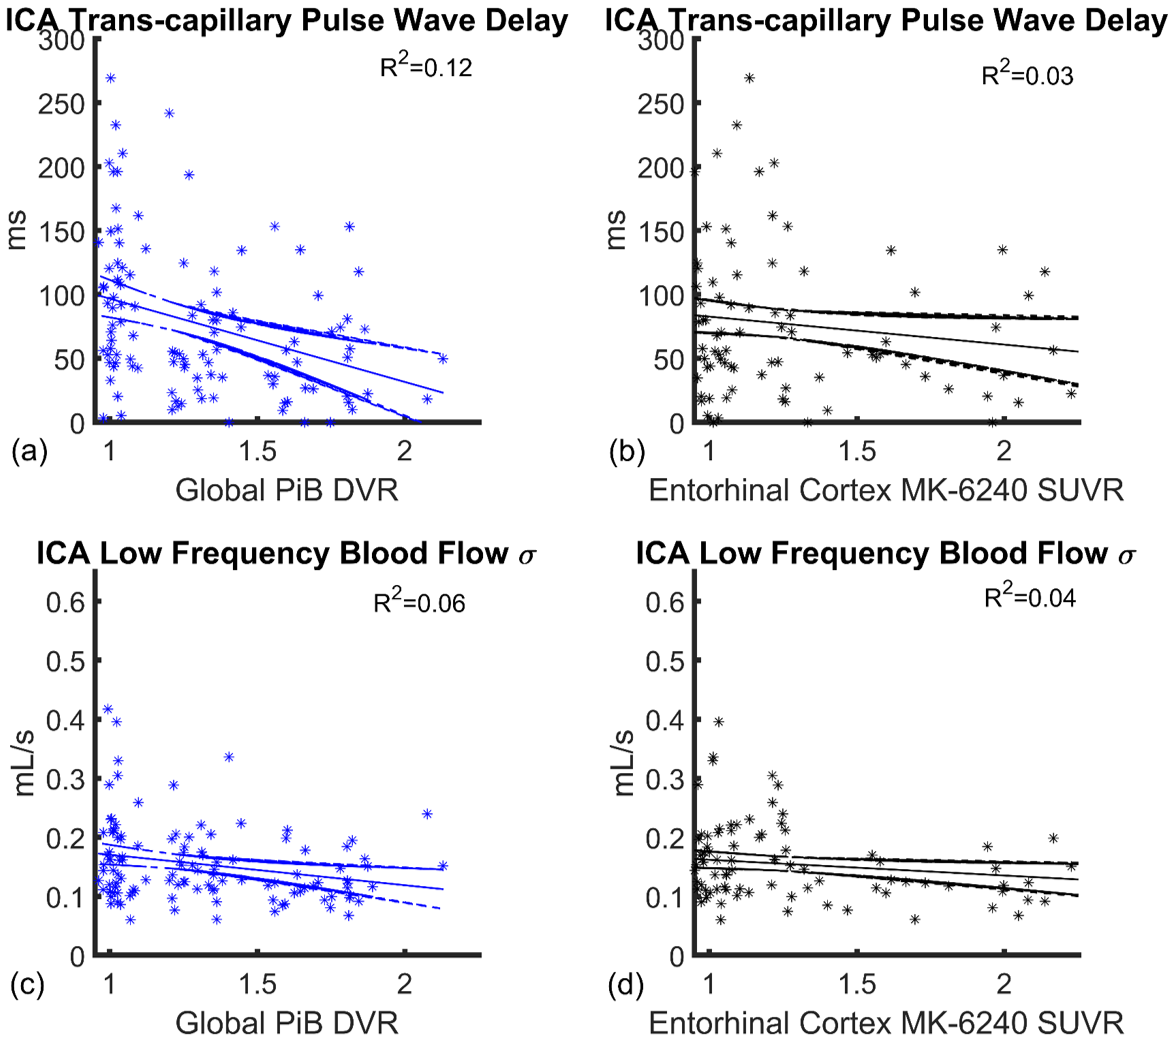
Figure
5. Linear regressions
with 95% confidence intervals showing internal carotid artery (ICA)
trans-capillary pulse wave delay (a, b) and low frequency blood flow standard
deviation (c, d) as a function of global PiB distribution volume ratio (DVR)
and enthorinal cortex MK-6240 standard uptake value ratio (SUVR) in all participants
(n=115). Linear correlations were relatively weak with coefficients of R2=0.12
(trans-capillary pulse wave delay vs PiB DVR), R2=0.03 (MK-6240
SUVR) and R2=0.06 (low frequency blood flow standard deviation vs
PiB DVR), R2=0.04 (MK-6240 SUVR).