0325
Alterations of Structural-Functional Coupling in Amyloid-Positive and Negative Mild Cognitive Impairment Patients1Department of Diagnostic Radiology, The University of Hong Kong, Hong Kong, Hong Kong, 2Alzheimer's Disease Research Network, The University of Hong Kong, Hong Kong, Hong Kong, 3Department of Rehabilitation Science, The Hong Kong Polytechnic University, Hong Kong, Hong Kong, 4State Key Laboratory of Brain and Cognitive Sciences, The University of Hong Kong, Hong Kong, Hong Kong
Synopsis
To identify the structural and functional abnormalities in mild cognitive impairment (MCI) amyloid positive patients, combined resting state fMRI (rs-fMRI) and diffusion kurtosis imaging (DKI) were applied in this study. Graph theory metrics of subgroups were calculated and compared. In the results, MCI amyloid positive had impaired structural connectivity (SC) but not functional connectivity (FC) matrices and demonstrated significant SC-FC decoupling. We postulated that structural damage preceded functional reorganization. The pathological effects of fibrillar amyloid plaque toxicity occur in anatomical pathways, and functional reorganization might happen beyond the confines of structural pathways.
Introduction
Amyloid-β (Aβ) deposition is of great significance in Alzheimer’s disease (AD) and the further understanding of Aβ burden might lead to the successful therapeutic intervention.1 Several studies have investigated the effect of amyloid on structural or functional brain changes by magnetic resonance imaging and positron emission tomography in healthy adults and patients with mild cognitive impairment (MCI) or AD.2,3 However, little is known about how the alterations of structural-functional connectivity coupling relate to Aβ plaques. In this study, graph theory analysis was applied to investigate the small worldness respectively in structural and functional connectivities in MCI-Aβ positive, MCI-Aβ negative and healthy controls. Furthermore, structural and functional connectivities were combined to explore how these two modalities relate to each other in these three groups.Methods
Thirty-three patients with MCI were recruited from the memory clinic of a university hospital and underwent 18F-flutametamol PET-CT scans. The dose of 185 MBq 18F-flutametamol was injected 90 min before image acquisition. Composite Z-score of each subject either above or below the threshold (uptake ratio-0.62) was used as a cut-off to determine the positivity and negativity of the amyloid scans.4 There are 21 Aβ negative (Age: 75.9±7.0 years old, Sex: 11F/10M) and 12 Aβ positive (Age: 74.6±7.2 years old, Sex: 7F/5M) subjects. Fourteen healthy controls (HC, Age: 52.3±16.5 years old, Sex: 7F/7M) were recruited from community centers. All subjects also underwent MRI examination using a 3T MR scanner (Philips, Achieva) with a 32-channel head coil. Structural images were acquired with 3D T1-weighted sequence using magnetization prepared rapid gradient-echo imaging (MPRAGE, TR=6.8 ms, TE=3.2 ms, thickness=1.2 mm, Flip angle=8°, FOV=256×240×204 (mm)). The diffusion-weighted images (DWI) were acquired with TR/TE of 3900/81 ms, 2.9× 2.9 × 3 mm3 voxel size, b-values of 0, 1000, 2000 s/mm2 and 30 gradient sensitising directions. Resting-state functional images were collected by using a gradient-echo echo-planar sequence (parameters: TR=2000ms, TE=30ms, flip angle=90°, voxel size=1.6×1.6×4 𝑚𝑚3) sensitive to blood-oxygen-level-dependent (BOLD) contrast.The preprocessing of DWI data were corrected for motion and eddy current geometric distortions and non-brain tissues were removed using fMRI Software Library (FSL, http://fsl.fmrib. ox.ac.uk/fsl). To estimate the metrics fractional anisotropy (FA) and mean kurtosis (MK), the toolbox Diffusional Kurtosis Estimator (DKE, http://academicdepartments.musc.edu/cbi/dki/dke.html) was used. After the diffusion kurtosis images (DKI) approximation of the diffusion orientation distribution function (dODF), the fiber bundle orientations were estimated from DKI with FA>0.1 and angle>35°. Based on the DKI tractography, fiber number (FN), fiber length (FL), FA and MK were then mapped into the Automated Anatomical Labeling (AAL) template to produce a 90×90 structural connectivity (SC) matrix.
The analysis of fMRI data was performed using the Data Processing Assistant for Resting-State fMRI (DPARSF) and Statistical Parametric Mapping (SPM12). Based on the AAL template, the preprocessed fMRI data were segmented into 90 regions. We applied the Fisher Z-Transformation to covert the correlation coefficients so that the data became normally distributed. The functional connectivity (FC) and SC matrices of HC, MCI-Aβ positive and negative subjects were analysed using the small-world network model. The properties (clustering coefficient (γ), characteristic path length (λ) and small worldness (S)) were computed using brain connectivity toolbox (BCT, http://www.brain-connectivity-toolbox.net/) with connection density from 5% to 20%.
We assessed SC-FC coupling as the correlation coefficient between the strengths of structural networks (FN, FL, FA and MK) and functional connectivities. The structural matrices were rescaled into a Gaussian distribution. At last, the SC-FC coupling was quantified by Pearson’s coefficient of correlation. Decoupling is defined as the SC-FC coupling values in subgroups that have significant differences from HC.
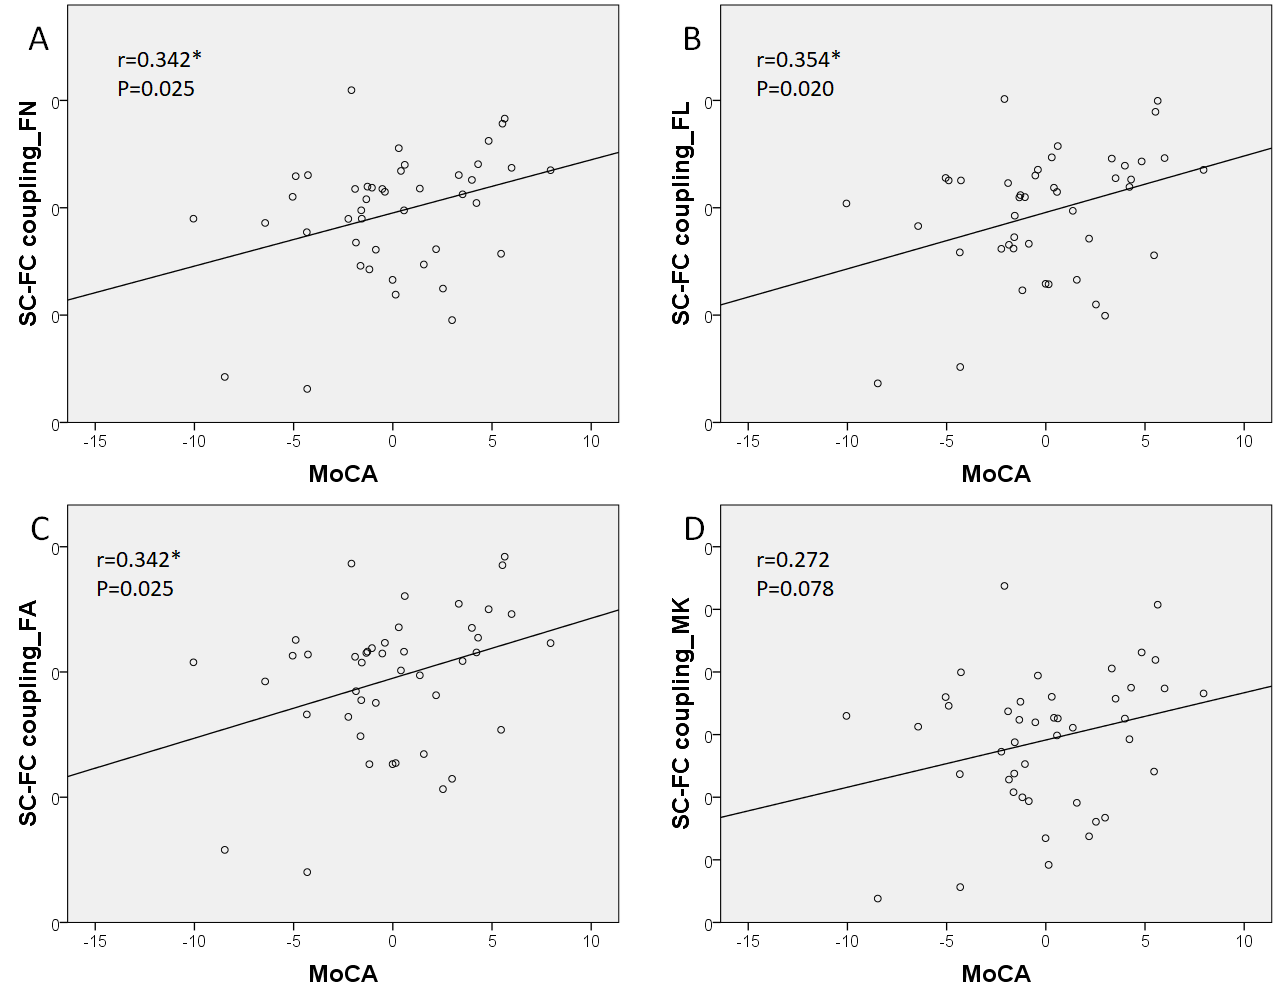
One-way ANOVA was used to compare among the three groups and the post-hoc test was applied to compare between each two groups. The relationships between MoCA score and SC-FC coupling were estimated based on the partial Pearson correlation method. (SPSS Inc., Chicage, USA).
Results
The characteristics of patients and HC are summarized in Table 1. No significance was found in FC among groups and between each two groups (Figure 1). Characteristic path length in SC matrices of FA, FL, FA and MK showed significant difference among MCI_postive, MCI_negative and HC. In Figure 2, statistical difference could be seen between HC and MCI_positive and between HC and MCI_negative in characteristic path length of four SC matrices, and in small worldness of MK. In Table 1 and Figure 3, SC-FC decoupling was observed in MCI-positive group from FN, FA and MK matrices. In addition, the decoupling was significantly positively correlated with MoCA score (Figure 4, adjusted with age).Discussion and conclusion
Structural damage has been shown in MCI patients, as we found an increased characteristic path length in DKI matrices. Small-world network represented the balance to minimize the resource cost and maximize the flow of information among regions.5 The increase of path length indicated more cost for global integration. Meanwhile, functional connectivity remained globally normal. This demonstrated structural damage preceded the functional reorganization. Compared with Aβ negative, the MCI positive patients showed significant global decoupling with HC, which suggesting the pathological effects of fibrillar amyloid plaque toxicity in anatomical pathways and functional reorganization happens beyond the confines of structural pathways.Acknowledgements
This work was supported by the State Key Laboratory of Brain and Cognitive Sciences, the University of Hong Kong.References
1. Beyreuther K, Bush AI, Dyrks T, et al. Mechanisms of amyloid deposition in Alzheimer's disease. Ann N Y Acad Sci 1991;640:129-39.
2. Zhou Y, Yu F, Duong TQ, Alzheimer's Disease Neuroimaging I. White matter lesion load is associated with resting state functional MRI activity and amyloid PET but not FDG in mild cognitive impairment and early Alzheimer's disease patients. J Magn Reson Imaging 2015;41:102-9.
3. Seo EH, Park WY, Choo IH. Structural MRI and Amyloid PET Imaging for Prediction of Conversion to Alzheimer's Disease in Patients with Mild Cognitive Impairment: A Meta-Analysis. Psychiatry Investig 2017;14:205-15.
4. Thurfjell L, Lilja J, Lundqvist R, et al. Automated quantification of 18F-flutemetamol PET activity for categorizing scans as negative or positive for brain amyloid: concordance with visual image reads. J Nucl Med 2014;55:1623-8.
5. Farahani FV, Karwowski W, Lighthall NR. Application of Graph Theory for Identifying Connectivity Patterns in Human Brain Networks: A Systematic Review. Front Neurosci 2019;13:585.
Figures
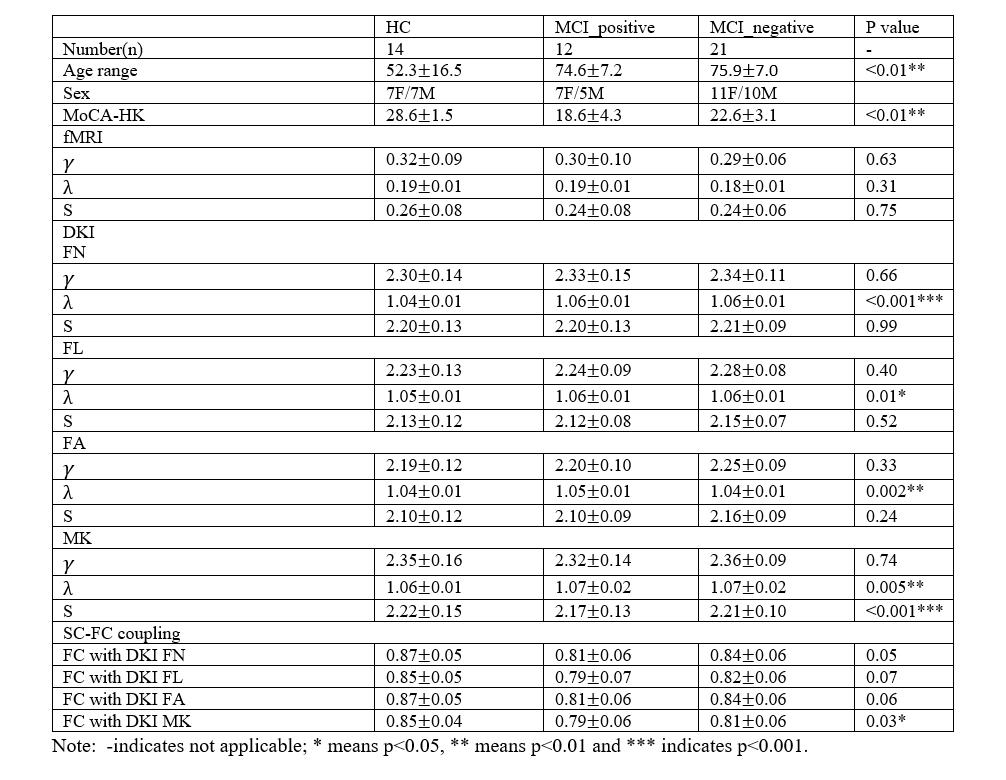
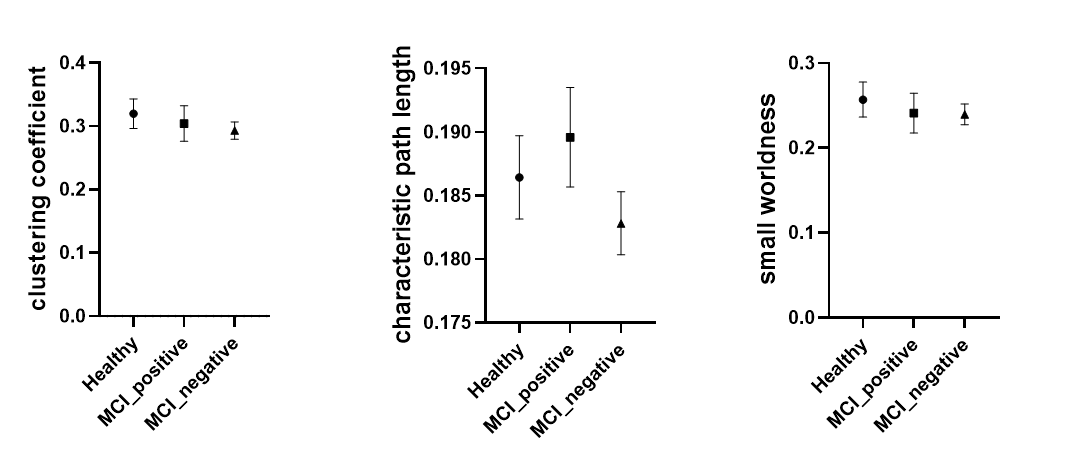
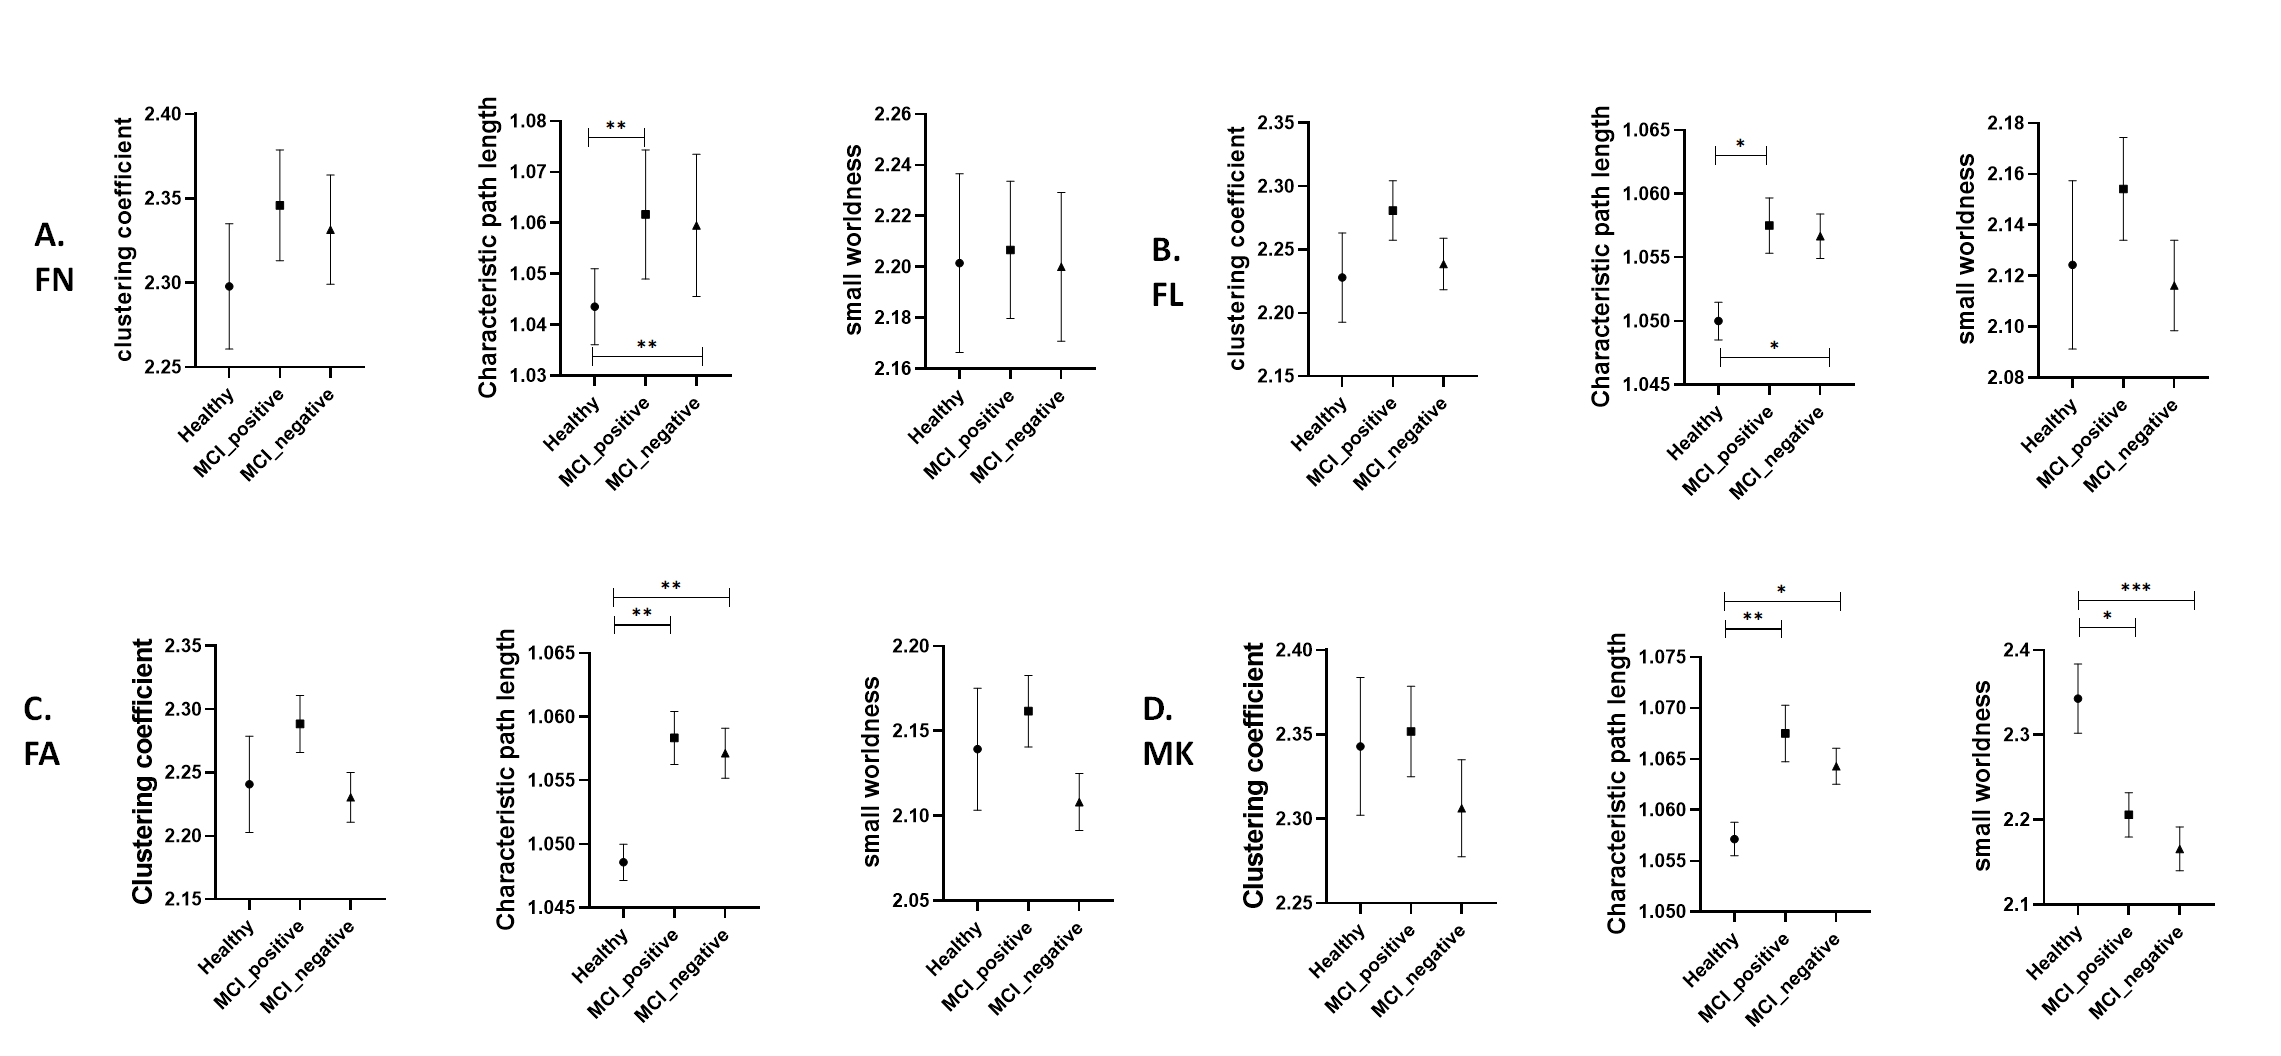
Figure 2. Group differences of clustering coefficient, characteristic path length and small worldness in four structural connectivity matrices:
A. FN; B. FL; C. FA; D. MK
* means p<0.05, ** means p<0.01 and *** indicates p<0.001.
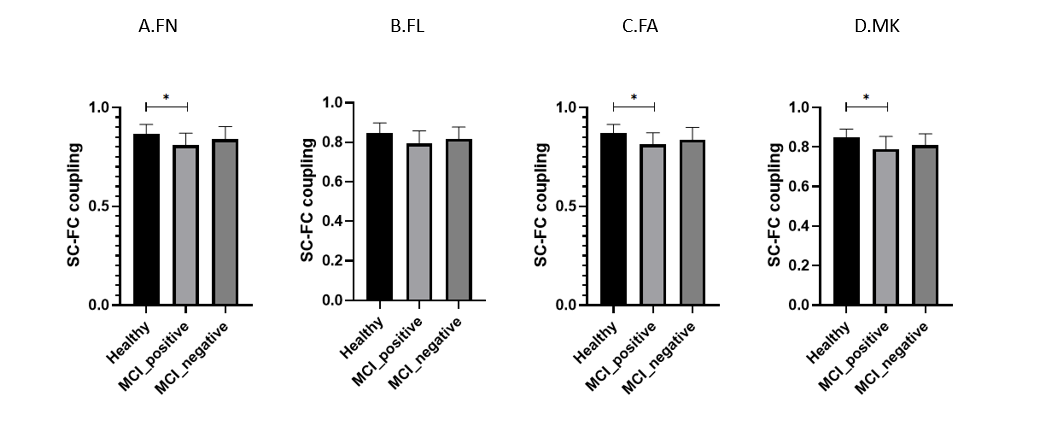
Figure 3. Structural-functional coupling comparison between groups (Post-hoc test after one-way ANOVA):
A. FN: HC vs. MCI positive, p=0.041*
B. FL: no significant difference between each two groups
C. FA: HC vs. MCI positive, p=0.048*
D. MK: HC vs. MCI positive, p=0.027*